A multitude of clinical scores exist to evaluate the patient’s condition before emergency surgery. The majority of these scores take age into consideration. Indeed, elderly patients are exposed to high rate of mortality [1]. This can be related to the disease, to the patient condition and comorbidities or to the type of surgery [2]. The management of these patients can be enhanced by predicting the postoperative mortality.
We aimed at identifying the factors predicting mortality among elderly patients (≥70 years), operated for an abdominal emergency. We have also validated the scores and indexes to predict this mortality.
Materials and Methods
Patients: In the present study, a case-control study including patients age 70 years and older, operated for abdominal emergency in the emergency surgery department between January 2008 and December 2013. The present study, compared 70-year-old and older patients, who had died after undergone urgent abdominal surgery during that period. The DG including 50 consecutive patients with a CG group including 50 patients.
Inclusion and exclusion criteria: A consecutive list of all patients (291) aged 70 years and older was established according to the admission registry of the emergency surgery department. A numeric code was assigned to each patient. For DG, inclusion criterion was death occurring within 30 days postoperatively or during the same hospitalisation. Patients, whose deaths were not recorded in the department’s death register, were excluded from DG. The CG consisted of 50 patients randomly selected from this list of 291 patients. If the patient, randomly assigned, belonged to the DG, he was excluded from CG and we referred to the consecutive patient on the list.
Data Collection
We analysed all the data related to the patients characteristics, pathology, per operative findings and therapeutic management. Ethics Approval was obtained from the hospital Ethical Committee.
The mean age of the patients was 77 years in DG and 76.2 years for CG. The sex ratio in DG was 1.27 and 1.17 in CG. Of the total 36 (72%) patients in each group had, at least, one comorbidity.
The preoperative diagnoses were divided into three groups: ‘Hepatobiliary emergencies’, ‘Neoplastic emergencies’ and ‘other emergencies’. Of the total, 15 (30%) patients had hepatobiliary emergencies in DG and 9 (18%) patients in CG. Neoplastic pathologies represented the diagnoses equally in 4 (8%) patients in each group. Other diagnoses were made for 31 (62%) patients of DG and 37 (74%) patients in CG [Table/Fig-1].
Distribution of patients according to preoperative diagnosis.
| Distribution of patients | DG | CG |
|---|
| Acute cholecystitis | 5 (10%) | 5 (10%) |
| Acute cholangitis | 5 (10%) | 2 (4%) |
| Acute pancreatitis | 3 (6%) | 1 (2%) |
| Liver abscess | 1 (2%) | 1 (2%) |
| Hydatid cyst of the liver complicated of infection | 1 (2%) | 0 |
| Neoplasic pathology | 4 (8%) | 4 (8%) |
| Intestinal necrosis | 1 (2%) | 0 |
| Acute intestinal occlusion | 5 (10%) | 16 (32%) |
| Peritonitis | 9 (18%) | 4 (8%) |
| Postoperative collection | 1 (2%) | 2 (4%) |
| Gastrointestinal bleeding | 2 (4%) | 2 (4%) |
| Diverticular sigmoiditis | 1 (2%) | 0 |
| Appendicitis | 1 (2%) | 6 (12%) |
| Volvulus of the pelvic colon | 0 | 1 (2%) |
| Perforated ulcer | 1 (2%) | 2 (4%) |
| Total intestinal infraction | 9 (18%) | 2 (4%) |
| Complicated hernia | 1 (2%) | 2 (4%) |
DG: Death group, CG: Control group
The mean age and sex were not significantly associated with mortality in the elderly. The existence of medical or surgical history had not significantly influenced mortality (p=0.82). The two groups were comparable accordingly to age, sex, comorbidities and preoperative diagnoses.
We also analysed the postoperative data. For each patient, we calculated the following scores and indexes; ASA score, Charlson index and POSSUM [3-5]. The ASA score is a physical status classification system consisting of six categories. The purpose of this classification is to predict operative risk. Charlson index gives each age group and each comorbidity a different weight. This index is used to quantify comorbidities in elderly patients. The POSSUM scoring system has two components: the Physiological Score (PS) and the Operative Score (OS). PS is based on 12 physiological parameters to preoperatively evaluate the condition of the patients, while OS is based on six parameters evaluating the severity of the surgery. The PS and OS are combined with a logistic regression analysis to turn into predicted mortality and morbidity. To compare the two groups, a threshold of 25 for PS and a threshold of 14 for OS were initially set for the present study, according to available literature data [6].
Statistical Analysis
The data were analysed using SPSS version 19.0 software. We performed a univariate study using Pearson’s and Fisher’s Chi-square accurate test and calculating the Odds Ratio (OR) completed by a multivariate logistic regression analysis to identify the factors independently associated with immediate postoperative mortality. The significance level was set at 0.05. The prognostic value of PS and OS was investigated by establishing Receiver Operating Characteristics (ROC) curves in order to compare the PS and OS thresholds.
RESULTS
Description of the Study Population
Preoperative data: Data from the ASA score, Charlson and POSSUM indexes are summarised in [Table/Fig-2].
Distribution of patients according to the ASA score, charlson index and POSSUM.
| Groups | DG | CG |
|---|
| ASA |
| I | 13 (26 %) | 14 (28%) |
| II | 22 (44%) | 32 (64%) |
| III | 15 (30%) | 4 (8%) |
| Index of charlson |
| ≤4 | 9 (18%) | 27 (54%) |
| 5-6 | 21 (42%) | 21 (42%) |
| 7-8 | 16 (32%) | 2 (4%) |
| >8 | 4 (8%) | 0 (0%) |
| POSSUM |
| PS (Mean±SD) | 30.7±7.22 | 21.1±5.70 |
| OS (Mean±SD) | 17.9±4.36 | 13.6±3.17 |
| POSSUM predicted morbidity rate in percentage (%) |
| (Mean±SD) | 86.3±13.28 | 50.4±21.88 |
| POSSUM predicted morbidity rate in percentage (%) |
| (Mean±SD) | 45.8±22.93 | 14.1±14.58 |
| POSSUM predicted morbidity rate in percentage (%) |
| (Mean±SD) | 29.8±23.82 | 6.3±11.68 |
DG: Death group; CG: Control group; ASA: American society of anaesthesiology; POSSUM: Physiologic and operative severity score for the enumeration of mortality and morbidity; PS: Physiologic score; OS: Operative score; SD: Standard deviation
In the DG, 35 (70%) patients versus 24 patients belonging to the CG (48%) had consulted after 48 hours from the symptom onset. Surgical management was achieved after 24 hours from admission for 22 (44%) patients versus 9 (18%) patients respectively for the DG and CG.
Operative and Postoperative Data
A total of 49 (98%) patients of DG were operated by laparotomy and 1 (2%) was operated by laparoscopy. For CG, 36 (72%) patients were operated by laparotomy and 14 (28%) patients had a laparoscopic approach. Purulent effusion was more frequently found in the DG: 17 (34%) patients versus 8 (16%) patients in the CG. Intraoperative data and type of surgery are summarised in [Table/Fig-3]. The postoperative course was uneventful concerning 45 (90%) patients in the CG. For five patients of this group, post operative complications were represented by parietal infection in three patients and intra abdominal collection in two patients.
| Dead | Survivors |
|---|
| Exploration Data |
| Purulent effusion | 17 (34%) | 8 (16%) |
| Choledocholithiasis | 4 (8%) | 2 (4) |
| Cholecystitis | 8 (16%) | 8 (16%) |
| Appendicitis | 3 (6%) | 8 (16%) |
| Acute intestinal occlusion | 6 (12%) | 13 (26%) |
| Sigmoid volvulus | 0 | 3 (6%) |
| Digestive ischaemia | 8 (16%) | 2 (4%) |
| Digestive perforation | 8 (16%) | 4 (8%) |
| Intra-abdominal abscess | 8 (16%) | 4 (8%) |
| Gastric tumors | 1 (2%) | 0 |
| Colorectal tumors | 5 (10%) | 6 (12%) |
| Digestive metastasis | 7 (14%) | 1 (2%) |
| Pancreatic necrosis | 4 (8%) | 0 |
| Complicated ulcers | 3 (6%) | 6 (12%) |
| Type of surgery |
| Peritoneal wash | 31 (62%) | 36 (72%) |
| Cholecystectomy | 9 (18%) | 8 (16%) |
| Choledochotomy and extraction of the stone | 5 (10%) | 1 (2%) |
| Appendicectomy | 3 (6%) | 8 (16%) |
| Intestinal resection | 16 (32%) | 13 (26%) |
| Suture of ulcer | 3 (6%) | 6 (12%) |
| Abscess incision | 7 (14%) | 5 (10%) |
| Cure of hernia or incisional hernia | 1 (2%) | 4 (8%) |
In the DG, postoperative complications occurred in all patients. Re-operation was required for 19 (38%) patients in the DG. The ICU admission after surgery was necessary for 23 (46%) patients, in DG. One patient for CG, stayed in ICU after surgery. Intubation was indicated in 12 (29.3%) patients in the DG versus a single patient in the CG.
Predictive Factors for Postoperative Mortality
Preoperative data: Considering the consultation delay, there was a significant difference in terms of mortality among patients, who had consulted early and those who had consulted after 48 hours of the symptoms onset. The more than 24 hour-surgical management delay compared to hospitalisation was a predictor of post operative mortality. The clinical signs that constituted mortality factors were poor in general condition, existence of signs of dehydration, haemodynamic instability and dyspnea. A haemoglobin level <12 gm/dL and a creatinine levels >90 μmol/L were associated with a significant mortality.
Scores and Indexes
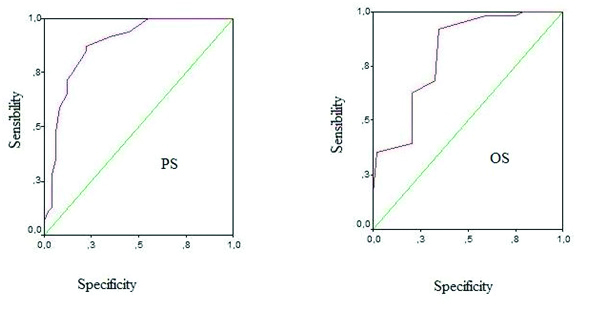
The ASA score 3 and the Charlson index >7 were significantly predictive of mortality. The PS, OS and the predicted morbidity and mortality rates were significantly higher in patients, who died and represented predictive factors of mortality. The area under the ROC curve was significantly >0.500. The point of ROC curve reflecting the best couple sensitivity/specificity was at threshold 23 for the PS. For OS, this point was at threshold 15 [Table/Fig-4]. Mortality was therefore significantly higher above these thresholds (23 for PS and 15 for OS).
ROC curve: a) Physiological score: the inflection point is located at 23; b) Operative score: the inflection point is located at 15.
Operative and Postoperative Data
Laparotomy, as surgical approach, was a significant predictive factor of mortality. Regarding the per operative finding data, purulent abdominal effusion, gastrointestinal ischaemia and gastrointestinal metastases were significantly related to mortality. In contrast, the surgical procedure performed was not predictive of mortality. Complications occurring after surgery and ICU admission were significant predictive factors of mortality. The use of intubation also influenced mortality.
We report the results of univariate analysis of postoperative mortality predictor’s factors in [Table/Fig-5]. Factors independently related to postoperative mortality, found in multivariate analysis, were represented by the delay of the surgical management ≥24 hours following admission, the surgical approach by laparotomy and ICU admission [Table/Fig-6].
Predictive factors of postoperative mortality in univariate analysis.
| p-value | Odds ratio | CI 95% |
|---|
| Minimum | Maximum |
|---|
| Preoperative factors |
| ASA score 3 | 0.005 | 4.92 | 1.51 | 6.15 |
| Charlson index >7 | <0.001 | 16.55 | 3.6 | 76.04 |
| Delay of consultation | 0.025 | 2.5 | 1.11 | 5.74 |
| Poor general condition | <0.001 | 216 | 39.8 | 1170 |
| Signs of dehydration | <0.001 | 7.37 | 1.99 | 27.31 |
| Haemodynamic instability | <0.001 | 2.87 | 60 | 200 |
| Dyspnea | <0.001 | 17.14 | 3.72 | 78.8 |
| Anaemia (Hb <12 g/dL) | 0.02 | 2.87 | 3.3 | 16 |
| Creatinine >90 μmol/L | 0.01 | 136.82 | 63 | 780 |
| Delay of surgery | 0.005 | 0.052 | 0.007 | 0.417 |
| Operative and postoperative factors |
| Surgical approach | <0.001 | 19.05 | 2.39 | 151.59 |
| Purulent effusion | 0.03 | 2.70 | 1.04 | 7.03 |
| Digestive ischaemia | 0.04 | 4.57 | 0.91 | 22.73 |
| Digestive metastasis | 0.04 | 7.97 | 0.94 | 67.45 |
| POSSUM score | <0.001 | 22.93 | 10 | 95 |
| Complicated postoperative | <0.001 | 35.77 | 9.60 | 133.29 |
| ICU admission | <0.001 | 40.03 | 5.11 | 313.28 |
| Intubation | <0.001 | 2.4 | 19.44 | 157.52 |
CI: Confidence interval, ASA: American society of anaesthesiology, POSSUM: Physiologic and operative severity score for the enumeration of mortality and morbidity, Hb: Haemoglobin; Fisher’s exact test χ2, Pearson’s test, student t-
Postoperative mortality predictors in multivariate analysis.
| p-value | Odds ratio | CI95% |
|---|
| Minimum | Maximum |
|---|
| ASA Score | 0.055 | 4.494 | 0.971 | 20.792 |
| Delay of consultation | 0.105 | 2.800 | 0.807 | 9.720 |
| Delay of surgery | 0.006 | 10.237 | 1.921 | 54.552 |
| Surgical approach | 0.011 | 26.756 | 2.092 | 342.16 |
| ICU admission | 0.001 | 38.480 | 4.393 | 337.07 |
ASA: American society of anaesthesiology, test: multivariate logistic regression analysis
Discussion
In an emergency context, the independant predictors of mortality, in patients of age group 70 and older, were delay in surgical management, laparotomy approach and ICU admission.
Necessity of prolonged resuscitation measures in some situations may explain the delayed surgery. In some cases, the difficulty of the diagnostic step was also an issue. A noncomparative study found that delay of surgery and ASA score were the two independent mortality risks in the elderly patients [1]. The delay of consultation has been demonstrated as a predictor of mortality by some studies [7]. The isolation of the elderly patients, lacking autonomy, is a real problem in public health [8]. Awareness campaigns for these people, encouraging them to consult quickly and a better access to care could reduce mortality in this segment of population. The diagnostic step must detect asthenic forms and an indication of additional imaging should be widespread, especially abdominal scan.
Laparotomy approach for emergency surgery or for cholecystectomy procedure in the super-elderly is a mortality factor [9,10]. In the present study, this approach was found as an independent factor of mortality. The two groups were comparable regarding their initial pathologies and comorbidities. At the end of the stepwise descending regression, we suppose that the risk of bias due to initial gravity or other confounding factors was low. The ICU admission is predictor of an expected mortality [7]. The type of surgery and postoperative complications has been reported by some authors as risks factors for mortality in the elderly [1].
Mortality could be reliably measured by the scores and indexes adapted for the present age group. A patient of age group 70 and over, with an ASA score III or IV, a Charlson index ≥7 or PS-POSSUM >25 and OS >14, presents a significatively higher risk of mortality. ASA score has largely shown interest in the prognostic assessment in the elderly. It appears as an independent factor in most studies [11]. Comorbidities were not related to mortality in the present study. However, the Charlson’s index integrating these comorbidities were significantly predictive of mortality. In most studies of mortality on elderly having undergone emergency surgery, POSSUM appears as a predictor of mortality [12,13]. The APACHE score seems to be an interesting predictive score of mortality in the elderly [14].
Prospective randomised trials studying these predictors or actions on any of them (awareness campaigns, extreme emergency after consideration of age, systematic laparoscopic, etc.) or by pathology could provide more answers.
Limitation
Despite being retrospective and mono centric, the present study, analysed most mortality factors of elderly patients operated in an emergency context. The limitation of the present study, was the mortality definition of 30 postoperative days. We had to give a limit to the mortality associated to surgery or occurring immediately postoperatively.
Conclusion
In the elderly, the delay of surgery ≥24 hours, the laparotomy procedure ICU stay are independent predictors of mortality. The scores and the indexes are objective and reliable evidences. This visibility of the evolution of patients having undergone emergency surgery would adapt the management, target a subpopulation more exposed and provide the patients with the most enlightened information possible. The action on some of these factors is the cause of improvement in survival in the emergency context for the present age group.