Hypertension (HTN) is one of the major lifestyle disorders today, with a prevalence of >30% in India [1]. Patients with long standing HTN develop severe complications and one such complication of greater concern is hypertensive nephropathy. Data suggests that at least 1/3 of the Indian population suffering from systemic secondary HTN develop nephropathy, which eventually progresses into End Stage Renal Disease (ESRD) if not diagnosed and treated at the right time [2]. Early diagnosis of renal damage is very important for controlling hypertensive nephropathy and for diminishing the morbidity/mortality related with it. An early sign of renal damage is proteinuria. Since, determining proteinuria gives diagnostic and prognostic advantage in monitoring nephropathy, it is advisable to use it as a screening tool to identify patients who are at risk of developing renal pathology [3,4]. Although, 24 hour urinary excretion of protein is the gold standard for estimating proteinuria, yet it is a time consuming and cumbersome process resulting in inferior patient compliance and higher likelihood of mistakes [5,6].
Few researchers have proposed that estimating protein: creatinine ratio in a random urine sample can serve as an alternative tool for determining proteinuria [7,8]. A reasonably uniform urinary excretion of creatinine in an individual with steady Glomerular Filtration Rate (GFR) forms the basis of this strategy [7,9]. It has been further recommended for estimating proteinuria in patients with diabetic nephropathy, lupus nephritis, renal transplants with urinary PCI showing positive correlation with both the severity as well as the duration of HTN [10-13]. Thus, the present study was designed with an aim to analyse the diagnostic parameters of urinary PCI as a placement of 24-hour urinary protein estimation.
Materials and Methods
Study Design and Population
The present cross-sectional analytical study was designed to examine the practicality of urinary PCI for predicting nephropathy in hypertensives. Over a period of one year (June 2016 to June 2017), 300 clinically documented HTN (for >5 years) patients (165 males and 135 females) in the age group of 25-50 years (average age, 41.6 years) from the Outpatient Department (OPD) and Inpatient Department (IPD) of Jawaharlal Nehru Medical College Hospital (JNMCH), Aligarh, Uttar Pradesh, India, were included in this study. Random morning urine sample was collected from all the patients for estimating PCI. The 24 hour urine was also collected from every patient in order to measure their 24 hour urinary protein excretion. Based on the daily urinary protein excretion the 300 hypertensive patients were divided into three groups: i) hypertensive without proteinuria (n=100); ii) hypertensive with proteinuria (>150 mg/day) but without nephropathy (n=100); and iii) hypertensive nephropathy (n=100). A total of 100 age and sex matched healthy normotensives served as control (57 males and 43 females; average age, 38.3 years).
The HTN was diagnosed based on Eighth Joint National Committee (JNC-VIII) classification [14]. Following were the criteria for confirming the diagnosis of hypertensive nephropathy: i) primary HTN; ii) sustained HTN for >5 years; iii) mild to moderate, but persistent, proteinuria; iv) arteriosclerotic alterations in retina; v) other primary renal diseases were ruled out; and vi) various secondary diseases of the kidney were excluded as well [15]. Subjects with age more than 50 years, pregnancy, obesity, metabolic syndrome, diabetes mellitus, preexisting renal diseases and history of myocardial infarction were excluded, to reduce the errors caused by confounding factors [8]. All the patients were receiving Angiotensin Converting Enzyme (ACE) inhibitors and/or Angiotensin Receptor Blockers (ARBs).
Sample Size
The formula for comparing the difference of means between the groups (four groups i.e., Control, HTN, HTN w/proteinuria, HTN w/nephropathy) was used with alpha=0.05, power (β)=80% and effective size (es)=0.35 which gives sample size n=89. (approximated 89 to 100 for each group; total 400) [16]. Prior permission for the conduction of this study was taken from the Institution’s Ethics Review Board. In addition, verbal informed consent was taken from all the subjects prior to sample collection.
Estimation of Urinary Protein, Urinary Creatinine and Protein Creatinine Index
Quantitative estimation of urinary protein was done by sulfosalicylic acid method [17]. The 3 mL of urine sample was acidified with an equal volume of 3% sulfosalicylic acid. The acidification caused the protein in the sample to precipitate which resulted in turbidity. The degree of turbidity was proportional to the concentration of protein, and was measured with a spectrophotometer at 500 nm. Urinary creatinine level was determined using modified Jaffe’s reaction [18]. 1 mL of 1% picric acid and 0.5 mL of 0.75 N NaOH was added to 3 mL of diluted urine sample. Creatinine in the urine sample reacted with picric acid under alkaline condition and developed yellowish orange colour within 15 minutes. Intensity of the colour was proportional to creatinine concentration and was measured at 520 nm in a photometer. Urinary PCI of every participant was estimated as described by Shaw AB et al., using the equation underneath [19].
PCI=[Urinary protein (mg/L)/Urinary creatinine (mM/L)]×10The 24 hour urinary protein was evaluated after admitting the patients. A prior urinary microscopic examination was done to rule out infections of the urinary tract which would have otherwise impeded the urinary protein estimation. The 24 hour urine samples were collected from every patient. Protein was measured using sulfosalicylic acid method and 24 hour urinary protein was measured (in mg) using the following equation [20]:
[Urine protein concentration (mg/dL)×24 hour urine volume (mL)]/100Statistical Analysis
The data was analysed using the Statistical Package for the Social Sciences (SPSS) for Windows version 20.0. The PCI of hypertensives was compared with controls using post-hoc Dunnett’s test. Sensitivity and specificity of PCI, for diagnosing hypertensive nephropathy, at different cut offs was estimated using ROC curve. Correlation between PCI and 24 hour proteinuria was established using linear regression analysis. Positive and negative predictive values of PCI, for predicting hypertensive nephropathy, were also calculated.
Results
In the present 400 subjects urinary protein, urinary volume, proteinuria, creatinine and PCI were compared between control, hypertensives, hypertensives with proteinuria and hypertensives with nephropathy using one-way ANOVA [Table/Fig-1]. The mean values of urinary protein show significant increase in hypertensive patients with proteinuria as well as nephropathy whereas the urinary volume declines significantly across all three groups in comparison with controls. A statistically significant increase in proteinuria as well as PCI was also appreciated amongst hypertensives, hypertensives with proteinuria and hypertensives with nephropathy but a creatinine lowering trend was observed on a similar comparison scale.
Comparison of urinary protein, urinary volume, proteinuria, creatinine and PCI between control, hypertension, hypertension with proteinuria and hypertension with nephropathy.
| Parameter | Control (n=100) Mean±SEM | Hypertension(n=100) Mean±SEM | Hypertension w/proteinuria(n=100) Mean±SEM | Hypertension w/nephropathy(n=100) Mean±SEM |
|---|
| Urinary protein (mg/dL) | 7.11±0.26 | 10.46±0.42##, ff | 56.54±2.3**, ##, ff | 229.33±11.04**,##, ff |
| Urinary volume (mL) | 1358±30.42 | 1147±37.14**, ## | 1056±30.22**, ff | 912.25±22.62**,##, ff |
| Proteinuria (mg/day) | 90.35±2.32 | 109.56±2.79##, ff | 592.76±25.62**, ##, ff | 1962.02±80.51**,##, ff |
| Urinary creatinine (mM/dL) | 0.89±0.02 | 0.77±0.02**, ff | 0.71±0.02**ff | 0.60±0.02**##ff |
| PCI | 83.44±3.11 | 148.90±8.19##, ff | 1132.06±95.15**, ##, ff | 4654.60±309.01**, ##, ff |
Data was presented as mean±standard error of mean. Analysis was done using one-way ANOVA followed by post-hoc Bonferroni test. SEM: Standard error of mean. The * depicts comparison with control, # depicts comparison with hypertension; f depicts comparison with hypertension w/proteinuria. ** p<0.05, ## p<0.05, ff p<0.05
PCI: Protein creatinine index
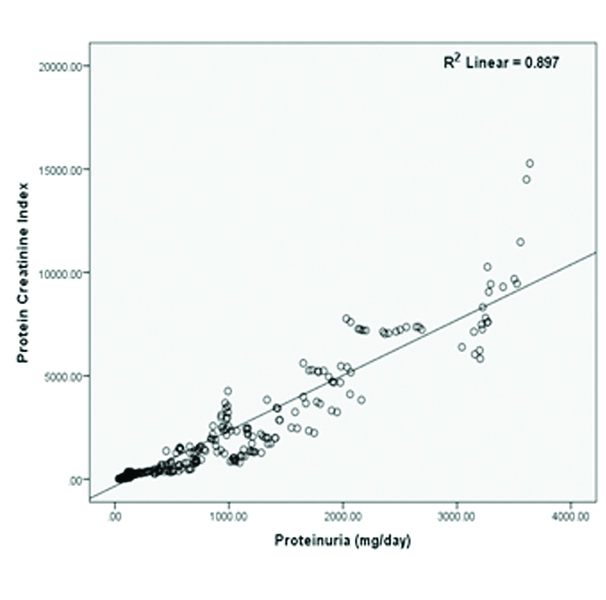
Pearson’s correlation analysis demonstrates positive and statistically significant correlation between proteinuria and PCI [Table/Fig-2]. This relationship between proteinuria and PCI was further analysed using simple linear regression. The slope of best fitted regression line ‘β’ indicates that for each increase in PCI there was an increase in proteinuria by 0.34 and this increase in proteinuria was dependent on PCI by 89.7% (R2=0.897).
Pearson’s correlation curve with best fitted regression line showing positive correlation between PCI and proteinuria (mg/day).
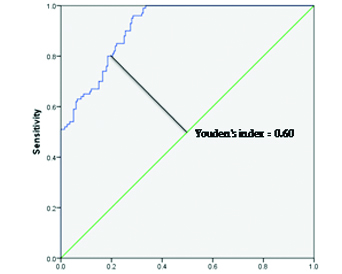
The ROC curve analysis demonstrated that PCI predicts nephropathy, proteinuria and proteinuria >300 mg/day with Area Under the Curve (AUCs) of 0.91, 0.94 and 0.93 respectively [Table/Fig-3]. The close proximity of the ROC to the top left corner and the greater area underneath implicate a near perfect test. It moreover distinguishes between each normal and abnormal subject, thus clearly depicting the extent of overlap between the normal and abnormal values in the test. Furthermore, a Youden’s index of 0.6, depicted as vertical height above the chance line gives an optimum PCI cut off of 1200. This is used in conjunction with ROC to enhance probability keeping all predictions in mind. The aforementioned parameters also exhibited statistically significant ROCs with an average PCI cut off 1200, 240 and 350 respectively.
Receiver operator characteristic curve for urinary PCI to predict nephropathy in hypertensives. Area under the curve=0.915. Youden’s index=0.60 (at PCI cut off 1200).
Diagnostic accuracy was determined using sensitivity, specificity, Positive Predictive Value (PPV), Negative Predictive Value (NPV), positive Likelihood Ratio (LR+), negative Likelihood Ratio (LR-), odd’s ratio and Youden’s index at different PCI cut offs to predict nephropathy in hypertensives [Table/Fig-4]. A value of 1200 appears to be the best suited cut off keeping a balance amongst most of the aforementioned accuracy parameters. These values can be further vindicated from the AUC as depicted in [Table/Fig-3]. Similarly, the most justified and minimally compromising PCI cut offs prognosticating proteinuria and proteinuria >300 mg/day, in hypertensives, seems to be 200 and 300 respectively [Table/Fig-5,6].
Diagnostic test characteristics at different PCI cut offs to predict nephropathy in hypertensives.
| Cut off values | 800 | 1000 | 1200 | 1400 | 1600 |
|---|
| Sensitivity (%) | 95.3 | 87.3 | 81.6 | 73.7 | 58.8 |
| Specificity (%) | 60.8 | 68.4 | 78.5 | 82.3 | 89.4 |
| PPV (%) | 54.49 | 57.64 | 65.15 | 67.22 | 73.21 |
| NPV (%) | 96.33 | 91.62 | 89.65 | 86.40 | 81.50 |
| Accuracy (%) | 72.19 | 74.64 | 79.52 | 79.46 | 79.30 |
| LR+ | 2.43 | 2.76 | 3.80 | 4.16 | 5.55 |
| LR- | 0.08 | 0.19 | 0.23 | 0.32 | 0.46 |
| Odd’s ratio | 31.45 | 14.88 | 16.19 | 13.03 | 12.04 |
| Youden’s index | 0.56 | 0.56 | 0.60 | 0.56 | 0.48 |
PPV: Positive predictive value; NPV: Negative predictive value; LR+: Positive likelihood ratio; LR-: Negative likelihood ratio
Diagnostic test characteristics at different PCI cut offs to predict proteinuria in hypertensives.
| Cut off values | 200 | 220 | 240 | 260 | 280 |
|---|
| Sensitivity (%) | 98.1 | 89.3 | 78.7 | 70.8 | 62.6 |
| Specificity (%) | 70.5 | 77.8 | 81.7 | 85.4 | 92.9 |
| PPV (%) | 87.10 | 89.09 | 89.72 | 90.78 | 94.71 |
| NPV (%) | 94.81 | 78.17 | 65.39 | 59.02 | 55.02 |
| Accuracy (%) | 88.99 | 85.51 | 79.69 | 75.62 | 72.60 |
| LR+ | 3.33 | 4.02 | 4.30 | 4.85 | 8.82 |
| LR- | 0.03 | 0.14 | 0.26 | 0.34 | 0.40 |
| Odd’s ratio | 123.39 | 29.25 | 16.50 | 14.18 | 21.90 |
| Youden’s index | 0.69 | 0.67 | 0.60 | 0.56 | 0.56 |
PPV: Positive predictive value; NPV: Negative predictive value; LR+: Positive likelihood ratio; LR-: Negative likelihood ratio
Diagnostic test characteristics at different PCI cut offs to predict proteinuria >300 mg/day in hypertensives.
| Cut off values | 300 | 325 | 350 | 375 | 400 |
|---|
| Sensitivity (%) | 96.4 | 88.2 | 80.7 | 71.4 | 61.5 |
| Specificity (%) | 63.3 | 69.5 | 76.3 | 82.9 | 91.4 |
| PPV (%) | 80.42 | 81.89 | 84.19 | 86.72 | 91.79 |
| NPV (%) | 91.83 | 79.02 | 71.65 | 64.95 | 60.28 |
| Accuracy (%) | 83.49 | 80.91 | 78.98 | 75.89 | 73.16 |
| LR+ | 2.63 | 2.89 | 3.41 | 4.18 | 7.15 |
| LR- | 0.06 | 0.17 | 0.25 | 0.34 | 0.42 |
| Odd’s ratio | 46.19 | 17.03 | 13.46 | 12.10 | 16.98 |
| Youden’s index | 0.60 | 0.58 | 0.57 | 0.54 | 0.53 |
PPV: Positive predictive value; NPV: Negative predictive value; LR+: Positive likelihood ratio; LR-: Negative likelihood ratio
Discussion
Early diagnosis and timely treatment will help in positive management of hypertensive nephropathy, prognosis will be appreciable and the diminished kidney function may improve to various degrees [21]. Since, time immemorial, the advent of protein in urine indicates the possible onset of nephropathy in hypertensives, but what represents a perfect investigation is still disputable. The “gold standard” 24 hour urinary protein excretion is still considered best for quantifying proteinuria but due to its time consuming and inconvenient nature has poor patient compliance [6]. The urine dipstick test is economical and easy test but is not recommended because of its poor sensitivity, accuracy and high false positive rate [22]. Recently, two tests have slowly gained adulation: urinary albumin to creatinine ratio and urinary protein to creatinine ratio. Of these two, the former test has shown relatively higher false positivity and lower sensitivity [23]. Therefore, we considered the later test (urinary PCI) in present study.
Recent studies suggest that urinary PCI has strong association and correlation with the duration and severity of HTN and therefore has the potential of screening nephropathy in hypertensives [8]. Just like proteinuria, present study shows that, urinary PCI is also significantly elevated in hypertensive nephropathy patients as compared to hypertensive controls [Table/Fig-1]. In the present study, a very strong positive linear correlation has been noticed between urinary PCI and the degree of proteinuria in hypertensives [Table/Fig-2]. Similar observations have been recorded earlier, but in hypertensive disorders of pregnancy [10,24,25]. Lower and higher urinary PCI will prognosticate lesser and severe degree of proteinuria in hypertensives, respectively.
Usefulness of urinary protein creatinine ratio in predicting proteinuria, in pregnancy, and establishing the diagnosis of preeclampsia has been confirmed by previous studies [26]. In the present study, we have tried to establish the practicality of urinary PCI, not only to predict proteinuria but also to predict nephropathy, in hypertensive patients, thereby helping the physicians to construct an early diagnosis of hypertensive nephropathy and subsequently to initiate apt management. Based on present findings, urinary PCI of 1200, 300 and 200 can identify nephropathy, proteinuria >300 mg and proteinuria >150 mg, in hypertensives, with acceptable sensitivity and specificity, and also show quite high accuracy (79.52%, 83.49% and 88.99%) and good Youden’s index (0.60, 0.60 and 0.69) as compared to the 24-hour urinary protein excretion [Table/Fig-4,5 and 6]. These factors make urinary PCI a reasonable possible replacement for the time-consuming “gold standard” method.
Moreover, ability of urinary PCI (cut off 800) to predict nephropathy in hypertensives with sufficiently high sensitivity (95.3%), very high NPV (96.33%), fairly good LR+ (2.43) and excellent LR- (0.08) qualifies it as a great screening tool. It can definitely be used as a screening test in patients suffering from HTN for >5 years, circumventing the inconvenient “gold standard” test. Similarly, PCI of 300 and 200 are fairly good for screening proteinuria >300 mg (sensitivity 96.4%, NPV 91.83%, LR+ 2.63 and LR- 0.06) and proteinuria >150 mg (sensitivity 98.1%, NPV 94.81%, LR+ 3.33 and LR- 0.03), respectively.
It has also been suggested by few researchers that some unfathomable genetic and environmental determinants result in ethnic/racial variations in proteinuria and kidney disease which creates the need that individual clinical laboratories establish their local standards and cut offs [27-29]. HTN is among the leading lifestyle disorders burdening the Indian population and our comparatively small sample size also seems to be a major limitation.
Conclusion
Urinary PCI is an accurate, inexpensive, convenient and valuable investigation performed to predict nephropathy and proteinuria in hypertensives and can be used as an alternative for 24 hour urinary protein estimation. It can serves as a screening tool in hypertensives and 24 hour urinary protein estimation should perhaps be used to confirm proteinuria and nephropathy in those who have urinary PCI higher than the cut off. However, the conclusions formulated on this study alone cannot be generalised to the entire Indian population because HTN is a major lifestyle disorder affecting a significant number of Indians. Therefore, a wider scaled research is needed in this direction.
Data was presented as mean±standard error of mean. Analysis was done using one-way ANOVA followed by post-hoc Bonferroni test. SEM: Standard error of mean. The * depicts comparison with control, # depicts comparison with hypertension; f depicts comparison with hypertension w/proteinuria. ** p<0.05, ## p<0.05, ff p<0.05
PCI: Protein creatinine index
PPV: Positive predictive value; NPV: Negative predictive value; LR+: Positive likelihood ratio; LR-: Negative likelihood ratio
PPV: Positive predictive value; NPV: Negative predictive value; LR+: Positive likelihood ratio; LR-: Negative likelihood ratio
PPV: Positive predictive value; NPV: Negative predictive value; LR+: Positive likelihood ratio; LR-: Negative likelihood ratio