The ultimate goal of comprehensive orthodontic treatment is to obtain an optimum final occlusion as per the “Andrew’s six keys to normal occlusion” resulting in an ideal intercuspation, normal overjet and overbite. These goals cannot be achieved if there is a mismatch between upper and lower tooth material, commonly referred to as Tooth Size Discrepancies (TSD). “Tooth size” now being referred to as the “seventh key” to normal occlusion has its importance in obtaining a good occlusion during the final stages of orthodontic treatment [1].
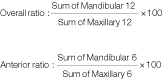
Considering the importance of assessing tooth size in obtaining excellence in finishing, different methods have been described to evaluate inter arch tooth size discrepancies but the classical work done by Bolton is the most acceptable and most widely used. He established two ratios for estimating the TSD by measuring the summed mesiodistal widths of the mandibular to maxillary teeth-the ‘overall ratio’ of 91.3% which involves all permanent teeth except the second and third molars and the ‘anterior ratio’ of 77.2%, which includes only six anterior teeth [2,3]. He also concluded that a ratio greater than 1 Standard Deviation (SD) from these mean values indicated a need for diagnostic consideration. On the other hand, some authors consider ratios greater than 2 SD have a significant discrepancy [4]. Profit quantified that tooth size discrepancies greater than 1.5 mm results in treatment problems [5].
Differences in tooth sizes have been found between population groups and as these differences are not same in different groups of teeth, differences in interarch relationships have also been found and well established. Various studies have been done to examine differences in overall and anterior tooth size ratios of different ethnic groups to that of Caucasian standards set by Bolton [6-11]. Though few studies have been done in this regard for Indian ethnic groups and the results have been confusing [12-16]. Also, no study so far has been conducted in this regard for Haryana population and none has commented on the clinical significance. Hence, the present study was done to establish Bolton’s anterior and overall ratio for Haryana population strictly following the criteria used by Bolton and compare them with original Bolton’s norms. Also, the clinical significance of the differences obtained was found, to assess the need for specific norms for the Haryana population.
Materials and Methods
The present study was a descriptive study and carried out at the Department of Orthodontics, PGIDS, Rohtak, India, to establish Bolton’s norms for the Haryana population. Ethical clearance was obtained from Institutional Ethical Committee, PGIDS, Rohtak (PGIDS/IES/2017/72; dated 8/11/16). The present study was carried out for about 10 months (November 2016 to August 2017). The study sample consisted of good quality maxillary and mandibular study casts of subjects from Haryana population (with their parents and grandparents belonging to the same population) in the age range of 18-25 years and was selected after careful screening of about 1000 students studying in various schools and colleges in and around Rohtak.
Sample size was determined by a pilot study conducted in present department on a sample of 25 study casts fulfilling the above inclusion and exclusion criteria. At 95% confidence level sample size was estimated to be 96 and rounded of to 100.
Inclusion Criteria
The final sample fulfilled the following criteria; fully erupted permanent dentition from left first molar to right first molar with Angle’s Class I molar relationship, good intercuspation, normal overjet, overbite and crowding and spacing <3 mm.
Orthodontically treated subjects (non-extraction and no interproximal stripping) fulfilling the above criteria were also included.
Exclusion Criteria
Abnormal tooth morphologyand deformed teeth.
Cases with retained primary teeth, tooth agenesis, gross restorations, missing/extracted teeth and with prosthetically replaced teeth were exlcuded from the present study.
Fabrication of Study Models
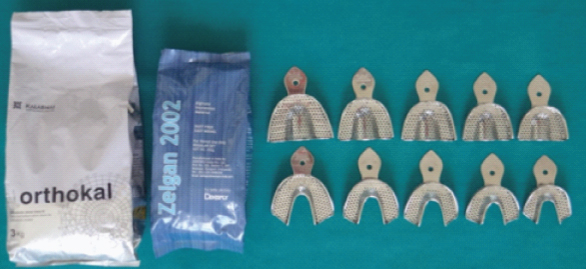
Written consents were obtained from all students selected for impression making. Upper and lower impressions were made with alginate impression material (Zelgan 2002) using standard protocols and according to manufacturer’s recommendations. The impressions were immediately poured in orthokal (Orthodontic stone, Class III) allowed to set for 60 minutes after which it was gently separated from the impression [Table/Fig-1]. The obtained models were then trimmed followed by fabrication of the bases with plaster of paris (Kaldent dental plaster Class II) with teeth in occlusion. The study models obtained were finished, polished and numbered for identification.
Impression making materials.
Measurements
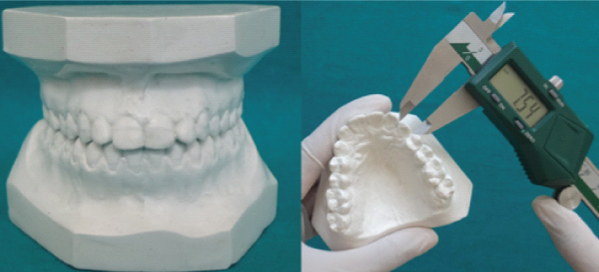
The measurements were made on the study models. The mesiodistal crown diameter of a tooth was obtained by measuring the greatest distance between the contact points on its proximal surfaces, using a sliding caliper with digital vernier scale (precision reading to the nearest of 0.01 mm) held parallel both to the occlusal and vestibular surfaces (Jensen E et al.,) [17]. Teeth were measured from right 1st molar to left 1st molar in both maxillary and mandibular arches [Table/Fig-2,3]. Overall ratio and anterior ratio were calculated using Bolton’s formula [2].
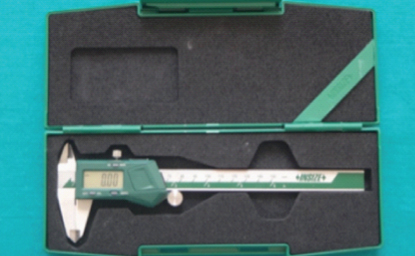
Individual tooth size measurements.
Assessment of Reproducibility
The intraexaminer calibration consisted of the primary investigator, measuring 25 pairs of models (collected for pilot study) two times separated by a week interval. These models were later included in the main study as the methodology used in pilot study was exactly same as that of main study. The interexaminer calibration was done against another orthodontist, who also measured all the 25 pairs of models. Intraclass correlation coefficient (maxilla 0.91, mandible 1.0) indicated almost perfect agreement between the two readings by primary investigator. Kappa coefficient for interexaminer calibration (maxilla 0.99, mandible 0.98) indicated very good agreement between the measurements by two examiners.
During the main study only 8-10 pairs of models were measured each day to prevent visual fatigue and in each model, each tooth was measured twice, when difference was less than 0.2 mm in two measurements, first measurement was recorded and when greater than 0.2 mm then the tooth was measured again.
Statistical Analysis
All data was analysed using the Statistical Package for Social Sciences (SPSS) for Windows, Version 20.0 (SPSS Inc, Chicago, USA). Normality of the sample was checked using Kolmogorov- Smirnov test (p-value 0.20) and sample was found to be normally distributed, so parametric tests were used to check the statistical significance of the results. The t-test for independent groups (unpaired t-test) was used to determine statistical differences between sexes. Single sum t-test was used to determine statistical differences between Haryana population and the original Bolton’s values.
Results
The data was collected from 100 study casts (50 male subjects and 50 female subjects with age ranging from 18 to 25 years). Mesiodistal tooth dimensions of all the 100 study casts were measured and using Bolton’s formula, anterior and overall ratio was obtained for each of them. Anterior ratio’s and overall ratio’s mean, standard deviation and standard error for Group I (male) and Group II (female) represented in [Table/Fig-4]. To evaluate sexual dimorphism within population for Bolton’s ratio male and female values were compared, but no statistically significant differences were found [Table/Fig-5].
Mean, standard deviation and standard error for anterior ratio and overall ratio.
| Group | Anterior Ratio | Overall Ratio |
|---|
| Mean(%) | SD | SE | Mean(%) | SD | SE |
|---|
| Males (I) | 78.22 | 2.68 | 0.37 | 91.86 | 1.52 | 0.27 |
| Females (II) | 77.38 | 1.98 | 0.27 | 91.05 | 1.53 | 0.21 |
SD Standard deviation, SE Standard error
Comparison of anterior ratio and overall ratio between Group I (males) and Group II (females).
| Teeth | Males | Females | t-value | p-value | Sig |
|---|
| Anterior Ratio (%) | 78.22 | 77.38 | -0.89 | 0.37 | ns |
| Overall Ratio (%) | 91.86 | 91.05 | -1.12 | 0.25 | ns |
ns=non-significant (p>0.05)
Mean anterior and overall ratio for Haryana population was found to be 77.89+0.23 and 91.45+1.77 respectively [Table/Fig-6]. Comparison of anterior and overall ratio of Haryana population subjects with original values determined by Bolton’s represented in [Table/Fig-7] [2,3]. There was no significant difference between the overall ratio of Haryana population and original Bolton’s values but there was a highly significant (p-value 0.004) difference between anterior ratio of Haryana population and original Bolton’s values (p<0.01).
Anterior and overall ratio mean, standard deviation and standard error for Haryana population (combined males and females).
| Anterior Ratio | Overall Ratio |
|---|
| Mean (%) | SD | SE | Mean (%) | SD | SE |
|---|
| 77.89 | 0.23 | 02.33 | 91.45 | 1.77 | 0.17 |
SD Standard deviation, SE Standard error
Comparison of anterior and overall ratio of Haryana population with Boltons mean.
| Teeth | Bolton’s | Haryana | t value | p-value | sig |
|---|
| Mean(%) | SD | Mean(%) | SD |
|---|
| Anterior Ratio | 77.2 | 1.65 | 77.89 | 0.23 | 2.94 | 0.004 | hs |
| Overall Ratio | 91.3 | 1.91 | 91.45 | 1.77 | 0.83 | 0.40 | ns |
ns = non-significant (p>0.05), hs = highly significant (p<0.01)
Discussion
The importance of TSDs in orthodontic diagnosis is well accepted by the orthodontists because a proper relationship between upper and lower dentitions is essential for orthodontic finishing excellence. Though several methods are available, Bolton’s tooth size analysis is the most commonly used method to check tooth size discrepancies [18]. Studies on various ethnic and racial groups have been done to check the applicability of Bolton’s ratio on other populations [6-11]. In the present study anterior and overall Bolton’s ratios were determined for Haryana population. A sample of 100 study casts was carefully selected, so that only harmonious dentitions ideally suited for comparisons with Bolton’s standard, included in the study. Othman SA and Harradine NW, concluded that the use of cases with good occlusion was considered a prerequisite for determining the Bolton’s norm ratios [19]. This strict selection of harmonious casts was reflected in the low standard deviation of values in the present sample, signifying low variability.
Early childhood has been reported to be the period of choice for obtaining accurate tooth size measurements as there are less damage and less attrition in this age. Hence, the age range of the subjects included in the present study was between 18-25 years in order to minimise the influence of factors like attrition on actual tooth size measurements.
The mean Bolton’s anterior ratio in the present study was found out to be 77.89%+0.23 and the overall ratio was found to be 91.45%+1.77. On comparing anterior and overall ratios with Bolton’s original norms, it was found that the ratios for the present study were higher and the difference was statistically significant for anterior ratio. Anterior ratio was higher in the Haryana population compared to Caucasians probably due to the significantly smaller size of maxillary central incisor in Haryana individuals. A lesser difference was probably seen in overall ratio due to mandibular second premolar, which was of approximately same size of the mandibular first premolar and was significantly smaller than the Caucasian values. Statistically significant differences from Bolton’s original values were also found in studies on the Peruvian, Turkish and Spanish population [20,21,8]. Among Indian ethnic groups studies on Assamese population, reported statistically significant differences in the anterior ratio only, studies on Himachali, Hyderabad, Punjab and Maratha population found differences in both anterior and overall ratio [22,16,14,12,23]. Study on Kerela and Jaipur population reported no significant differences [13,15]. Study on North Eastern Indian population established no significant gender differences in anterior and overall ratio and suggested comparison with standard Bolton values [24]. Subbarao VV et al., overall Indian population concluded that original Bolton’s ratio does not represent Indian population [25].
All statistically significant differences stand their importance only when their clinical relevance can be observed. Originally Bolton suggested that a ratio greater than 1 SD from his reported mean values indicate a need for diagnostic consideration [3]. Later Profit quantified it and said that a tooth size discrepancy of less than 1.5 mm is rarely significant, but larger discrepancies create treatment problems and must be included in the orthodontic problem list [5]. Crosby DR and Alexander CG, extended it to 2 SD range [4]. This suggest, even if statistically significant differences are found in the anterior ratio of Haryana population to that of Bolton’s, if ratio and its SD falls within the 1 SD range of Bolton then there should not be any significant difference in evaluation of tooth size discrepancies. We observed that the anterior ratio and its 1 SD found in the present study lies well within the 1 SD ranges of Bolton’s original anterior ratio values. Similarly, the values of the overall ratio as well as its 1 SD lies within the 1 SD range of Bolton’s original overall value. Thus, the differences found in the Bolton’s ratios were unlikely to be clinically significant in making an acceptable occlusion unachievable. Hence, there is no need for separate Boltons norms for the Haryana population. In a review of studies investigating TSD only 2 out of 12 studies revealed clinically significant racial/ethnic differences [19]. The same literature review concludes that racial groups are unlikely to have a clinically significant effect on TSD [19]. Many Indian studies have evaluated statistically significant differences but none of them have assessed the clinical significance of the differences. Hence, it cannot be commented that the applicability of Bolton’s original ratios is limited to Haryana population or can be generalised to the Indian population or at least to the North Indian population. The present study suggest that Bolton’s original values can be safely used for Haryana population group.
Future studies having a larger sample size with a more of comparative or analytical study design, can be conducted to critically evaluate all the studies, to suggest whether there is a need for separate norms for different population groups. A more recent diagnostic technique like orthocad along with three dimensional intraoral scanners can be used for more precise tooth size measurements.
Conclusion
No sexual dimorphism was found in Bolton’s anterior and overall ratio for Haryana population. The differences in the anterior ratio of Haryana population and Bolton’s original norms were statistically significant but the values lie within the one standard deviation and hence the differences are clinically irrelevant. Therefore bolton’s original values can be safely used for Haryana population.
SD Standard deviation, SE Standard error
ns=non-significant (p>0.05)
SD Standard deviation, SE Standard error
ns = non-significant (p>0.05), hs = highly significant (p<0.01)