Iron deficiency is one of the most prevalent forms of malnutrition. Globally 50% of anaemia is attributable to iron deficiency [1]. In India it is a major public health problem as it is estimated that 52% of non pregnant women of reproductive age are anaemic, and it is the second most common cause of maternal deaths [2].
A combination of laboratory tests has been used to identify iron deficiency more accurately and to estimate the size of body iron store [3]. These tests encompass five different assays Hb, serum ferritin, TIBC, erythrocyte protoporphyrin and serum iron. This involves prohibitive costs and inconvenience of approach and thus Hb is used as the most widely used measure of the severity of iron deficiency. However, the sensitivity of Hb measurements is poor because anaemia associated with nutritional iron deficiency is relatively mild, resulting in extensive overlap in Hb values between healthy and iron-deficient persons [4].
World health organisation currently recommends plasma ferritin for iron status assessment of populations [5,6]. However, plasma ferritin is a positive acute-phase protein that is secreted by the liver during inflammation, independent of iron status [7]. Thus, measuring iron status by using ferritin in populations with a high prevalence of inflammation provides an underestimation of the “true” prevalence of iron deficiency.
Unlike ferritin, sTfR is considered not to be affected by the acute-phase response [7]. The sTfR is actually a truncated form of the tissue receptor found in human plasma and exists as a transferrin receptor complex. In a normal adult about 80% of the transferrin receptors are located on the cellular surface of the erythroid marrow. This transferrin receptor is a transmembrane protein which mediates iron delivery to erythroblasts by the interaction of plasma transferrin with cell surface transferrin receptors [8].
The sTfR is regarded as a more stable marker of iron levels in an inflammatory state, and their concentrations generally begin to change after iron stores (in the form of ferritin) are depleted [9,4].
Some time back; a method had been described for assessing iron status based on measurement of total body iron which is calculated from the soluble Transferrin Receptor: Log Serum Ferritin Ratio (R:F Body Iron) [8]. This indicator is thought to reflect iron status over a wider range of iron stores from decreased storage iron to functional latent iron deficiency.
There is a need to analyse the role of sTfR/log ferritin ratio as marker for estimation of body iron stores in young healthy non pregnant females in India in order to assess the crucial iron status even when the symptoms or signs of iron deficiency does not set in clinically. Although, the role of assessing stainable Iron in bone marrow aspirates as a definitive gold standard cannot be under-estimated but there is an important advantage of using sTfR/log ferritin ratio for the same, owing to its ability to be performed on small capillary blood samples [3].
The sTfR and sTfR based indices have been estimated and evaluated in anaemic population and they have been proved to be better than serum ferritin or Hb in assessing the iron deficiency anaemia [10]. So, the evaluation of such parameters in the young non anaemic, non pregnant females becomes very important because the iron status of females in reproductive phase of life has an immense effect on the well-being of foetus.
Therefore we undertook the present study with the aim to determine the role of sTfR/log ferritin (R/F Index or R/F Ratio or R/F body iron estimate) as a determinant of total body iron and to study its usefulness in young non pregnant healthy females aged 18-22 years for the early detection of the deficient iron stores.
Materials and Methods
The present study was designed as a cross-sectional study conducted in the Department of Biochemistry, SGT Medical College, Gurugram, Haryana, India, from November 2015 to October 2016.
Female students volunteering from SGT University conforming to the inclusion and exclusion criteria were taken for the study. A total of 248 such volunteers were subjected to Hb estimation by HemoCue Hb 301 method through samples collected by finger prick. It is a Point of Care (POC) test optimised for anaemia screening in primary care and blood donation camp settings. It measures the absorbance of whole blood at an Hb/HbO2 isobestic point [11]. Those with haemoglobin ≥12 gm persentage and Body Mass Index (BMI) ranging from 23-29; fulfilling both inclusion and exclusion criteria were taken for study. Thus, 200 healthy non pregnant female university students became present study subjects.
Inclusion Criteria
Age group18-22 years
Hb ≥12 mg/dL with normal values of Red Blood Cell (RBC) Indices
Non pregnant
BMI (23-29)
Exclusion Criteria
Women on iron therapy and oral contraceptives;
Women with history suggestive of renal, hepatic, endocrinal or myeloproliferative diseases,
Any acute or chronic infection,
History of blood transfusions in the last three months.
A proforma was used to record relevant information and patient’s data.
Based on the above mentioned inclusion and exclusion criteria; the samples were taken in the present study after obtaining informed consent. The study was approved by the Institute’s Ethical Committee.
Sample Collection and Processing
Under strict aseptic precautions 2 mL of venous blood was collected in Ethylenediaminetetraacetic Acid (EDTA) vacutainers and were subjected immediately for the measurement of Hb.
The TLC, red cell count, haematocrit, MCV, MCHC, platelet count, MCH were done in the same samples subsequently via the SYSMEX KX 21 autoanalyser.
About 5 mL of blood was drawn simultaneously in plain vacutainers which was allowed to clot and then centrifuged within one hour to obtain serum which was immediately stored at -20°C and later used to measure the levels of:
Traditional iron parameters: serum iron, serum ferritin, serum transferrin, TIBC and TSAT.
Soluble Transferrin Receptor1 (sTfR).
Estimation of serum Iron and TIBC was done using semi-autoanalyser (ERBA CHEM 7). Spinreact, S.A , Spain diagnostic kit. Reference value for serum iron was 40-150 μg/dL or 7.16-26.85 μmol/L and for TIBC was 200-400 μg/dL for females.
Serum ferritin and transferrin were estimated by quantitative turbidimetric method using semi-autoanalyser (ERBA CHEM 7). Spinreact, S.A, Spain diagnostic kit. The reference value for serum ferritin was 10-110 μg/L and for serum transferrin was 200-360 mg/dL for females.
The sTfR estimation was done via Enzyme-linked Immunosorbant Assay (ELISA) (Elabscience human sTfR1 (Soluble transferrin receptor1 ELISA kit). The reference value being 0.03125 mg/L-20 mg/L.
Transferrin Saturation (TSAT) and R/F ratio were calculated as follows: Transferrin saturation (TSAT %)=Serum Ironx100/TIBC. R/F Ratio as a determinant for body iron store was calculated as sTfR/log serum ferritin [4].
Statistical Analysis
Data were analysed using Graph Pad Prism 7.0 version. Correlation between sTfR/log ferritin index and other parameters of iron status were determined by using Pearson’s correlation coefficient. Overall comparisons between TSAT%, sTfR and sTfR/log ferritin index in each of the three ferritin groups (severe deficiency, moderate deficiency and normal) were evaluated by one-way ANOVA.
Results
In the present study, a total of 200 healthy non pregnant female university students participated after conforming to the inclusion and exclusion criteria followed by screening test and had the characteristics as per [Table/Fig-1].
Characteristics of all the female participants of present study.
| Anthropometric characteristics | Range | Mean±SD |
|---|
| Age (years) | 18-22 | 18.7±1 |
| Body weight (kg) | 53-72 | 61.2±3.1 |
| Height (cm) | 152-170 | 162±5 |
| BMI (kg/m2) | 23-29 | 26±1 |
The Hb, haematocrit and red cell indices of all the subjects were within the normal reference range indicating no evidence of anaemia. The TLC was also within the normal range ruling out any inflammation [Table/Fig-2].
Haematologic parameters of all the females of present study.
| Haematologic parameters | Normal reference range | Mean±SD |
|---|
| Haemoglobin (gm/dL) | 9-14 | 12.9±0.59 |
| Haematocrit (%) | 30-43 | 39.4±2 |
| RBC count (106/μL) | 3.5-5.2 | 4.4±0.2 |
| MCHC (gm/L) | 30-35 | 32.9±0.83 |
| MCH (pg) | 23-32 | 29.6±0.96 |
| MCV (fL) | 72-96 | 90.2±2.88 |
| TLC (/cumm) | 4000-10,400 | 9000±648 |
From [Table/Fig-3], it is evident that serum iron was within the normal reference range in all the subjects, whereas TIBC, serum transferrin, TSAT and serum ferritin were below the normal reference range in some of the subjects; indicating an iron deficient status.
Iron status of the study group based on traditional parameter.
| Parameter | Normal reference range | Mean±SD |
|---|
| (n=200) |
|---|
| Serum iron (μg/dL) | 40-150 | 73.8±7.99 |
| TIBC (μg/dL) | 200-400 | 376.7±58.41 |
| Serum transferrin (mg/dL) | 200-360 | 262.8±43.06 |
| TSAT (%) | ≥16 | 20.4±5.51 |
| Serum ferritin (μg/L) | 10-110 | 37.68±22.39 |
The sTfR and an index based on it i.e. sTfR/log ferritin were also estimated in all the 200 females of present study. The mean and SD for sTfR came out to be 2±0.38 mg/L (range 0.89-2.86) and the sTfR/log ferritin index came out to be 1.4±0.53 (range 0.45-2.72).
The sTfR/log ferritin index values had a positive correlation with sTfR, serum transferrin and TIBC and a negative correlation with Hb, serum iron, serum ferritin and TSAT persentage; all being highly statistically significant [Table/Fig-4].
Correlation of sTfR/log ferritin index levels with traditional iron parameters.
| Correlation of sTfR/log ferritin | Pearsons correlation coefficient (r) | p-value |
|---|
| sTfR/log ferritin index vs Haemoglobin | -0.9654 | <0.001 |
| sTfR/log ferritin index vs Serum iron | -0.9846 | <0.001 |
| sTfR/log ferritin index vs Serum transferrin | 0.915 | <0.001 |
| sTfR/log ferritin index vs TSAT (%) | -0.9454 | <0.001 |
| sTfR/log ferritin index vs Serum ferritin | -0.9335 | <0.001 |
| sTfR/log ferritin index vs sTfR | 0.8722 | <0.001 |
| sTfR/log ferritin index vs TIBC | 0.901 | <0.001 |
The study group was divided further into two groups as Iron Deficient (ID) that is latent anaemia and Non Iron Deficient (NID) that is normal group on the basis of traditional iron parameter (serum ferritin) and we found that 27 (13.5%) of females out of 200 came out to be ID [Table/Fig-5].
Discrimination between ID and NID based on serum ferritin.
| Parameter | Iron Deficient (ID)/ Non Iron Deficient (NID) | Total (n=200) |
|---|
| n | Percentage |
|---|
| Serum ferritin ≤12 μg/L | ID | 27 | 13.5% |
| Serum ferritin 12–20 μg/L | Equivocal | 29 | 14.5% |
| Serum ferritin >20 μg/L | NID | 144 | 72% |
We evaluated the discriminating power of the traditional iron parameters towards the identification of iron deficient anaemia by choosing the standard cut offs, and found varying results for serum ferritin, TIBC, TSAT persentage or serum transferrin with either a compromised sensitivity or specificity.
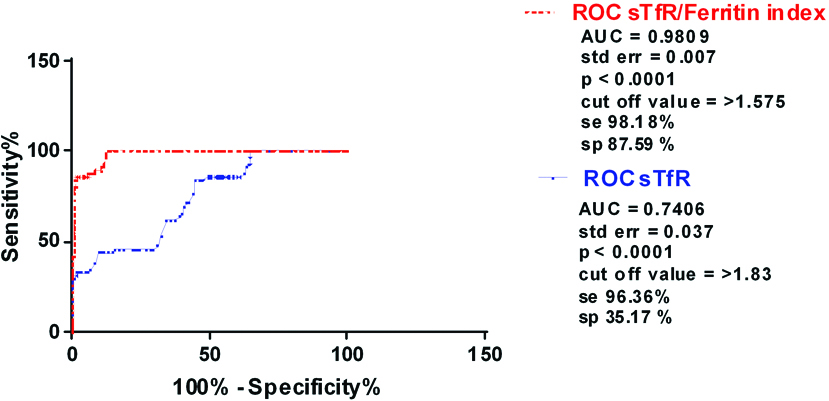
Therefore, we studied the role of sTfR and sTfR based index towards the diagnostic accuracy of iron deficiency in the healthy females of present study group. For sTfR concentration an AUC of 0.7406 was obtained with best combination of diagnostic sensitivity (96.36%) and specificity (35.17%) at a cut off of >1.83 mg/L. The sTfR/log ferritin index showed higher discriminating power in evaluating iron status in young healthy women in the age group 18-22 years (AUC 0.9809) with best combination of diagnostic sensitivity (98.18%) and specificity (87.59%) at a cut off of >1.575 [Table/Fig-6].
Receiver operating characteristic (ROC) analysis of sTfR/log f and sTfR parameters in the evaluation of iron status (n=200).
AUC=Area under curve, Se=Diagnostic sensitivity, sp=Diagnostic specificity
As per the [Table/Fig-7], when classification of sTfR/log ferritin was done based on cut off with sensitivity of (98.18%) and specificity of (87.59%) derived from ROC for STfR/log ferritin index; 108 (54%) out of 200 were included in the ID group and the rest (46%) were NID. So, this index could pick up the threatened iron store better than sTfR or serum ferritin alone owing to its better sensitivity and specificity that too in clinically non anaemic females.
Discrimination between ID and NID population based on sTfR/log ferritin index.
| Parameter | Iron Deficient (ID)/ Non Iron Deficient (NID) | Total (n=200) |
|---|
| n | Percentage (%) |
|---|
| sTfR/log ferritin index > 1.5 | ID | 108 | 54% |
| sTfR /log ferritin index ≤ 1.5 | NID | 92 | 46% |
Discussion
Iron deficiency corresponds to the depletion of a functional iron pool in different tissues to a sufficient degree, so as to impair optimal function. It is generally acknowledged the most common nutritional deficiency worldwide with anaemia being only one part of the clinical spectrum. Subclinical ID is especially common in children aged one to three years, in adolescents of both sexes, in women of child bearing age and in the elderly population. Iron depletion in the body occurs in stages and can be measured by using biomarkers of iron status.
The progression to iron deficiency can be divided into three stages
1) First stage: Negative Iron balance where demand of iron exceed the body’s ability to absorb iron from the diet. Such situations are: blood loss, pregnancy, rapid growth spurts in the adolescent, or inadequate dietary iron intake. During such periods, serum ferritin levels decrease. As long as iron stores are present and can be mobilised; the serum iron, TIBC and red cell protoporphyrin levels remain within normal limits. Red cell morphology and indices are normal at this stage [1].
2) Second stage (Iron deficient erythropoiesis): When iron stores become depleted, and when serum ferritin levels fall to less than 15 μg/L, the serum iron begins to fall. Gradually, the TIBC increases. Once the TSAT falls to 15-20%, Hb synthesis becomes impaired. Evaluation of peripheral blood smear reveals the appearance of microcytic cells.
3) Iron Deficiency Anaemia (IDA): The Hb and haematocrit begin to fall. TSAT is 10-15% in this stage. In severe anaemia (Hb 7-8 g/dL), hypochromia and microcytosis is more prominent; target cells and poikilocytes appear in blood smear.
A reliable marker to identify or to predict the iron deficient state even in the first or the second stage (apparently healthy but high-risk sub-groups of population) is not only imperative but also fundamental towards formulating strategies and interventions to improve their iron status. For this, serum ferritin has been considered as most reliable as its levels directly indicate the dwindling body stores of iron. But owing to its major limitation being also an acute phase protein; the urge to find a parameter without any limitations have always forced researchers to look beyond these conventional markers.
In the present study, first of all we took only the young non-pregnant females who had Hb >12 gm/dL and we went beyond the routine investigations and estimated other conventional Iron parameters like serum ferritin, transferrin, iron, TIBC and TSAT. We evaluated the sensitivity and specificity of serum ferritin over the standard cut offs and found that it could pick up only 13.5% of females as Iron deficient.
We further chose sTfR as it has been found in the studies that elevated levels of sTfR may reflect increased erythropoietic activity and its concentration is stable in inflammatory conditions [8].
By taking sTfR alone into consideration; sTfR ROC curve (AUC 0.746) detected a value of >1.83 to be diagnosed as ID [Table/Fig-6]. This value had good sensitivity (96.36%) with poor specificity (35.17%). Nevertheless it diagnosed 147 (73.5%) out of 200 of the population as iron deficient but owing to its highly unacceptable specificity; it can’t become a sole marker to pick up the true picture of the iron status in the body.
So, we included both sTfR and ferritin in a ratio called as R/F ratio taking sTfR values and logarithm of ferritin values as suggested and evaluated previously by the studies done in anaemic subjects [4]. A critical review of previous studies suggests that there had been lack of consensus over the cut off range for this parameter. Our purpose was to establish a baseline cut off in young non anaemic females of reproductive age which can efficiently determine their iron status when traditional markers are all normal. This cut off came out to be >1.575 from the ROC curve (AUC 0.9809) [Table/Fig-6] for the diagnosis of iron deficiency, with a high sensitivity (98.18%) and specificity (87.59%) and detected 108 (54%) out of 200 of students to be ID [Table/Fig-7].
Limitation
Limitation of this index was its suitability in population with chronic infections and inflammations where an algorithm must be developed for the correction of the serum ferritin levels in such conditions.
Conclusion
Nevertheless from present study we concluded that R/F ratio efficiently evaluated iron stores and had the best combination of sensitivity and specificity as compared to other parameters of iron status and was a good determinant of functional as well as storage iron. The baseline value for R/F index which has been set in present study as >1.575 can be used further in large population based studies and can become a useful screening test in distinguishing iron deficient states accurately in apparently healthy but high risk sub-populations, so that the timely intervention strategies can be started.