The study of orthodontics includes the knowledge of growth and development of dentofacial complex in particular and the body in general. Physical growth and development manifestation provides useful criteria for orthodontic diagnosis, evaluation and in treatment planning [1]. The developmental status of a child is usually assessed in relation to events that take place during the progress of growth. The biological indicators that are used to identify growth stages are chronological age, dental development, height and weight measurements, sexual maturation characteristics and skeletal age [2]. Many researchers have agreed that in general, skeletal maturity is closely related to the craniofacial growth which can be reliably assessed through the bones of hand and as well as cervical vertebrae [2,3]. A system of skeletal maturity indicators was developed by Fishman LS by utilising using four stages of bone maturation found at six different anatomical sites on hand and wrist radiographs [2,4]. Lamparski is credited with the method for determination of skeletal maturity by the way of cervical vertebrae [5]. The changes in the shape of the cervical vertebrae i.e., the concavity of the inferior edge and the vertical height can help in determining skeletal maturity and residual growth potential [6].
Height and weight are the physical manifestations that can be utilized as a diagnostic criteria in assessment of growth and development [1]. Previous investigators have found obese children to have bone age that significantly exceeds their chronological ages [7]. Adiposity is one of the important factors for skeletal maturity. Furthermore, it has been suggested from the studies of Green LJ [1] and Akridge M et al., [3] that there has been increase in bone size, vertebral bone density and acceleration of skeletal growth due to early onset obesity.
It has been hypothesized that obesity has an impact on craniofacial growth and leads to an earlier skeletal maturation of maxilla and mandible [3,8]. BMI is commonly used to measure adiposity. Age and sex specific BMI percentiles offer a quick non-invasive and readily accessible method to assess a child’s weight status [8]. In growing patients, skeletal development and physical status are widely used to determine the timing of orthodontic treatment and the selection of treatment modalities.
A search of literature revealed that the previous studies have compared BMI percentile with dental age and skeletal maturation. None of the studies have compared the strength of correlation of BMI percentile with two different types of skeletal maturity indicators that are commonly used. The aim of the present study was to compare and correlate the body mass index percentile with two different types of skeletal maturity indicators in orthodontic patients. The objectives of the study included an estimation of body mass index percentiles. Also, to correlate the BMI percentiles with SMI and CVMI. This study also investigates the inter gender variation of these correlation effects.
The present study was done to compare the BMI percentile with CVMI on lateral cephalogram and SMI method.
Materials and Methods
The sample for this observational study was drawn from the subjects registered for orthodontic treatment between January 2011 to December 2015 at Narayana Dental college, Nellore, Andhra Pradesh, India. Ethical clearance was obtained from the Institutional Review Board for the conduct of the study. A total of 900 records were analysed for data collection and a final sample size of 250 subjects (137 males, 113 females) were selected for the study. Inclusion criteria included age Group between 7 to 19 years, mentally and physically healthy individuals, no previous medical and drug history, no history of trauma or no previous orthodontic treatment. Exclusion criteria included adult patients above 20 years of age, cervical vertebrae anomalies, medical conditions particularly endocrinal disturbances, drugs that affect lipid levels, patients under diet control.
Chronological age, height and weight were obtained from the patient’s case sheet records. This data has been utilised to calculate raw BMI scores by the ratio of weight in kilograms to the square power of height in meters (m2). BMI percentile value for each subject were calculated from raw BMI scores taking reference with age and sex specific growth charts from the Center For Disease Control (CDC) [9]. Description of BMI percentile Groups, CVMI Stages and SMI Stages are given in [Table/Fig-1].
Description of BMI percentile groups CVMI stages and SMI stages.
| I. BMI percentile groups |
|---|
| Group I | Less than fifth percentile | Underweight |
| Group II | Fifth to 85th percentile | Normal weight |
| Group III | 85th to 95th percentile | Overweight |
| Group IV | Greater than 95th percentile | Obese |
| II. CVMI stages on cervical vertebrea |
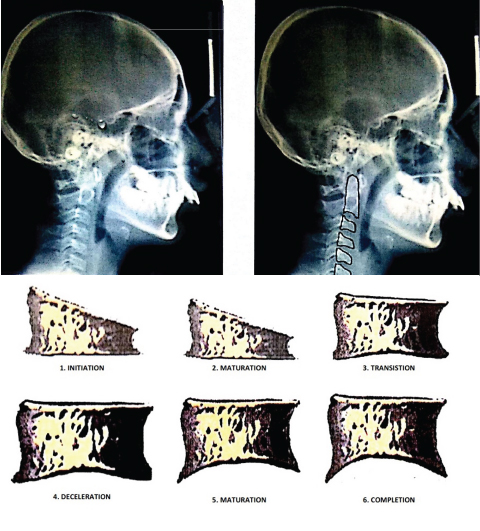
| CVMI Stage | Description |
| 1.0 | Initiation-beginning of growth spurt-80-100% growth expected |
| 2.0 | Acceleration- Accelerating slope with 65-85% growth expected |
| 3.0 | Transition-peak height velocity -25 to 65% growth expected |
| 4.0 | Deceleration-deceleration slope with 10-25% growth expected |
| 5.0 | Maturation-near the end of pubertal growth spurt 5-10% of growth expected |
| 6.0 | Completion- no residual growth is expected |
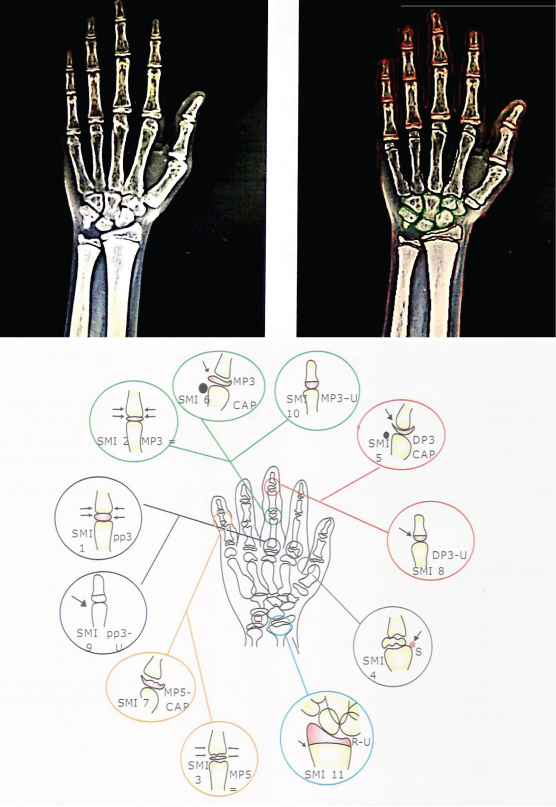
| III. SMI stages on Hand wrist X-ray |
| 1.0 | Pre-onset | Third finger- proximal phalanx (PP3=) |
| 2.0 | Third finger- middle phalanx (MP3=) |
| 3.0 | Fifth finger- middle phalanx (MP5=) |
| 4.0 | Onset | Adductor sesamoid of thumb (S) |
| 5.0 | Accelerating phase and peak height velocity- | Third finger- distal phalanx (DP3-cap) |
| 6.0 | Third finger- middle phalanx (MP3-cap) |
| 7.0 | Fifth finger- middle phalanx (MP5-cap) |
| 8.0 | Decelerating phase | Third finger- distal phalanx (DP3-U) |
| 9.0 | Third finger- Proximal phalanx (PP3) |
| 10.0 | Maturation Completion | Third finger- middle phalanx MP3-U) |
| 11.0 | Radius (R-U) |
Width of epiphysis is equal to diaphysis(=);Capping of epiphysis(cap); ossification of sessamoid (S) Fusion of epiphysis and diaphysis(U);
The individual stages of skeletal maturity was determined by using CVMI on lateral cephalogram [Table/Fig-2] and by hand wrist radiograph (SMI) [Table/Fig-3]. All the lateral cephalogram and the hand wrist radiographs were assessed by single observer (B.S) with more than two years of experience. The distribution tables were prepared separately based on the six stages of CVMI described by Hassel B and Farman AG [10] vertebral index [Table/Fig-2] and 11 stages of SMI as assessed on hand wrist radiographs by Fishman’s index [Table/Fig-4] [4].
Assessment of lateral cehalograms for CVMI stages utilising cervical vertebrae.
Assessment of hand wrist X-Ray for the SMI stages.
Comparison of age, height and weight among study participants according to gender by independent Student’s t-test.
| Variables | Sex | Frequency (n) | Mean | SD | Mean difference (95% CI) | t | df | p-value |
|---|
| Age | M | 137 | 11.53 | 2.14 | -1.33(-1.88,-0.77) | -4.68 | 248 | <0.001* |
| F | 113 | 12.86 | 2.33 |
| Height (cm) | M | 137 | 137.1 | 0.70 | -0.18(-0.34,-0.02) | -2.19 | 248 | 0.06 (NS) |
| F | 113 | 142.2 | 0.55 |
| Weight (kg) | M | 137 | 35.52 | 10.15 | -1.58(-4.33, 1.17) | -1.13 | 248 | 0.26 (NS) |
| F | 113 | 37.10 | 11.92 |
*p<0.001 statistically highly significant;p<0.05 statistically significant; p>0.05 Non significant: NS
Test of error: An initial sample of twenty five subjects were selected randomly and their maturation Stages in both lateral cephalogram and hand wrist radiograph were repeatedly identified and measured after two weeks by the same observer (B.S.). A weighed kappa score was used to assess intra-examiner reliability. Kappa value for both CVMI and SMI combined was 0.7 which indicates that agreement was substantial.
Statistical Analysis
The statistical analysis of the data entered was done by a software package (SPSS Statistics for Windows, Version 21.0. Armonk, NY: 2012). Comparison of age, height and weight of the subjects is done by independent Student’s t-test.
The BMI percentile, CVMI Stages, hand wrist stages in each of the gender Groups were recorded as categorical data by percentage wise distribution of the subjects in each stage or group. The comparison between the independent categorical variables was done after entering the data in contingency tables and evaluated by Fisher’s-exact test.
Kruskal-Wallis test is done for comparison of CVMI and SMI according to BMI percentile Groups. U statistic value was determined to compare CVMI and SMI according to gender in each BMI percentile Group. Spearman’s rank order correlation coefficient was used to assess the relationship between CVMI and hand wrist stages, CVMI and BMI percentile, hand wrist stages and BMI percentile in both the genders. Fisher’s r to z transformation test is applied to calculate a value of z to assess the significance of the difference between two correlation coefficients of BMI and CVMI versus BMI and SMI. In all the tests the p-values <0.05 are taken as statistically significant. All the computer data with readings ‘0’ were taken as 0.001 for all practical purposes for computing the statistical data.
Results
The mean dental age of the males is 11.53±2.14 years where as in females it is 12.86±2.33 years and the variation is statistically significant (p-value <0.001). However, in this study chronological age was not considered as a variable. The difference in the mean height and weight is found to be non significant among the male and female subjects [Table/Fig-4]. Descriptive statistics were obtained by frequency distribution of subjects according to BMI percentile groups and gender [Table/Fig-5,6].
Distribution of subjects across each of the individual stages of CVMI and SMI in each of the BMI percentile groups.
| SMI | CVMI |
|---|
| 1.0 | 2.0 | 3.0 | 4.0 | 5.0 | 6.0 | Total |
|---|
| Group IUnderweight | 1.0 | | 10 | 0 | 0 | 0 | 0 | 10 |
| 2.0 | | 7 | 0 | 0 | 0 | 0 | 7 |
| 3.0 | | 8 | 13 | 0 | 0 | 0 | 21 |
| 4.0 | | 0 | 11 | 0 | 0 | 0 | 11 |
| 5.0 | | 0 | 1 | 0 | 0 | 0 | 1 |
| 6.0 | | 0 | 1 | 4 | 0 | 0 | 5 |
| 7.0 | | 0 | 0 | 4 | 0 | 0 | 4 |
| 9.0 | | 0 | 0 | 0 | 5 | 0 | 5 |
| 10.0 | | 0 | 0 | 0 | 7 | 1 | 8 |
| 11.0 | | 0 | 0 | 0 | 0 | 6 | 6 |
| Total | | 25 | 26 | 8 | 12 | 7 | 78 |
| Group IINormalweight | 2.0 | 3 | 5 | 0 | 0 | 0 | 0 | 8 |
| 3.0 | 0 | 6 | 12 | 0 | 0 | 0 | 18 |
| 4.0 | 0 | 2 | 8 | 3 | 0 | 0 | 13 |
| 5.0 | 0 | 0 | 6 | 0 | 0 | 0 | 6 |
| 6.0 | 0 | 0 | 2 | 3 | 0 | 0 | 5 |
| 7.0 | 0 | 0 | 0 | 4 | 0 | 0 | 4 |
| 8.0 | 0 | 0 | 0 | 9 | 4 | 0 | 13 |
| 9.0 | 0 | 0 | 0 | 4 | 8 | 0 | 12 |
| 10.0 | 0 | 0 | 0 | 0 | 11 | 2 | 13 |
| 11.0 | 0 | 0 | 0 | 0 | 1 | 19 | 20 |
| Total | 3 | 13 | 28 | 23 | 24 | 21 | 112 |
| Group III Overweight | 2.0 | 1 | 0 | 0 | 0 | 0 | | 1 |
| 3.0 | 0 | 3 | 3 | 0 | 0 | | 6 |
| 4.0 | 0 | 4 | 4 | 0 | 0 | | 8 |
| 5.0 | 0 | 0 | 1 | 0 | 0 | | 1 |
| 8.0 | 0 | 0 | 0 | 1 | 0 | | 1 |
| 10.0 | 0 | 0 | 0 | 0 | 8 | | 8 |
| 11.0 | 0 | 0 | 0 | 0 | 1 | | 1 |
| Total | 1 | 7 | 8 | 1 | 9 | | 26 |
| Group IV Obese | 1.0 | 1 | 7 | 0 | | | | 8 |
| 3.0 | 0 | 16 | 10 | | | | 26 |
| Total | 1 | 23 | 10 | | | | 34 |
Distribution of subjects across each of the individual stages of CVMI and SMI in both the genders and corresponding chronological age.
| Males |
|---|
| Age (y/m) | SMI | CVMI | Total |
|---|
| 1.0 | 2.0 | 3.0 | 4.0 | 5.0 | 6.0 |
|---|
| 7.8. | 1.0 | 1 | 12 | 0 | 0 | 0 | 0 | 13 |
| 8.1 | 2.0 | 4 | 8 | 0 | 0 | 0 | 0 | 12 |
| 8.9 | 3.0 | 0 | 19 | 38 | 0 | 0 | 0 | 57 |
| 10.2 | 4.0 | 0 | 5 | 17 | 3 | 0 | 0 | 25 |
| 11.1 | 5.0 | 0 | 0 | 6 | 0 | 0 | 0 | 6 |
| 11.9 | 6.0 | 0 | 0 | 3 | 2 | 0 | 0 | 5 |
| 12.8 | 7.0 | 0 | 0 | 0 | 5 | 0 | 0 | 5 |
| 13.8 | 8.0 | 0 | 0 | 0 | 3 | 4 | 0 | 7 |
| 14.3 | 9.0 | 0 | 0 | 0 | 0 | 1 | 0 | 1 |
| 14.7 | 10.0 | 0 | 0 | 0 | 0 | 4 | 0 | 4 |
| 17.5 | 11.0 | 0 | 0 | 0 | 0 | 1 | 1 | 2 |
| Total | 5 | 44 | 64 | 13 | 10 | 1 | 137 |
| Age (y/m)→ | | 8.9 | 10.2 | 13.1 | 13.6 | 14.2 | 18.2 | Age (y/m)← |
| Females |
| | CVMI | |
| SMI | 1.0 | 2.0 | 3.0 | 4.0 | 5.0 | 6.0 |
| 7.6 | 1.0 | 0 | 0 | 0 | 0 | 0 | 0 | 0 |
| 7.9 | 2.0 | 0 | 4 | 0 | 0 | 0 | 0 | 4 |
| 8.5 | 3.0 | 0 | 14 | 0 | 0 | 0 | 0 | 14 |
| 9.8 | 4.0 | 0 | 1 | 6 | 0 | 0 | 0 | 7 |
| 10.9 | 5.0 | 0 | 0 | 2 | 0 | 0 | 0 | 2 |
| 11.2 | 6.0 | 0 | 0 | 0 | 5 | 0 | 0 | 5 |
| 12.2 | 7.0 | 0 | 0 | 0 | 3 | 0 | 0 | 3 |
| 13.5 | 8.0 | 0 | 0 | 0 | 7 | 0 | 0 | 7 |
| 13.9 | 9.0 | 0 | 0 | 0 | 4 | 12 | 0 | 16 |
| 14.2 | 10.0 | 0 | 0 | 0 | 0 | 22 | 3 | 25 |
| 17.1 | 11.0 | 0 | 0 | 0 | 0 | 1 | 24 | 25 |
| 7.6 | Total | 0 | 24 | 8 | 19 | 35 | 27 | 113 |
| Age (y/m) | | 8.7 | 10.1 | 12.9 | 13.2 | 13.9 | 17.6 | Age (y/m) |
Approximately, (n=112, 45%) of the sample was Group II Normal weight, (n=78, 31.2%) Group I underweight, (n=34, 13.6%) Group IV obese and least in Group III overweight (n=26, 10.4%) [Table/Fig-5]. In underweight and normal weight category, the maximum number of subjects is distributed in CVMI Stage 3 and SMI Stage 3. In overweight category, the maximum percentile distribution is seen in CVMI Stage 5 and SMI Stage 10. In case of obese people, the maximum sample distribution is seen corresponding to SMI 3 and CVMI Stage 2 [Table/Fig-5].
To study the relationship between CVMI and SMI, percentage distribution of the stage to stage had been calculated. Frequency distribution was also done to determine association between CVMI and hand wrist stages in each gender and in each BMI percentile group.
The spread of the subjects according to CVMI stages accorded with highest distribution in Stage 3 (n=82, 29%) followed by Stage 2 (n=68, 27%) and least in Stage 1 (n=5, 2%). In case of SMI, Stage 3 (n=71, 28%) fits into the highest percentage distribution while as lowest percentage distribution is found in Stage 5 (n=8, 3%) and Stage 7 (n=8, 3%) when the subjects are scattered according to the stages in Hand wrist radiographic method [Table/Fig-5,6].
The distribution of subjects according to SMI in each BMI percentile Group in both males and females is depicted. In males most subjects are in Stage 3 of SMI has maximum frequency distribution for all the BMI percentile groups. It is observed that Group II subjects are scattered in each and every stage except Stage 1 which is marked with none of the subjects fit into this category. Highest frequency in Stage 11 was seen, i.e., reflects the fact that distribution and maturation levels are normal in this group. In case of group I (underweight category), none of the subjects are found in the Stage 8 of the SMI. In case of female sample, Group I subjects are mostly present in Stage 3 and Stage 10 [Table/Fig-5].
For each SMI Stage, the column with the maximal number of subjects matching to the corresponding CVMI stage is shaded grey. Most subjects in males are scattered around CVMI Stage 3 and less frequent in Stage 6. In SMI more frequency of distribution is seen in Stage 3 and least in Stage 9. Most numbers of subjects amongst females are spread in CVMI Stage 5 followed by Stage 6 and Stage 2 and least in Stage 1. In SMI more number are in Stage 10 and Stage 11 followed by Stage 9 and Stage 3 and less number in Stage 5 [Table/Fig-5,6].
The correlation of the each of the corresponding Stages of CVMI and SMI in each of the BMI percentile Group and relation shape of individual Stages by gender wise is computed by Fisher’s-exact test independently [Table/Fig-7]. For statistical and descriptive purposes the Stages of SMI were realigned into six groups depending upon the status of maturity as pre onset- early onset, accelerating phase of the spurt, peak height velocity, decelerating phase, maturity and completion. This test shows significant (p-value <0.001) results and proves that there is relation between BMI percentile and maturity status by CVMI in both genders.
CVMI and SMI stages-in relation to BMI groups and gender wise-Fisher’s-Exact test.
| BMI Percentile | CVMI stages n (%) | Total | p-value |
|---|
| 1.0 | 2.0 | 3.0 | 4.0 | 5.0 | 6.0 |
|---|
| Group I: Underweight | 0 | 25 (32.1) | 26 (33.3) | 8 (10.3) | 12 (15.4) | 7 (9.0) | 78 | <0.001* |
| Group II: Normal weight | 3 (2.7) | 13 (11.6) | 28 (25.0) | 23 (20.5) | 24 (21.4) | 21 (18.8) | 112 |
| Group III: Overweight | 1 (2.9) | 23 (67.6) | 10 (29.4) | 0 | 0 | 0 | 26 |
| Group IV: Obese | 1 (3.8) | 7 (26.9) | 8 (30.8) | 1 (3.8) | 9 (34.6) | 0 | 34 |
| Gender |
| Male | 5 (100) | 44 (64.70) | 64 (88.8) | 13 (40.62) | 10 (22.22) | 1 (3.5) | 137 | <0.001* |
| Female | 0 | 24 (35.30) | 8 (11.2) | 19 (59.38) | 35 (78.78) | 27 (96.5) | 113 |
| SMI stages n (%) |
| BMI Percentile | Pre-pubertal | Acceleration | Peak height velocity | Decelerating | Maturation | Growth completion | Total | p-value |
| 1.0-4.0 | 5.0-6.0 | 7.0 | 8.0-9.0 | 10.0 | 11.0 |
| Group I: Underweight | 49 (62.82) | 6 (7.69) | 4 (5.12) | 5 (6.41) | 8 (10.25) | 6 (7.69) | 78 | <0.001* |
| Group II: Normal weight | 39 (34.82) | 11 (9.82) | 4 (3.57) | 25 (22.32) | 13 (11.60) | 20 (17.85) | 112 |
| Group III: Overweight | 15 (57.69) | 1 (3.84) | 0 | 1 (3.84) | 8 (30.76) | 1 (3.84) | 26 |
| Group IV: Obese | 8 (23.52) | 0 | 26 (76.47) | 0 | 0 | 0 | 34 |
| Gender |
| Male | 61 (54.46) | 11 (61.11) | 18 (52.94) | 17 (54.83) | 16 (55.17) | 16 (59.25) | 137 | <0.001* |
| Female | 51 (45.54) | 7 (38.89) | 16 (47.06) | 14 (45.17) | 13 (44.83) | 11 (40.75) | 113 |
*p<0.001 statistically highly significant; p<0.05 statistically significant; p>0.05 Non significant, NS
The results [Table/Fig-8] show comparison between the CVMI Stages and SMI Stages in and the difference is significant (p-value <0.001) between males and females in both CVMI (U=3644) and SMI Stages (U=3104.5). Median of the sample is taken as there is skewed distribution. The Mann-Whitney U test indicated that in males median of the population in CVMI is Stage 3 where as in females the median is at Stage 5. While comparing SMI, it is seen that median in females is in Stage 9 while it is Stage 5 for male subjects.
Comparison of CVMI and SMI according to BMI percentile and gender.
| Sex | Frequency (n) | Percentiles | Mann Whitney U-test | p-value |
|---|
| 25th | 50th (Median) | 75th | U statistic |
|---|
| CVMI | Male | 137 | 2 | 3 | 3 | 3644.00 | <0.001* |
| Female | 113 | 3 | 5 | 5 |
| SMI | Male | 137 | 3 | 3 | 4 | 3104.500 | <0.001* |
| Female | 113 | 4 | 9 | 10 |
| BMI% | Frequency (n) | Kruskal-Wallis test | 50th (Median) | 75th | Chi-square value | p-value |
| 25th |
| CVMI | Group I | 78 | 2 | 3 | 4.25 | 47.86 | <0.001* |
| Group II | 112 | 3 | 4 | 5 |
| Group III | 26 | 2 | 3 | 5 |
| Group IV | 34 | 2 | 2 | 3 |
| SMI | Group I | 78 | 3 | 4 | 7.5 | 54.30 | <0.001* |
| Group II | 112 | 4 | 8 | 10 |
| Group III | 26 | 3 | 4 | 10 |
| Group IV | 34 | 2.5 | 3 | 3 |
*p<0.001 statistically highly significant;p<0.05 statistically significant; p>0.05 Non significant, NS
The Kruskal-Wallis H test [Table/Fig-8] was used to determine if there are statistically significant differences between BMI percentile Groups to that of CVMI and SMI Stages. It shows significant difference p-value <0.001 between BMI groups as related to cervical maturation and hand wrist radiographs. Results showed that there was a statistically significant difference in median scores for different Groups of BMI percentiles when CVMI stages are compared, χ2 = 47.86, p-value <0.001. The U statistic test is utilised to investigate the effect of gender in comparing the CVMI and SMI in each of the BMI percentile Group [Table/Fig-9].
Comparison of CVMI and SMI according to gender in each of the BMI percentile group - U statistic test.
| BMI | Methods of Estimation | Sex | Frequency (n) | Minimum | Maximum | Percentiles |
|---|
| 25th | 50th (Median) | 75th | U statistic | p-value |
|---|
| Group IUnderweight | CVMI | M | 35 | 2 | 4 | 2 | 3 | 3 | 556.00 | 0.04* |
| F | 43 | 2 | 6 | 2 | 4 | 5 |
| SMI | M | 35 | 1 | 7 | 2 | 3 | 4 | 444.00 | 0.002* |
| F | 43 | 1 | 11 | 3 | 6 | 10 |
| Group IINormal weight | CVMI | M | 56 | 1 | 6 | 3 | 3 | 4 | 587.00 | <0.001* |
| F | 56 | 2 | 6 | 4 | 5 | 6 |
| SMI | M | 56 | 2 | 11 | 3 | 4 | 6.75 | 462.50 | <0.001* |
| F | 56 | 3 | 11 | 8 | 9 | 11 |
| Group IIIOver weight | CVMI | M | 16 | 1 | 4 | 2 | 3 | 3 | 12.00 | <0.001* |
| F | 10 | 2 | 5 | 5 | 5 | 5 |
| SMI | M | 16 | 2 | 8 | 3 | 4 | 4 | 12.50 | <0.001* |
| F | 10 | 3 | 11 | 10 | 10 | 10 |
| Group IVObese | CVMI | M | 30 | 1 | 3 | 2 | 2 | 3 | 42.00 | 0.24 NS |
| F | 4 | 2 | 2 | 2 | 2 | 2 |
| SMI | M | 30 | 1 | 3 | 2.5 | 3 | 3 | 59.00 | 0.94 NS |
| F | 4 | 1 | 3 | 1.5 | 3 | 3 |
*p<0.001 statistically highly significant;p<0.05 statistically significant; p>0.05 Non significant, NS
The strength of association and correlation between CVMI, SMI and BMI percentile in males, females and total subjects is described [Table/Fig-10]. Spearman’s rank order correlation coefficients were estimated to measure the association between CVMI and SMI, CVMI and BMI, SMI and BMI. There is a strong positive correlation between CVMI and SMI in both males and females which is more pronounced in females (0.97) indicating the relative biological timing of maturation stages by both the methods.
Comparison of Correlation coefficient between CVMI and SMI, CVMI and BMI, SMI and BMI in both gender groups.
| Gender | | SMI | BMI | Z-value | p-value |
|---|
| Male | CVMI | Sr=0.78 | Sa=-0.28 | -1.2 | 0.11(NS) |
| p<0.001* | p=0.001* |
| SMI | | Sb=-0.14 |
| p=0.10(NS) |
| Female | CVMI | Sr=0.97 | Sa=0.16 | -0.54 | 0.29(NS) |
| p<0.001* | p=0.09(NS) |
| SMI | | Sb=0.23 |
| p=0.02* |
| Overall | CVMI | Sr=0.93 | Sa=-0.15 | -0.79 | 0.21(NS) |
| p<0.001* | p=0.02* |
| SMI | | Sb=-0.08 |
| p=0.19(NS) |
*p<0.001 statistically highly significant; p<0.05 statistically significant; p>0.05 Non significant, NS; Sr - correlation between CVMI and BMI; Sa-Correlation between CVMI and BMI; Sb- Correlation between SMI and BMI
Fisher’s r to z transformation test is applied to calculate a value of z to assess the significance of the difference between two correlation coefficients: CVMI and BMI (ra) to that of SMI and BMI (rb) in relation to BMI [Table/Fig-10]. If Z-value is negative it determines that ra is lesser than rb. If it is positive then ra is greater than rb. Thus the difference of correlation coefficients is negative but is not statistically significant in both the genders.
Discussion
The phase of skeletal maturation is crucial in case of Orthodontic treatment so that the benefit of growth potential can be utilized for growth modulation. It is difficult to determine skeletal maturity and growth velocity by individual’s chronological age alone. Radiographic evidence of cervical vertebrae or hand wrist can be used to assess the biological age of the patient [3-6]. The individuals may exhibit variations in growth patterns, which in turn affect the physical growth and development of individuals when compared with their matured age group. Therefore there is need to evaluate the relation of maturation to height, weight, age and sex [1].
Skeletal maturation is the key aspect in deciding the optimal age and modality of orthodontic treatment. Several studies have shown the relationship between skeletal maturation, chronological age, height and weight status [1,7,8,11]. Further, there are studies which claimed that there was a relation between the weight of individual and skeletal maturation [12-15].
Russell DL et al., reported that in his study skeletal age was significantly correlated with adiposity or body mass index [7]. Advancement of pre pubertal and early pubertal maturation was seen with increased body mass but the study was restricted to African American children. Giucia MR et al., reported that skeletal maturation was earlier in obese people compared to non-obese people [12]. Early maturation was seen in girls with overweight compared to normal weight girls. Mack RW et al., reported that early maturation was seen in individuals with high BMI percentile [13]. He compared dental and skeletal maturity with BMI percentile and concluded there was early dental and skeletal maturity in individuals with increased BMI percentile in both girls and boys. A similar study by Adair LS and Larsen PG, concluded in their study that there is a strong relation between high prevalence of overweight and early maturation among US adolescent girls [14]. Bratberg GH et al., reported that early sexual maturation is significant in girls but not in boys [15]. According to the results of these studies, overweight people had early onset of maturation when compared to normal weighed individual. Considering the early skeletal maturity in overweight individuals, orthopaedic and myofunctional treatment should be carried out at a relatively early age.
In contrast to the earlier studies [12-15], the findings of the present study revealed that skeletal maturation was not consistently associated with an increase in body mass. In Group II normal weight category the sample is spread uniformly in all the Stages of skeletal maturity with the maximum distribution in Stage 3 of SMI and CVMI. The subjects were spread in all stages of maturity in normal and underweight subjects compared to overweight and obese groups. In the overweight group, it is seen that the persons of advanced stages of maturation in CVMI Stage 5 and SMI Stage 10 are dominant though the sample is more or less equally distributed in SMI 2 and SMI 3 Stages. Contrary to expectation; however, in the obese group the skeletal maturity is not associated with increase in the gain in weight with the sample being distributed in early Stages of maturity. Therefore, the present study disagrees that increased BMI and weight gain are consistently related to early skeletal maturation.
There is a considerable overlap of relevant stages of maturation in the contingency table when evaluating the comparative stages of maturation by both CVMI and SMI method. In tune with the previous studies, the females are more advanced in case of skeletal maturity at a given point of mean chronological age [Table/Fig-6].
Most of the previous studies by Gandini P et al., Baccetti T et al., Lai EHH et al., and Manosudprasit M et al., compared the CVMI and SMI but there are very limited studies that considered the BMI percentile along with [16-19]. This study was taken up in order to draw a relation between BMI percentile and the other two different types of skeletal maturity indicators. When individuals have an increased BMI there is an early onset of puberty both in boys and girls. Early skeletal maturation was seen in the overweight compared to the underweight and normal subjects however, no consistent relationship among these parameters in the obese subjects. According to the results of present study, CVMI and SMI were strongly inter related to each other with nearly positive correlation of 1(0.93) in both the genders. Both these methods were significantly correlated so that any one method can be used for the assessment of skeletal maturation.
Comparison of CVMI and SMI [Table/Fig-8] in relation to BMI percentile groups and gender wise demonstrated stochastic dominance of group over the other.
However, the correlation between CVMI and BMI is inconsistent. There is negative correlation (-0.28) between CVMI and BMI in males (p-value <0.001) but this association is significantly absent in females. In the overall sample, a minuscule relation is seen between the two variables. The correlation has been reversed when comparisons between SMI and BMI are done in both males and females. A notable positive correlation (0.23) in females is noted with a slightly negative relation is noted in males (-0.14) which is not statistically significant. This may be attributed to the difference in sample size distribution [Table/Fig-10]. The results also that the there is no difference in correlation of BMI-CVMI and BMI-SMI so that either of them can be used [Table/Fig-10].
Mamun AA et al., studied whether overweight and maturation in early Stages associate with young adults overweight [20]. This study reported that early maturation was related to obesity in both boys and girls and also reported that early maturation and childhood obesity are important in prediction of adult obesity. There was no steady correlation indicating a weak association between the variables, skeletal maturation and weight status when gender wise comparisons are made. This conflicting results in the present study may be due to difference in the sample size between the groups and the mode of study as it is a cross-sectional study. Further studies with larger sample sizes should be carried out to evaluate the correlation between weight status and skeletal maturation. If obesity and skeletal maturation are associated, then patients BMI should be considered during deciding treatment modalities.
Limitation
The nature of the study is that this was basically an observational type based on the previous records. There is unequal distribution of male and female subjects which makes more vulnerable to methodological problems. Further, the BMI percentile grouping was done on data available from CDC and not on local ethnic groups. The implication of the results of present study for clinical application can be investigated further by obtaining a larger sample size in the groups. Well-planned longitudinal studies could provide further insight; however, gathering appropriate sample data is quite difficult.
Conclusion
A significant percentage of patients were either overweight/obese. As an orthodontist, knowing the weight status will be useful in planning the treatment early in the patients who have more BMI with early maturation. There was significant relationship between weight status as defined by BMI percentile and skeletal maturation in males. An increase in BMI was associated with increased skeletal age. No significant difference in correlation was present when either of the SMI or CVMI were compared with BMI percentile.
Width of epiphysis is equal to diaphysis(=);Capping of epiphysis(cap); ossification of sessamoid (S) Fusion of epiphysis and diaphysis(U);
*p<0.001 statistically highly significant;p<0.05 statistically significant; p>0.05 Non significant: NS
*p<0.001 statistically highly significant; p<0.05 statistically significant; p>0.05 Non significant, NS
*p<0.001 statistically highly significant;p<0.05 statistically significant; p>0.05 Non significant, NS
*p<0.001 statistically highly significant;p<0.05 statistically significant; p>0.05 Non significant, NS
*p<0.001 statistically highly significant; p<0.05 statistically significant; p>0.05 Non significant, NS; Sr - correlation between CVMI and BMI; Sa-Correlation between CVMI and BMI; Sb- Correlation between SMI and BMI