One of the main challenges in recent times is to identify the gender of the victim found in war crimes, natural disaster and terrorist attacks or any other circumstances with an elevated number of cadavers. Nowadays, in forensic anthropology the number of new techniques for identification of gender is constantly increasing. The DNA technologies are the most consistent ones, but the accessibility of forensic legal laboratories and the cost effectiveness of these technologies have limited their dispersion on a large scale. In spite of the fact that DNA is normally utilised for disaster victim identification or in identification of human remains found in mass graves, the utilisation of "conventional" techniques is typically ideal but technologically costly (example: DNA analysis) [1].
Other skeletal components have now been considered in this field, for example skull, tibia, humerus, foramen magnum, hyoid etc., [2-4]. The bone which was examined in the present study was a flat bone: the scapula. The decision to concentrate on the scapula was because of its negligible morphological changes throughout life after the development is complete. Also, by the situation that frequently appears in case of acts of terrorism, charred bodies or disaster victim identification, where flat and short bones appear to be secured over long bones, long bone are frequently broken and scattered [5]. Till date few Indians study have reported on this aspect[6-9]. The parameters used in the present study were different from the previous research. Hence, the current work was designed to measure gender differences of scapula by MDCT.
Materials and Methods
The prospective cross-sectional study included 93 males and 93 females sample in the age range between 20 to 80 years from the Department of Radiodiagnosis and Imaging, Kasturba Hospital, Manipal, Karnataka, India. Study procedure was explained and informed consent was taken from the selected patients. To perform the present study, ethical clearance was obtained from the Ethical Committee of Kasturba Medical Hospital and Institutional Research Committee, School of Allied Health Sciences (SOAHS). The variables which were used for sample size calculation were Standard deviation, clinical significance, confidence Interval 95%.
This study was performed between September 2015 to March 2017. The inclusion criteria were patients scheduled for CT of thorax during the study period. The exclusion criteria were shoulder girdle injury, implants and trauma.
CT of the thorax was performed on MDCT Brilliance 64 slice Phillips with the normal routine protocol. Patients appointed for CT of the thorax were positioned on the CT couch in supine position, with the area coverage from the apex of the lung to domes of the diaphragm, scannogram of the anatomical region was acquired in Posterior-Anterior (PA) position. Scan direction was craniocaudal with no gantry angulations. The scanning protocol was the following: collimation of 64×0.625, rotation time 0.75 seconds, FOV 350 mm, tube voltage of 120 kVp, tube current of 250 mAs, pitch of 1.078 and scan time 4.9 seconds. A scan of the required area of interest was performed on the acquired scannogram, the slice thickness of 5 mm, slice increment of 5 mm, a filter of sharp C and resolution standard. During the scan, the patients were instructed properly to eliminate motion artefacts. The original series of thorax scan having slice thickness of 5 mm with an increment of 5 mm were selected and reconstructed to slice thickness of 1 mm and with an increment of 1 mm with a filter of standard B. After collecting the raw data of each patient, the 2D CT scan axial images were reconstructed into 3D images through post-processing (volume rendering) technique. During the entire data collection period, the researcher was blinded to the demography of the patients and other measurement parameters of the scapula. Measurements are shown as [Table/Fig-1a-d].
a) Figure showing right longitudinal scapular length; b) Figure showing left longitudinal scapular length; c) Figure showing right transverse and oblique scapular length; d) Figure showing left transverse and oblique scapular length.
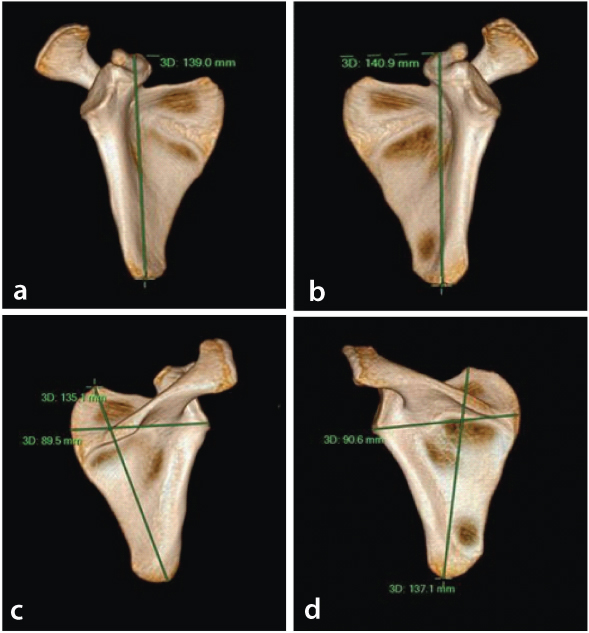
Longitudinal scapular length (LSL)-The distance between the end of the inferior angle and the superior margin of the coracoid process.
Transverse Scapular Length (TSL)-The distance between the medial margin and the inferior margin of the glenoid cavity.
Oblique scapular length (OSL)-The distance between the end of the inferior angle and the superior angle of the scapula.
Statistical Analysis
The data were analysed by using Social Package of Statistical Science (SPSS, version 20.0) software. Statistical analysis was done by calculating the mean and standard deviation of both scapular measurements. After which further analysis was done using MANOVA and discriminant function analysis.
Results
In present study, a total of 93 males and 93 females were included. The descriptive statistics for the six variables were reported, which shows the mean and standard deviation of both sexes [Table/Fig-2].
Mean and standard deviation of the scapular measurements.
| Scapular measurements | Sex | Mean | Standarddeviation |
|---|
| Scale longitudinal right scapula | Male (n=93) | 16.45 | 0.83 |
| Female (n=93) | 14.53 | 0.66 |
| Scale longitudinal left scapula | Male (n=93) | 16.38 | 0.81 |
| Female (n=93) | 14.37 | 0.67 |
| Scale transverse right scapula | Male (n=93) | 10.78 | 0.49 |
| Female(n=93) | 9.66 | 0.45 |
| Scale transverse left scapula | Male (n=93) | 10.87 | 0.49 |
| Female (n=93) | 9.65 | 0.44 |
| Scale oblique right scapula | Male (n=93) | 14.84 | 0.77 |
| Female (n=93) | 13.02 | 0.68 |
| Scale oblique left scapula | Male (n=93) | 14.99 | 0.74 |
| Female (n=93) | 13.16 | 0.70 |
MANOVA test was done where there are multiple variables. Wilks’ lambda test was utilised as a part of the multivariate analysis of variance MANOVA to know whether there were differences between the means of identified groups of subjects on a combination of dependent variables. Wilks’ lambda was additionally used to test the significant differences between the groups of the individual predictor variables. In Wilks’ lambda test scale range from 0-1, where 0 means total discrimination and 1 means no discrimination. The lower the value of Wilks’ lambda, the better would be the results. In this study, the Wilks’ lambda value is 0.290. A p-value <0.05 was considered significant.
The scapular measurements show statistically significant difference between two mean vector groups i.e., females and males groups (p<0.001).
In discriminant function analysis, on comparing canonical discriminant function coefficients it was conceivable to recognise which independent variable was more segregating. The higher the discriminating power, higher the discriminant coefficient.
In present study, transverse left scapula contributed much separation followed by longitudinal left scapula, oblique right scapula, oblique left scapula, longitudinal right scapula and transverse right scapula as shown in [Table/Fig-3].
Canonical discriminant function coefficients.
| Scapular measurements | Function 1 |
|---|
| Scale longitudinal right scapula | -0.093 |
| Scale longitudinal left scapula | 0.498 |
| Scale transverse right scapula | -0.297 |
| Scale transverse left scapula | 1.294 |
| Scale oblique right scapula | 0.341 |
| Scale oblique left scapula(Constant) | 0.229-24.454 |
Upcoming new samples can be categorised or calculated by using these standard values obtain from both sexes. To employ the discrimination formulae, the linear equation y=m1×1+m2×2+...+b should be employed.
Male= -355.313+7.438 (Scale oblique left scapula) + 5.930 (Scale oblique right scapula) + 21.490 (Scale transverse left scapula) + 13.020 (Scale transverse right scapula) + (-1.008) (Scale longitudinal left scapula) + 9.239 (Scale longitudinal right scapula) [Table/Fig-4].
Classification function coefficients gender determination values in scapular measurements for a new data set.
| Scapular measurements | Sex |
|---|
| Male | Female |
|---|
| Scale longitudinal right scapula | 9.239 | 9.528 |
| Scale longitudinal left scapula | -1.008 | -2.557 |
| Scale transverse right scapula | 13.020 | 13.943 |
| Scale transverse left scapula | 21.490 | 17.462 |
| Scale oblique right scapula | 5.930 | 4.869 |
| Scale oblique left scapula(Constant) | 7.438-355.313 | 6.726-279.225 |
Female= -279.225+6.726 (Scale oblique left scapula) + 4.869 (Scale oblique right scapula)+17.462 (Scale transverse left scapula)+13.943 (Scale transverse right scapula)+(-2.557) (Scale longitudinal left scapula)+9.528 (Scale longitudinal right scapula) [Table/Fig-4].
The values of LSL, TSL and OSL were measured from both the groups. After calculating the value of both groups, we can predict and classify the gender.
Discussion
In the present study, the descriptive statistics of six variables was reported which shows mean and standard deviation for both sexes. The overall mean value collected from the scapula of males was larger than the females, which indicated the significant difference of both the groups.
In 1894 Dabbs G, conducted a study based on sex determination using the scapula in New Kingdom skeletons from Tell El-Amarna. In this project descriptive statistics for the five variables were included (maximum length of the scapula, maximum length of the spine, breadth of infraspinous body, height of glenoid prominence and Breadth of glenoid prominence) which shows the mean and standard deviation of both sexes as well as the t-values for both sexes [10]. In present study multivariate test was done which demonstrate there was significant difference between males and females for all the six variables (p<0.001). Dabbs G reported in his study t-test were done which shows there is statistically significant difference between males and females for all the five variables (p<0.001) [10]. Zhang K et al., also conducted a study based on scapular measurement to estimate stature and sex in chinese population, which demonstrate statistical significance difference by using Student’s t-test [11]. El Morsi DA et al., conducted a study based on scapular measurement in Egyptian population which shows no statistical significant difference between both sides of the scapular parameters [12].
In present study multivariate analysis was done for the variables. In that analysis, the value of Wilks’ lambda was 0.290. The smaller the value of Wilks’ lambda the stronger the discrimination of the variables. In present study, transverse left scapula contributed much separation compare to other meaurement. Ismail Ozer I et al., reported in his study the value of Wilks’ lambda for glenoid cavity height is 0.265 and it was the first variables to be selected by the stepwise discriminant function followed by glenoid cavity breadth, maximum scapular breadth and maximum scapular height [13].
Patel SM et al., also conducted a study based on scapular measurement (maximum scapular breadth, maximum scapular height, glenoid cavity height, glenoid cavity breadth) which demonstrate there is significant difference (p<0.001) between male and female for the mean value of all measurements except glenoid cavity breadth [6].
Giurazza F et al., reported his study by using two methods first method using two variable discriminant function provide accuracy of 88% and 90% of the calibration sample and the skeletons. Actually in skeleton recoveries bones appear frequently fragmented so they used another method based on single scapular parameter which shows slightly lower accuracy than the approach based on two variable approach: using only longitudinal scapular length the accuracy was 84% in the calibration sample and 80% of the skeleton collection and using only transverse scapular length the accuracy was 87% in the calibration sample and 80% of the skeletal collection [1]. In the present study using only one method that was three variable discrimination functions on both scapular parameters with the overall cross-validated accuracy of 93.5%.
The comparison of the previous studies with the current study has been enlisted [Table/Fig-5].
Comparison of p-values and result accuracy of previous studies with current study.
| Study | Number of Patients | p-value | Result accuracy |
|---|
| Giurazza F et al., [1] | 200 (100 males and 100 females) | p<0.001 | 88% and 90% |
| Dabbs G [10] | 27 (14 males and 13 females) | p<0.001 | 84%-88% |
| Zhang K et al., [11] | 414 (224 males and 190 females) | p<0.001 | 86.7%-80% |
| Ozer I et al., [13] | 93 (47 males and 46 females) | p<0.001 | 94.8% |
| Paulis MG et al., [14] | 200 (100 males and 100 females) | p<0.001 | 91% |
| Di Vella G et al., [15] | 80 (40 males and 40 females) | p<0.0001 | 95% |
| Current study | 186 (93 males and 93 females) | p<0.001 | 93.5% |
Limitation
The data measured were randomly selected which might have created bias. Study sample size was small as it was a time bound study and if a large sample size would have been used it might have led to a better accuracy. Only three variables (longitudinal scapular length, transverse scapular length and oblique scapular length) of both scapulas were used, there are still so many variables which were measureable. Further research can be conducted to overcome these limitations of the present study.
Conclusion
In present study several measurements of scapula were taken such as scale longitudinal right scapula, scale longitudinal left scapula, scale transverse right scapula, scale transverse left scapula, scale oblique right scapula and scale oblique left scapula so the results reflected that all estimations used as a part of this study were good discriminators but transverse left scapula contributed much separation with highest accuracy compare to others. The present study concluded that the scapular estimations can be useful with a high precision of accuracy to determine gender in Dakshina Kannada population.