In past two decades, low and middle income countries had a paradigm shift of focus from infectious diseases, maternal and child health to Non Communicable Diseases (NCD). Of the NCD’s, Cardiovascular Disease (CVD) is number one cause of mortality [1]. In India, 24.8% of all deaths are attributed to CVD [2]. Indians have high probability of having a CVD at an early age than the western world [3]. Sustainable development goal 3.4 focuses on reducing one third of premature mortalities from NCDs with strong concern for CVD in developing countries [4].
World Health Organisation (WHO) has recommended WC, W:H and waist to height ratio (W:Ht) as a tool to screen the general population for risk of CVD [5]. But, WC has disadvantages like variations in measurements with respiration, variations in measurements with post prandial states, variations in measurement on heavy clothing and also poses difficulties in bed ridden patients [6].
Upper body fat has been associated with increased cardiovascular risk in various studies [7-10]. To measure this visceral fat, Computed Tomography (CT) and Magnetic Resonance Imaging (MRI) are used as gold standard tests and Dual Energy X ray Absorptiometry (DEXA) is used as an alternative. But, these are expensive and not feasible in epidemiological studies [11]. Measuring NC can be a practical and economical method used to measure the upper body fat. NC is positively correlated to WC and BMI in various studies [8,9,12-16]. But, few studies have been conducted in India. So, we conducted this study to correlate NC with W:H ratio and find the best cut-off point to assess the CVD risk in adults.
Materials and Methods
This community based cross-sectional study was conducted in urban and rural field practice area of tertiary care hospital in Maharashtra, India. It was conducted from September 2016 to December 2016. The Hospital caters has a population of 35,000 and 25,000 in urban and rural areas respectively. The subjects included in the study were apparently healthy individuals who gave consent and were permanent residents of the field practice area. The subjects having history of thyroid disease or enlargement, pregnant women, bed ridden and chronically ill patients were excluded from the study. After necessary permissions from the local authorities, a complete voter ID list was obtained. The study subjects were then selected by using computer generated random number table. A study conducted by Ozkaya I et al., inferred that the correlation coefficients between W:H ratio and NC among males and females to be 0.646 and 0.246 respectively [17]. Taking this as reference, we calculated the sample size using the formula for difference between the two correlations. With alpha=0.05 and beta=0.95, the minimum sample size for each gender to be 101 study subjects. We recruited 300 study subjects in our study with 100% participation rate. Ethical committee permission was sought before the start of the study. The case record form had socio demographic variables like age and sex with anthropometric variables like height, weight, WC, HC and NC. This case record form was finalised by a team of experts and was tested in the field among 15 study subjects. The necessary changes were made in the case record form to be used for data collection. Anthropometric variables like WC and HC were measured using a non stretchable tape according to standard guidelines [18]. NC was measured in the midway of neck with a non stretchable tape. In men the NC was measured just below the Adam’s apple [12]. W:H ratio was calculated and classified based on the Asian Indian cut off. W:H ratio of ≥0.89 for men and ≥0.81 for women were considered to have CVD risk [19].
Statistical Analysis
Epi info 7.1 was used to collect the data and SPSS version 20.00 was used for analysis. Age was categorised in age groups and expressed in percentages. Continuous variables like WC, HC, W:H ratio and NC were expressed in terms of mean and standard deviations after passing the tests of normality. To test the difference between the proportions, chi-square test was used and to test the difference between two means, independent t-test was used. Pearson’s correlation coefficient was calculated between NC and W:H ratio. The ROC curves was constructed separately for males and females by plotting the true positive and false positive rates. Area under the curve was interpreted accordingly. Youden index (J) is derived by the formula J=Sensitivity+Specificity-1. So, for all possible cut off points J was calculated, the cut off with highest J value was considered to be the best cut off [20]. Further these cut offs were tested on 60 different (apart from the present study sample) study subjects (Male=30; Female=30) and sensitivity, specificity, positive predictive value, negative predictive value and diagnostic accuracy were calculated. P-value less than 0.05 was said to be significant.
Results
Total of 300 study subjects were recruited in our study. The average age of the study population was 44.70±20.24 years. The mean height of the study subjects was 158.99±10.15 cm and the mean weight was 56.41±11.79 kg.
Among 150 males, majority (33.33%) were between 60 to 80 years, followed by 40 to 60 years (28%), less than 20 years (26%) and 20 to 40 years (12.67%). Among 150 females, majority (30.67%) were less than 20 years group, followed by 40 to 60 years (29.33%), 60 to 80 years (26.67%) and 20 to 40 years (13.33%). The mean HC was higher in females when compared to males (p<0.001). And the mean W:H ratio and NC were significantly higher in males than females (p<0.001). But, WC did not attain the level of significance [Table/Fig-1].
General characteristics of the study subjects.
| General characteristics | Males | Females | p-valuea (%) |
|---|
| Age Group (Years) | n (%) | n (%) |
|---|
| <20 | 39 (26) | 46 (30.67) | 0.6237 |
| 20-40 | 19 (12.67) | 20 (13.33) |
| 40-60 | 42 (28) | 44 (29.33) |
| 60-80 | 50 (33.33) | 40 (26.67) |
| Total | 150 (100) | 150 (100) |
| Anthropometric parameters | Mean (SD) | Mean (SD) | p-valueb |
| Waist circumference@ | 82.67 (13.13) | 82.84 (12.66) | 0.9092 |
| Hip circumference@ | 90.12 (8.09) | 94.77 (9.74) | <0.001* |
| Waist to hip ratio | 0.91 (0.10) | 0.87 (0.08) | <0.001* |
| Neck circumference@ | 36.79 (3.29) | 33.46 (2.94) | <0.001* |
@-in centimetres, *-Significant, n-Number, %-Percentage, SD-Standard deviation, a-Chi square test, b-Unpaired t-test.
There was a significant association between NC and W:H ratio of females in the study (p< 0.001) [Table/Fig-2]. The mean NC of males having CVD risk was significantly higher than who did not have CVD risk (p< 0.001).
General characteristics of the study subjects.
| Gender | Cardiovascular risk | Neck Circumference | p-valuea |
|---|
| Mean | SD |
|---|
| Females | Present (W:H ≥0.81) | 33.92 | 3.07 | <0.001* |
| Absent (W:H <0.81) | 32.11 | 1.98 |
| Males | Present (W:H ≥0.89) | 37.76 | 3.38 | <0.001* |
| Absent (W:H <0.89) | 35.26 | 2.51 |
a-Unpaired t-test; SD-Standard Deviation, *-Significant
There was a significant moderate correlation between NC with their W:H ratio in males (r=0.42) and females (r=0.33) [Table/Fig-3].
Pearson’s correlation coefficient of neck circumference with W:H ratio.
| Male | Female |
|---|
| W:H ratio | r | p-value | r | p-value |
|---|
| 0.42 | <0.001* | 0.33 | <0.001* |
r-Pearson’s correlation coefficient, *-Significant
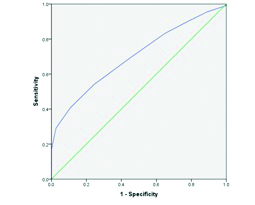
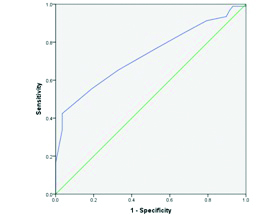
ROC analysis was done for NC in both the gender. The Area under Curve (AUC) was 0.70 (0.61 to 0.79) and 0.73 (0.65 to 0.81) in females and males respectively [Table/Fig-4,5]. Further, we tested the best cut off of NC for females (32.5 cm) in 30 females and found that the sensitivity, specificity, positive predictive value, negative predictive value and diagnostic accuracy to be 69.91%, 54.05%, 82.29%, 37.04%, and 66% respectively. We also tested the best cut off of NC for 30 males (35.50 cm) and found that the sensitivity, specificity, positive predictive value, negative predictive value and diagnostic accuracy to be 76.09%, 50.00%, 70.71%, 56.86%, and 66% respectively.
Receiver operating curves for neck circumference among females.
Area under curve=0.70 (0.61 to 0.79)
Receiver operating curves for neck circumference among males.
Area under the curve=0.73 (0.65 to 0.81)
Discussion
NC is easy, less cumbersome and practical method but rarely used in clinical practice. In present study, significantly higher mean NC was found in study subjects having CVD risk when compared to the subjects that do not have CVD.
We found a significant moderately positive correlation between W:H ratio and NC among males (r=0.423) and females (r=0.331) in our study. Similar findings were reported by Ozkaya I et al., Saka M et al., Hingorjo MR et al., Hasan HS et al., [17,21-23]. But, findings by Maryhan H et al., and Abdolahi H et al., showed that males did not show significant correlation between NC and W:H ratio [24,25]. Similarly, a study reported by Karki BB et al., did not find significant correlation between NC and W:H ratio [26]. A study conducted by Tseh W et al., was done using DEXA as method for assessing abdominal and upper body obesity reported findings similar to our study [27]. But, the correlation was higher in case of females than with males which were not in accordance with our study findings. In our study, significant association between NC with CVD risk was found in both males and females. Similar findings were reported in studies by Preis SR et al., Vallianou NG et al., Zhou et al., Limpawattana P et al., Baena CP et al., [7,8,10,16,28]. This adds to the pool of knowledge that NC can be considered to determine risk of CVD irrespective of the geographical location and ethnicity.
Very few studies have reported the cut off values of NC comparing it with W:H ratio. A study conducted by Ang NS et al., reported the cut off of ≥40 cm in males and ≥33.8 cm in females [15]. Our cut offs were much lower when compared to this study. They further reported that NC was a good test based on AUC (0.831) in both males and females. But, we found NC to be a fair test with AUC of 0.73 (0.65 to 0.81) and 0.70 (0.61 to 0.79) in males and females respectively. They also found sensitivity, specificity and diagnostic accuracy in males to be 62.07%, 90.09% and 75.77% respectively. Similarly, in females the sensitivity, specificity and diagnostic accuracy was 67.59%, 85.50% and 75.76% respectively. Our study reported higher sensitivity, lower specificity and diagnostic accuracies when compared with this study. Many studies have reported cut-offs of NC for metabolic syndrome, obesity, hypertension and very few on coronary artery disease. Study by Arjmand G et al., reported a cut off of ≥38.25 cm of NC to have high risk of Coronary artery disease [29]. By the above findings, we can infer that inspite of the many studies on association of NC with CVD risk, there are very few studies conducted to define the critical points above which there is increased risk. The best cut off for NC to screen hypertension among adults in the study conducted by Niniya J et al., was 36.5 cm and 33.5 cm in males and females respectively [13].
Our study has used the cut off of W:H ratio specific to Asian Indian population and calculated the respective critical points for NC which is first of its kind. Strength to be noted that our study was a community based study.
Limitation
We could not include other cardiovascular risk factors like blood pressure, lipid profile parameters etc., into consideration which would have added up to more precise results. Confounding factors like age, gender, body mass index etc., have not been considered for adjustment in ROC analysis.
Conclusion
NC was found to be positively correlated with W:H ratio. Further, our study added to knowledge of association of NC with cardiovascular risk. We also defined the cut off points for NC in males and females to screen for CVD risk. NC can be used as an alternative to WC, HC and W:H ratio in screening the CVD risk among adults in Indian population. Multicentric studies have to be conducted to find out more precise cut offs for NC among different ethnic groups and geographical areas. We recommend NC to be used in screening of adults for cardiovascular risk by frontline workers in the primary health care, which will ease the process of referral from the periphery to higher setup. Thus aiding in early diagnosis of cardiovascular risk factors and further patient management.
@-in centimetres, *-Significant, n-Number, %-Percentage, SD-Standard deviation, a-Chi square test, b-Unpaired t-test.
a-Unpaired t-test; SD-Standard Deviation, *-Significant
r-Pearson’s correlation coefficient, *-Significant