Carotid atherosclerosis leading to stroke is one of the major causes of morbidity in the United States [1,2]. Atherosclerosis disease damages the endothelium and narrows the arteries, hampering oxygenated blood flow [3]. Over time, this blockage can rupture, causing a stroke. To identify the plaque burden in these carotid arteries, ultrasonography examinations are preferred as per the guidelines of American Society of Echocardiography (ASE) [4]. Ultrasound based measurements are: safe, have low acquisition time, provide real-time data, and are fairly economical [5]. Due to harmonic and compound imaging features present in ultrasound (US), high-resolution B-mode grayscale scans can be acquired which allows the visualisation of carotid walls. As a result, it is possible to manually trace the Lumen-Intima (LI) and Media-Adventitia (MA) borders and measure the distance between them, so called cIMT [6]. cIMT has become one of the most widely used biomarkers for risk of stroke and cardiovascular diseases [5,7-14].
Manual cIMT measurements are tedious and prone to errors. Further, these measurements are subject to intra- and inter-observer variability [15]. Several studies affirm the requirement for an automated system for cIMT computation [12,13]. Recent studies have proposed automated cIMT computation methods, but they still suffer from low reproducibility and lack standardisation towards clinical trials [10,15-21] . These automated systems need to ensure the consistency and reliability in their measurements [15,17].
Recently Saba L et al., have proposed an initial design of AtheroCloud, a cloud-based, smart cIMT measurement tool for stroke/cardiovascular risk assessment and risk stratification [22]. The workflow for such a cloud-based automated cIMT measurement system is shown in [Table/Fig-1a]. Retrospective B-mode scans are seldom in non-Digital Imaging and Communications in Medicine (DICOM) format which causes a loss in calibration (or resolution) factors. This puts a constraint on the reliability of the cloud-based automated cIMT measurement system. The novelty of this study is to demonstrate the intra and inter-operator reproducibility for cloud-based automated cIMT measurement system. Further, we hypothesise that even a novice operator can yield high reproducibility when computing cIMT readings.
Materials and Methods
Patient Selection
In this study, the data contains a randomly selected set of 100 patients from a pool of 200 patients, acquired from July 2009 to December 2010. The reason for selecting a limited population is to avoid manual tracings on 200 more images which is expensive, tedious, and time-consuming. These patients went through the carotid US for both left and right neck and were retrospectively analysed. The study was institutional review board approved and the images were anonymised. Written informed consent was also provided by all the patients.
Ultrasound Data Acquisition
Carotid ultrasonographic examinations were performed using a scanner (Aplio XV, Aplio XG, Xario, Toshiba, Inc., Tokyo, Japan) equipped with a 7.5 MHz linear array transducer. The average calibration factor for carotid B-mode US scans was 0.0529 mm/pixel. All US scans were performed by a skilled sonographer. The B-mode US scans were supplied by the hospital in non-DICOM format having 10 mm white markers on the left sides of the US scan (see, marked as 1 and 2) [Table/Fig-1b].
Patient Demographics and Far Wall Characteristics
The study sample contains 100 patients with 75 males; mean age 68±11 years, range 29-88 years. These patients have a mean HbA1c, Low-Density Lipoproteins (LDL), High-Density Lipoproteins (HDL), and total cholesterol of: 6.40±1.2, 104.60±30.4, 51.5±15.9, and 179.40±35.4 (mg/dL), respectively. In the current population, 53 patients had proximal lesion location, 27 at middle and 20 at a distal location, and 39 were smokers. The grayscale wall characteristics of these diabetic patients showed mild 10% stenosis [23-25].
Intra and Inter-operator cIMT Reproducibility Analysis
Two different novice operators measured the average cIMT by using the dedicated AtheroCloud software system. A sample view of the AtheroCloud software is shown in [Table/Fig-1b]. Average cIMT was measured in this study since, it is the most effective biomarker for estimating the plaque burden [9,23]. Average cIMT was computed using Suri’s bidirectional polyline distance method, which is a well-established standardised approach [26,27]. This method computes the average of the shortest distances from one interface (say LI wall) to another interface (say MA wall) and vice-versa. This shortest distance is the perpendicular distance from every point on the interface to the opposite polyline on the other interface. The polyline is a segment which joins two neighbouring points on the opposite interface [26,27]. Since, our study population contained mild stenosis, maximum cIMT was not used [28].
While performing the intra and inter-operator reproducibility analysis, the operators manually computed the calibration of the US scans by calculating the pixel to mm resolution. Each of the two novice operators carried out the analysis three times and no manual adjustments on the LI/MA interfaces were performed.
Intra and Inter-observer cIMT Variability Analysis
For validation of the reproducibility analysis, one requires the manual or expert readings. All the manual measurements were conducted using the same AtheroCloud software. The observers looked for the gradient changes at the LI and MA interfaces. The starting brightness of the adventitia layer was used as the border between media layer and adventitia layer, so called MA interface. Corresponding, the gradient change between lumen region and intima layer was used for delineating the LI interface. For US scans that had focal thickening, i.e., cIMT greater than 1.5 mm, the observer could zoom into the region of interest for better visualisation [4]. Both the observers manually traced the LI/MA borders at two separate times. Note that to avoid any biasing all the analysis was repeated with a gap of one month with operators and observers blinded to each other.
Preparation for LI/MA Interfaces
The following standard approach was adapted for LI/MA interface preparations for ensuring the unbiased results [22]. The automated and manually delineated LI/MA interfaces had a common support (same length). The LI/MA interface was further smoothed using B-spline software and equal distance sampling (100 equal distance interpolated points) was also performed.
Statistical Analysis
Five kinds of statistical analysis were performed using MedCalc 16.8.4 software (Osteen Belgium). Since, we had more than 30 samples, two-tailed z-test was used. Mann-Whitney and chi-square test were performed to identify significance difference and relationship between the variables, respectively. Kolmogorov-Smirnov test and ANOVA tests were also conducted to evaluate the distribution of automated and manual readings as continuous variables. A level of 5% statistical significance was used throughout this study.
Results
Intra-/Inter-Operator Reproducibility of Cloud-based Automated System
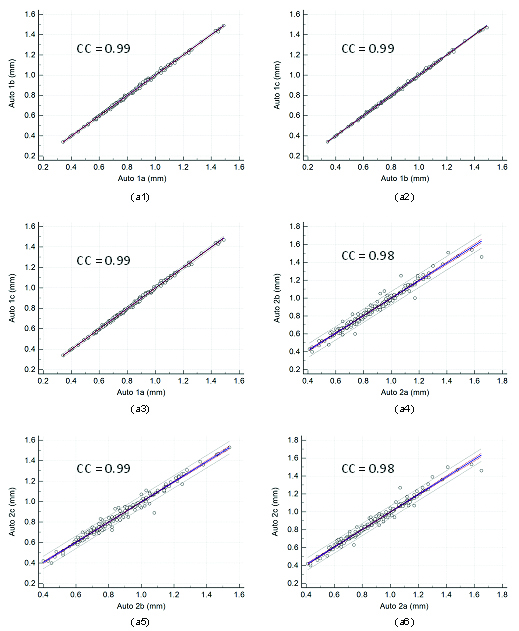
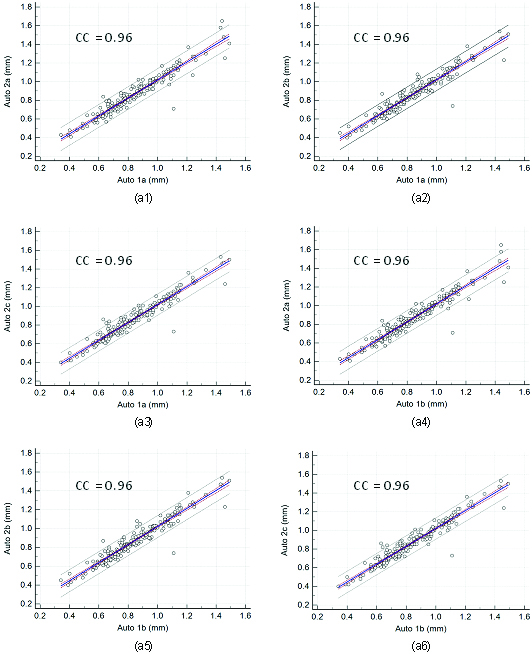
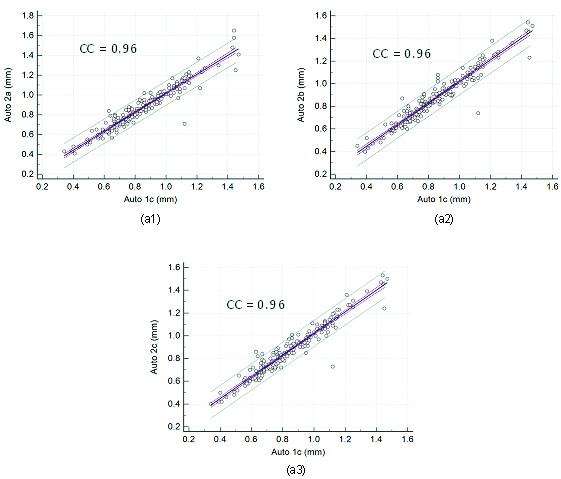
The [Table/Fig-2] shows the results of the intra and inter-operator reproducibility of the auto cIMT computed between all the three automated reading pairs. Our observations show that the mean correlation coefficient for intra/inter-operator reproducibility is close to 1.0 (p<0.001), demonstrating high statistical significance. This proves our hypothesis that even a novice operator can yield high reproducibility when computing automated cIMT readings. The regression plots for intra and inter-operator reproducibility are shown in [Table/Fig-3,4 and 5], respectively.
Regression plots for intra-operator reproducibility. Figure a1, a2, a3, a4, a5, and a6 shows regression plot between (Auto 1a-Auto 1b), (Auto 1b-Auto 1c), (Auto 1a-Auto 1c), (Auto 2a-Auto 2b), (Auto 2b-Auto 2c), and (Auto 2a-Auto 2c) of cIMT measurements using AtheroCloud software.
| Combinations | Correlation coefficient (CC) |
|---|
| Reproducibility (Intra-operator)–6 combinations |
| Auto 1a vs. Auto 1b | CC=0.99 (p<0.001) |
| Auto 1b vs. Auto 1c | CC=0.99 (p<0.001) |
| Auto 1a vs. Auto 1c | CC=0.99 (p<0.001) |
| Auto 2a vs. Auto 2b | CC=0.98 (p<0.001) |
| Auto 2b vs. Auto 2c | CC=0.99 (p<0.001) |
| Auto 2a vs. Auto 2c | CC=0.98 (p<0.001) |
| Reproducibility (Inter-operator)–9 combinations |
| Auto 1a vs. Auto 2a | CC=0.96 (p<0.001) |
| Auto 1a vs. Auto 2b | CC=0.96 (p<0.001) |
| Auto 1a vs. Auto 2c | CC=0.96 (p<0.001) |
| Auto 1b vs. Auto 2a | CC=0.96 (p<0.001) |
| Auto 1b vs. Auto 2b | CC=0.96 (p<0.001) |
| Auto 1b vs. Auto 2c | CC=0.96 (p<0.001) |
| Auto 1c vs. Auto 2a | CC=0.96 (p<0.001) |
| Auto 1c vs. Auto 2b | CC=0.96 (p<0.001) |
| Auto 1c vs. Auto 2c | CC=0.96 (p<0.001) |
| Variability (Intra-observer)–2 combinations |
| Manual 1a vs. Manual 1b | CC=0.92 (p<0.001) |
| Manual 2a vs. Manual 2b | CC=0.97 (p<0.001) |
| Variability (Inter-observer)–4 combinations |
| Manual 1a vs. Manual 2a | CC=0.93 (p<0.001) |
| Manual 1a vs. Manual 2b | CC=0.92 (p<0.001) |
| Manual 1b vs. Manual 2a | CC=0.98 (p<0.001) |
| Manual 1b vs. Manual 2b | CC=0.96 (p<0.001) |
Correlation coefficient for the reproducibility of AtheroCloud system and observer variability of manual tracings.
Regression plots for inter-operator reproducibility. Figure a1, a2, a3, a4, a5, and a6 shows regression plot between (Auto 1a-Auto 2a), (Auto 1a-Auto 2b), (Auto 1a-Auto 2c), (Auto 1b-Auto 2a), (Auto 1b-Auto 2b), and (Auto 1b-Auto 2c) of cIMT measurements using AtheroCloud software.
Regression plots for inter-operator reproducibility. Figure a1, a2, and a3 shows regression plot between (Auto 1c-Auto 2a), (Auto 1c-Auto 2b), and (Auto 1c-Auto 2c) of cIMT measurements using the AtheroCloud software.
Intra-/Inter-observer Variability for Validation of Cloud-based Automated System
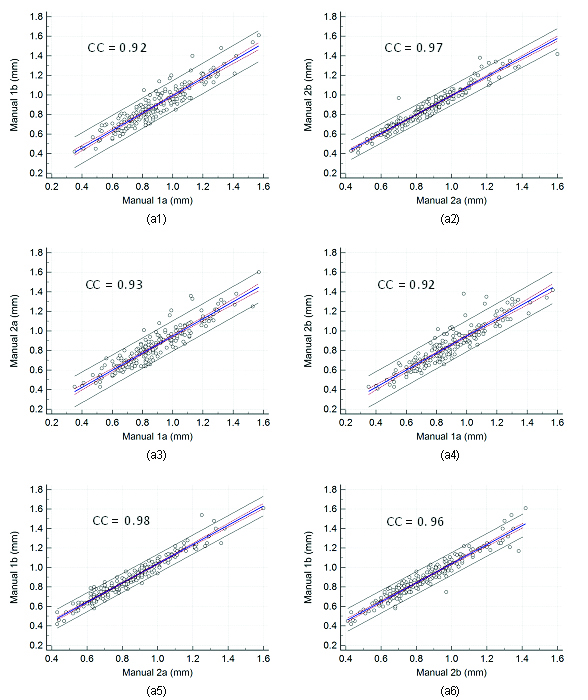
The [Table/Fig-3] also shows the results of the intra and inter-observer variability of the manual LI/MA delineations between two manual reading pairs. Even though, the mean correlation coefficient for intra and inter-observer variability is significantly high, one should note that wherever observer one is involved, the inter-observer analysis has slightly lower (up to 5%) correlations. This is because observer one was less experienced as compared to observer two [29,30]. The corresponding regression plots for intra and inter-observer variability is shown in [Table/Fig-6], respectively.
Regression plots for intra and inter-observer variability. Figure a1, a2 shows regression plot for intra-observer variability between (Manual 1a-Manual 1b), (Manual 2a- Manual 2b), and figure a3, a4, a5, and a6 for inter-observer variability between (Manual 1a- Manual 2c), (Manual 1b- Manual 2a), (Manual 1b- Manual 2b), and (Manual 1b- Manual 2c) of cIMT measurements using AtheroCloud software.
Performance based on Bland-Altman Plots
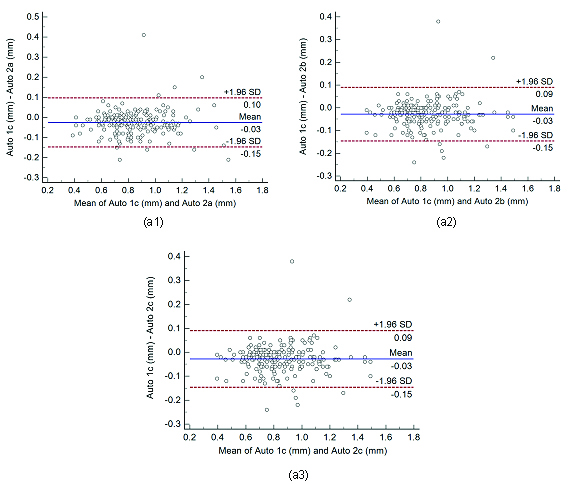
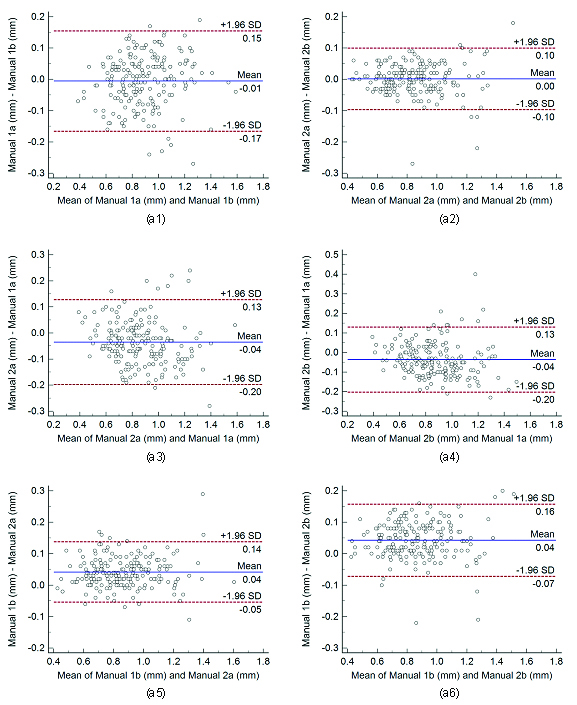
We have evaluated both intra and inter-operator reproducibility and intra and inter- observer variability by analysing 21 (15 reproducibilities and 6 variabilities) Bland-Altman plots. The Bland-Altman plots for; a) intra-operator reproducibility are shown in [Table/Fig-7] and b) inter-operator reproducibility are shown in [Table/Fig-8] and [Table/Fig-9], respectively. Similarly, Bland-Altman plot for c) intra-observer variability and d) inter-observer variability of cIMT measurements is shown in [Table/Fig-10], respectively. Results show a high degree of agreement between auto and manual cIMT readings.
Bland-Altman plots for intra-operator reproducibility. Figure a1, a2, a3, a4, a5, and a6 shows Bland-Altman plot between.
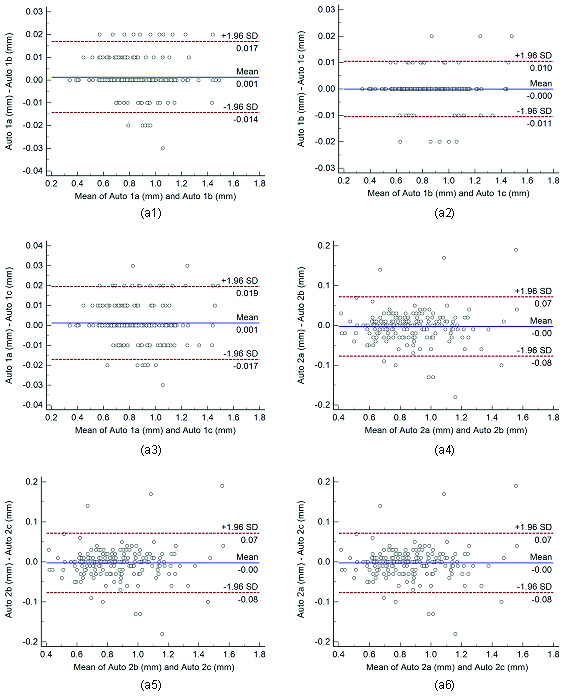
Bland-Altman plots for inter-operator reproducibility. Figure a1, a2, a3, a4, a5, and a6 shows Bland-Altman plot between.
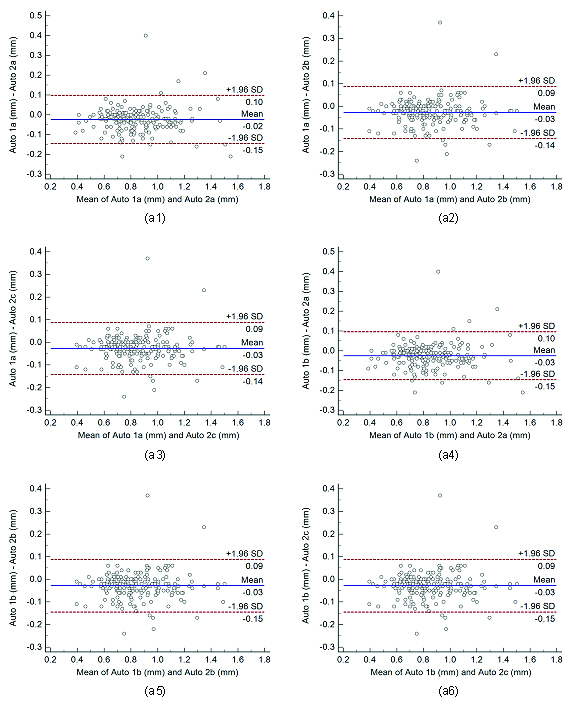
Bland-Altman plots for inter-operator reproducibility. Figure a1, a2, and a3 shows Bland-Altman plot between.
Bland-Altman plots for intra and inter-observer variability. Figure a1, a2 shows Bland-Altman plot for intra-observer variability between (Manual 1a-Manual 1b), (Manual 2a- Manual 2b), and figure a3, a4, a5, and a6 for inter-observer variability between (Manual 1a- Manual 2c), (Manual 1b- Manual 2a), (Manual 1b- Manual 2b), and (Manual 1b- Manual 2c) of cIMT measurements using AtheroCloud software.
Performance Evaluations based on Error Metrics
Four kinds of performance parameters are computed such as: i) mean absolute difference; ii) mean absolute error; iii) Precision-of-Merit, and iv) Figure-of-Merit which are mathematically expressed as shown in Eq. (A3), (A4), (A5) and (A8) (Appendix A) and their corresponding results are shown in [Table/Fig-11]. For all the automated combinations, lowest mean absolute difference and mean absolute error along with highest Precision-of-Merit and Figure-of-Merit are observed for manual 2. This is because manual 2 is more qualified as compared to manual 1.
Performance of AtheroCloud cIMT readings: MAD, MAE, PoM, FoM, and AUC.
| Mean absolute difference (MAD) |
|---|
| Manual 1a | Manual 1b | Manual 2a | Manual 2b | Average of Manuals |
|---|
| Auto 1a | 0.08±0.06 | 0.07±0.06 | 0.06±0.05 | 0.06±0.05 | 0.06±0.05 |
| Auto 1b | 0.09±0.06 | 0.07±0.06 | 0.06±0.05 | 0.06±0.05 | 0.06±0.05 |
| Auto 1c | 0.09±0.06 | 0.07±0.06 | 0.06±0.05 | 0.06±0.05 | 0.06±0.05 |
| Auto 2a | 0.07±0.06 | 0.05±0.04 | 0.05±0.04 | 0.05±0.04 | 0.04±0.04 |
| Auto 2b | 0.07±0.05 | 0.05±0.04 | 0.04±0.04 | 0.05±0.04 | 0.04±0.03 |
| Auto 2c | 0.07±0.05 | 0.05±0.04 | 0.04±0.04 | 0.05±0.04 | 0.04±0.03 |
| Average of Autos | 0.07±0.05 | 0.05±0.04 | 0.04±0.04 | 0.05±0.04 | 0.04±0.03 |
| Mean absolute error (MAE) |
| Auto 1a | 9.59±6.86 | 8.01±6.71 | 6.72±6.26 | 6.81±6.30 | 6.56±5.82 |
| Auto 1b | 9.65±6.91 | 8.05±6.80 | 6.74±6.28 | 6.89±6.32 | 6.63±5.88 |
| Auto 1c | 9.65±6.92 | 8.04±6.88 | 6.77±6.35 | 6.96±6.35 | 6.65±5.95 |
| Auto 2a | 8.08±6.68 | 5.79±4.80 | 5.62±5.06 | 5.81±4.75 | 4.71±4.25 |
| Auto 2b | 7.79±6.39 | 5.43±4.05 | 5.44±4.60 | 5.56±4.38 | 4.29±3.71 |
| Auto 2c | 7.79±6.38 | 5.43±4.04 | 5.44±4.59 | 5.56±4.37 | 4.29±3.70 |
| Average of Autos | 8.24±6.16 | 6.22±4.93 | 5.42±4.67 | 5.60±4.56 | 4.96±3.86 |
| Mean Precision of Merit (PoM) |
| Auto 1a | 90.44±6.86 | 91.99±6.71 | 93.28±6.26 | 93.19±6.30 | 93.44±5.82 |
| Auto 1b | 90.35±6.91 | 91.95±6.80 | 93.26±6.28 | 93.11±6.32 | 93.37±5.88 |
| Auto 1c | 90.35±6.92 | 91.96±6.88 | 93.23±6.35 | 93.04±6.35 | 93.35±5.95 |
| Auto 2a | 91.92±6.68 | 94.21±4.80 | 94.38±5.06 | 94.19±4.75 | 95.29±4.25 |
| Auto 2b | 92.21±6.39 | 94.57±4.05 | 94.56±4.60 | 94.44±4.38 | 95.71±3.71 |
| Auto 2c | 92.20±6.38 | 94.56±4.04 | 94.55±4.59 | 94.43±4.37 | 95.70±3.70 |
| Average of Autos | 91.76±6.16 | 93.78±4.93 | 94.58±4.67 | 94.40±4.56 | 95.04±3.86 |
| Mean Central Difference/Mean Figure of Merit (FoM) |
| Auto 1a | 95.43 | 95.80 | 99.45 | 99.54 | 97.52 |
| Auto 1b | 95.29 | 95.66 | 99.30 | 99.39 | 97.37 |
| Auto 1c | 95.29 | 95.66 | 99.31 | 99.39 | 97.38 |
| Auto 2a | 98.18 | 98.56 | 97.68 | 97.60 | 99.67 |
| Auto 2b | 98.54 | 98.93 | 97.30 | 97.22 | 99.30 |
| Auto 2c | 98.53 | 98.92 | 97.29 | 97.21 | 99.29 |
| Average of Autos | 96.88 | 97.26 | 99.04 | 98.95 | 99.00 |
| Area under the curve (AUC) |
| Auto 1a | 0.956 | 0.968 | 0.969 | 0.964 | NA |
| Auto 1b | 0.956 | 0.968 | 0.972 | 0.965 | NA |
| Auto 1c | 0.955 | 0.967 | 0.971 | 0.964 | NA |
| Auto 2a | 0.967 | 0.984 | 0.981 | 0.979 | NA |
| Auto 2b | 0.970 | 0.988 | 0.980 | 0.987 | NA |
| Auto 2c | 0.970 | 0.988 | 0.980 | 0.987 | NA |
| Average | 0.962 | 0.977 | 0.976 | 0.974 | NA |
| SD | 0.01 | 0.01 | 0.01 | 0.01 | NA |
Performance based on Receiver Operating Characteristic Analysis
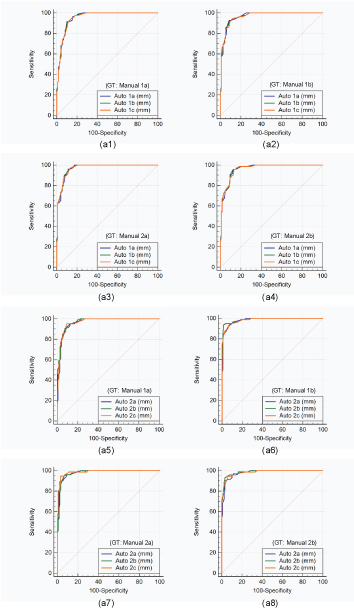
The receiver operating characteristic analysis was performed on auto against the manual measurements. Since, two operators underwent the cIMT readings three times, there are two sets of the operators’ combinations: (auto 1a, 1b, 1c) and (auto 2a, 2b, 2c). There are four manual readings, taken from two manual observers who perform LI/MA tracings two times (manual 1a, 1b, 2a, 2b). The [Table/Fig-12] shows eight combinations. The first four curves [Table/Fig-12] (a1), (a2), (a3), and (a4) are drawn for first operator combination (auto 1a, 1b, 1c) and next four curves [Table/Fig-12] (a5), (a6), (a7), and (a8) are drawn for the second operator combination (auto 2a, 2b, 2c) taking the four ground truths (manual 1a, 1b, 2a, 2b), respectively. Using the cIMT risk threshold of 0.9 mm, the area under the curve for all the auto combinations can be seen in [Table/Fig-11] [21]. We detected a high area under the curve for all the possible combinations.
Colour image shows eight comparative receiver operating characteristic curves. The first four curves (Figure. 6 (a1), (a2), (a3), and (a4)) are drawn for first operator combination (Auto 1a, 1b, 1c) and next four curves (Fig. 6 (a5), (a6), (a7), and (a8)) are drawn for the second operator combination (Auto 2a, 2b, 2c) taking the four ground truths (Manual 1a, 1b, 2a, 2b), respectively.
Five Statistical Tests
The results of three tests (z-test, chi-square test, and Mann-Whitney) are shown in [Table/Fig-13]. In one-way ANOVA test, the f-value is obtained as 1.21 which is lower than the critical value of (f=1.88) confirming the paired samples to pass the one-way ANOVA test. The normal distribution for the entire auto readings and manual readings are greater than 0.05 confirming the paired samples to pass the Kolmogorov-Smirnov test.
Three statistical tests (z-test, chi-square test, and Mann-whitney test) for AtheroCloud cIMT intra and inter-reproducibility and cIMT intra and inter-observer variability.
| Combinations | Two-tailed z-test | Chi-squared-test | Mann-whitney |
|---|
| z | p-value | Contingency coefficient | p-value | p-value |
|---|
| Reproducibility (Intra-operator)–6 combinations |
| Auto 1a vs. Auto 1b | 0.0604 | <0.9518 | 0.990 | <0.001 | 0.9393 |
| Auto 1b vs. Auto 1c | 0.0046 | <0.9963 | 0.992 | <0.001 | 0.9931 |
| Auto 1a vs. Auto 1c | 0.0558 | <0.9555 | 0.989 | <0.001 | 0.9465 |
| Auto 2a vs. Auto 2b | 0.1493 | <0.8813 | 0.986 | <0.001 | 0.8920 |
| Auto 2b vs. Auto 2c | 0.0422 | <0.9664 | 0.987 | <0.001 | 0.9921 |
| Auto 2a vs. Auto 2c | 0.1076 | <0.9144 | 0.987 | <0.001 | 0.9105 |
| Reproducibility (Inter-operator)–9 combinations |
| Auto 1a vs. Auto 2a | 1.1220 | <0.2619 | 0.986 | <0.001 | 0.2387 |
| Auto 1a vs. Auto 2b | 1.2739 | <0.2027 | 0.986 | <0.001 | 0.1878 |
| Auto 1a vs. Auto 2c | 1.2345 | <0.2170 | 0.987 | <0.001 | 0.1801 |
| Auto 1b vs. Auto 2a | 1.1808 | <0.2377 | 0.986 | <0.001 | 0.2146 |
| Auto 1b vs. Auto 2b | 1.3327 | <0.1826 | 0.986 | <0.001 | 0.1697 |
| Auto 1b vs. Auto 2c | 1.2935 | <0.1959 | 0.987 | <0.001 | 0.1659 |
| Auto 1c vs. Auto 2a | 1.1765 | <0.2394 | 0.986 | <0.001 | 0.2201 |
| Auto 1c vs. Auto 2b | 1.3284 | <0.1841 | 0.986 | <0.001 | 0.1709 |
| Auto 1c vs. Auto 2c | 1.2891 | <0.1974 | 0.987 | <0.001 | 0.1691 |
| Variability (Intra-observer)–2 combinations |
| Manual 1a vs. Manual 1b | 0.2600 | <0.7948 | 0.986 | <0.001 | 0.8106 |
| Manual 2a vs. Manual 2b | 0.1220 | <0.9731 | 0.987 | <0.001 | 0.9790 |
| Variability (Inter-observer)–4 combinations |
| Manual 1a vs. Manual 2a | 1.6667 | <0.0956 | 0.986 | <0.001 | 0.0871 |
| Manual 1a vs. Manual 2b | 1.6995 | <0.0892 | 0.986 | <0.001 | 0.0781 |
| Manual 1b vs. Manual 2a | 1.5462 | <0.0488 | 0.986 | <0.001 | 0.1081 |
| Manual 1b vs. Manual 2b | 1.5800 | <0.1141 | 0.986 | <0.001 | 0.1006 |
Discussion
Our System
The objective of this study was to demonstrate the intra-and inter-operator reproducibility for cloud-based automated cIMT measurement system using novice operators. For validation of reproducibility analysis, we compare the automated readings against the expert reading via manual delineation of LI/MA interfaces. Further, we performed intra and inter-observer variability analysis of the expert readings.
Benchmarking against Current Literature
A review of previous studies for intra and inter-operator reproducibility of cIMT detection techniques is summarised in [Table/Fig-14]. Most of the previous studies used semi-automated method for cIMT measurements, unlike our paradigm which was completely automated. Second, our software system was designed for cloud or web-based settings, unlike other techniques which were desktop-based. Third, most of the studies either did reproducibility or variability, while we demonstrated both reproducibility and variability analysis. Lastly, the fundamental bidirectional distance measurement design for cIMT measurement is accurate, reliable and well published.
Benchmarking table against our proposed study.
| C1 | C2 | C3 | C4 | C5 | C6 | C7 | C8 |
|---|
| Authors | Data Size (Patients) | Rep/Var | Product/Vendor | Number of Tracers | Results | Auto/Semi-auto | Cloud-based |
|---|
| Singh Ket al., [16] | 59 | Var | CT/Philips | 3 | LV | Auto | X |
| Saba Let al., [8] | 35 | Rep | MDCTA/Philips | 4 | HR | Auto | X |
| Saba Let al., [15] | 50 | Var | AtheroEdge/AtheroPoint | 3 | LV | Auto/Semi-auto | X |
| Nichols Set al., [18] | 50 | Var | Panasonic/CardioHealth Station | 2 | AV | Auto | X |
| McCloskey Ket al., [19] | 20-30 | Rep | Vivid I/GE | 2 | HR | Auto | X |
| Tierney ESet al., [20] | 61-123 | Rep | L11-3/Philips | 4 | HR | Semi-auto | X |
| Proposed | 100 | Rep/Var | AtheroCloud/AtheroPoint | 3/2 | HR and LV | Auto/Semi-auto | ✓ |
Repro-Reproducibility, Var-Variability, CT-Computed tomography, MDCTA-Multidetector row CT angiography, LV-Low variability, HR-High reproducibility, AV-Acceptable variability, VA-Variable agreement
A Note on Agreement Between Observer’s Measurements
The Bland-Altman plots show good concordance for intra and inter-observer cIMT reproducibility and variability measurements with a systematic error limit (1.96 standard deviations of the mean difference). The mean bias between the first and the final 50 patients for both manual observers was consistently reduced. The reduction in manual bias was 0.0690 mm to 0.0677 mm for manual 1 and 0.0365 mm to 0.0354 mm for manual 2, respectively. Our results are in concordance with Vanoli D et al.,’s findings that observer’s experience does improve short-term measurement variability [31].
Limitation
While performing the manual delineations we did not investigate the effect of usage of different computers, time of the day, observer fatigues, and his mood conditions [32]. These are beyond the scope of this pilot study. In future, like a common carotid artery, one can evaluate the internal carotid artery.
Conclusion
AtheroCloud software showed an excellent intra and inter-operator reproducibility agreement towards cIMT measurements. The comprehensive statistical analysis showed consistency and reliability. Our study also showed a decrease in intra-observer variability measurements with an increase in the experience of our novice observers. The encouraging results of this pilot study showed that the system can be adopted in the clinical setting in routine and/or multicenter pharmaceutical trial modes.
Conflict of Interest
Dr. Jasjit S. Suri has a relationship with AtheroPoint™, Roseville, CA, USA which is dedicated to Atherosclerosis Disease Management, including Cerebrovascular and Cardiovascular imaging.
Disclaimer
The data used in this work is IRB approved and Jasjit S Suri (PI of this work) will stand as the guarantor of the dataand statistics used.