Ovulatory disorder accounts for approximately 30% of the causes of female infertility [1]. Reproductive ageing is described as the reduction in the quality and quantity of the ovarian follicular pool and it may vary in the same chronological age groups [2-4]. Ovarian reserve describes the number and quality of the remaining ovarian follicular pool. Number of methods have now been described to identify individuals at risk for Decreased Ovarian Reserve (DOR) [5-7]. These tests not only aids in diagnosis of DOR, but also predict the response to gonadotropin stimulation.
Ovarian reserve tests include both biochemical {Follicle Stimulating Hormone (FSH), estradiol, inhibin B, AMH etc.,} and ultrasonographic parameters like AFC and BOV measured on day two or three of the menstrual cycle. AFC is the total number of follicles measuring 2-10 mm in both ovaries.
BOV is the sum of individual volumes of both ovaries. Ovarian volume (length×width×depth×0.52) decreases with progressive follicular depletion and shows a high interobserver variability [8]. A low ovarian volume has high specificity (80-90%) and widely ranging sensitivity (11-80%) for predicting poor response to ovarian stimulation. Adibi A et al., showed the sensitivity of 52% and specificity of 69% (higher than AFC) for BOV as a marker of ovarian response to stimulation [9]. None of the tests available for ovarian reserve has a 100% sensitivity or specificity. The present study, shows an age related trend as well as correlation of BOV with AFC in fertile and infertile patient groups. An attempt was also made to predict a cutoff value of BOV for prediction of ovarian reserve.
Materials and Methods
This case control study was approved by the Institutional Review Board and written informed consent obtained from all the participants. The present study was conducted from January 2014 to March 2015.
Cases were acquired from the females presenting with complaints of infertility or undergoing any assisted treatment; reporting to the Department of Radiology for regular follicular monitoring. Similar number of controls were also enrolled among the healthy females of the same age group, referred for an unrelated problem or check up.
Cases were enrolled in the study protocol if they met all of the following criteria: (i) primary infertility, (ii) no ovarian abnormality (polycystic ovary, solid or cystic ovarian mass) as assessed by transvaginal Ultrasonography (USG), (iii) no evidence of uterine malformations, (iv) no evidence of endocrinological disease. Controls were enrolled on the basis of the following criteria: (i) proven single or multiple natural fertility carried to term, (ii) no evidence of endocrinological disease, (iii) no evidence of ovarian surgery/abnormality and (iv) hormonal contraception stopped for more than two months before entering the study protocol. Clinical data with hormonal assays of the infertile group were recorded.
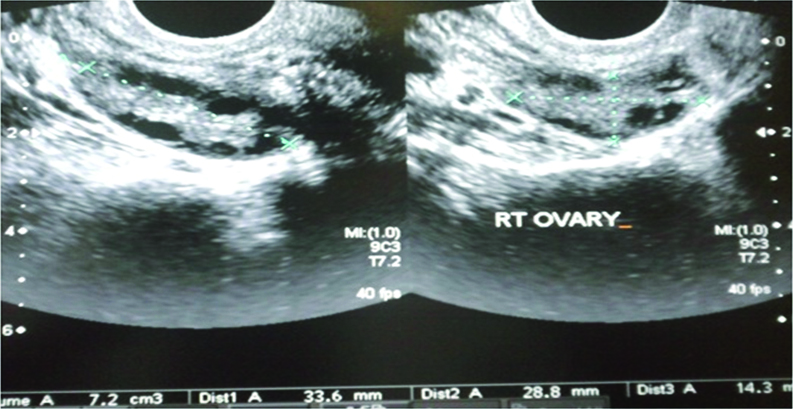
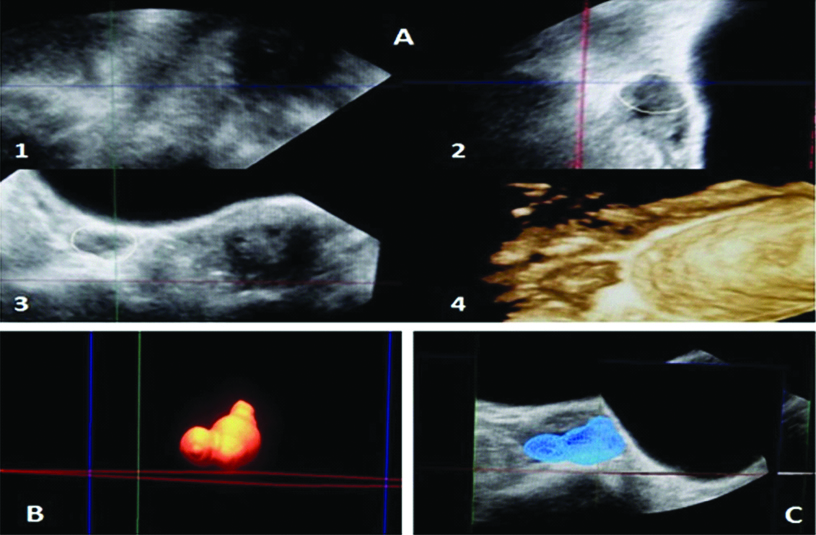
Baseline scan of the ovaries was done on day two and three of the menstrual cycle transvaginally using 7.5 MHz transducer of iU-22; Philips Medical System (Andover, MA, USA). A single radiologist performed all the scans to exclude interobserver variation. The transducer was swiped from right to left and ovary was observed from outer to inner margin for its complete assessment. [7,10]. Two Dimensional (2-D) volume of both ovaries was measured on day two or three of the menstrual cycle [Table/Fig-1]; using all three orthogonal planes and added to give (BOV) [11]. Three Dimensional (3D) volume calculations were performed using Virtual Organ Computer-Aided Analysis (VOCAL) which conducts 3-D rotational measurements of the ovarian volume on incremental rotations in both longitudinal and short axis [Table/Fig-2].
Transvaginal USG of right ovary showing 2D measurement of ovarian volume in two orthogonal planes.
Transvaginal USG of right ovary showing 3D measurement of ovarian volume; A) Showing images in three orthogonal planes (1,2,3) with 3D reconstruction of the ovary (4) using the manual mode of tracing the ovarian contour at incremental rotation of 15 degrees; B) Volume rendered image of ovary and C) Surface rendered image in mesh pattern using the VOCAL software.
Statistical Analysis
Statistical analysis was performed by using IBM SPSS statistics for Windows (version 16.0; SPSS, Inc., Chicago, IL, USA). Comparison between group variables was performed by Student’s t-test and Mann-Whitney U test. The correlations between age and the sonographic parameters in fertile and infertile patients were framed as a correlation matrix. Correlations were determined by Pearson rank correlation coefficient (r-value). Chi-square test was used for non parametric variables. For all statistical analysis, p-value <0.05 was considered as significant.
Results
The mean age of cases and controls was 26.5 years with the similar biophysical profile; thus, excluding the confounding factors. The 30% of all the patients (involving cases and controls) were under 25 years of the age and 70% of them were above 25 years of the age.
There was no significant difference in the mean ovarian volume in both the groups (Cases-12.5±6.279 while Controls-11.0±5.280) with p-value of 0.433. The total ovarian volume was segregated into two broad groups with cutoff value of 12cc [Table/Fig-3]. The data indicates that there are almost equal number of the cases with BOV above and below the cutoff; thus, highlighting the weakness of ovarian volume in prediction of successful pregnancy on its own.
Distribution of total basal ovarian volume in both groups (n=30).
| BOV | Cases | Controls |
|---|
| No. | % | No. | % |
|---|
| <12 cc | 14 | 46.7 | 20 | 66.7 |
| >12 cc | 16 | 53.3 | 10 | 33.3 |
| Total | 30 | 100 | 30 | 100 |
BOV showed a strong and linear correlation (r=0.298 in cases and r=0.406 in controls) with AFC in both the groups of the patients [Table/Fig-4,5]. This can be attributed to the fact that the increase in parenchymal/ovarian stromal volume incorporates more number of the antral follicles within and hence, follows a parallel and linear trend with each other.
Correlation chart of variables in infertile patients.
| Clinical and Sonographic Variable | Statistical Values | Age | Total Basal Ovarian Volume | Antral Follicle Count |
|---|
| Age | r-value | 1 | | |
| p-value | | | |
| Total Basal Ovarian Volume (BOV) | r-value | -0.107 | 1 | |
| p-value | 0.577 | | |
| Antral Follicle Count (AFC) | r-value | -0.545 | 0.298 | 1 |
| p-value | 0.003 | 0.035 | |
Scatter diagrams in fertile group of patients showing correlation of BOV with age and AFC.
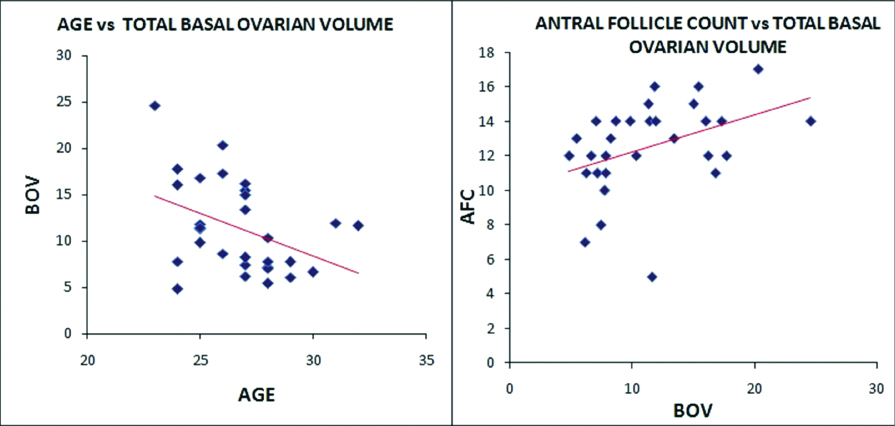
Scatter diagrams for the fertile group (controls) of the patients are showing inverse relation of BOV with increasing patients age (r-value= -0.400 and p-value= -0.028) while the results were not the same in cases (infertile patients) where the BOV was not in line with increasing patient age and showing a weaker correlation (r-value-0.107). Mean values of all the variables of infertile patients were charted in [Table/Fig-6], at BOV cutoff value 12cc. Statistically significant (p-value -0.004) lower antral follicle count was seen in cases with lower basal ovarian volume (≤12cc).
Total BOV relationship in infertile patients with other variables.
| Variables | BOV (≤12cc) (Mean±SD) | BOV(>12cc) (Mean±SD) | Mann-Whitney U (p-value) |
|---|
| Age | 27.00±2.38 | 26.56±3.24 | 0.463 |
| Body Mass Index | 21.37±1.71 | 20.12±1.10 | 0.020 |
| Endometrial Thickness | 4.51±1.51 | 5.38±2.11 | 0.244 |
| Antral Follicle Count | 7.71±4.26 | 11.25±3.19 | 0.004 |
| Day 3 FSH | 14.71±9.28 | 14.62±14.81 | 0.170 |
Discussion
In present clinical and ART practice, ovarian reserve is the basic and most sought after parameter for planning and success of any conception supporting treatment. There is a whole gamut of static and dynamic tests for ovarian pool assessment; however, ovarian volume is the least studied even after being the easiest of all [12]. The reason may be the variation in volume assessment by the different observers and may be due to inherent/acquired condition affecting the ovarian volume.
The concept of ovarian reserve can be correlated well with the histologically proven decline in the few millions of the primordial follicles at birth to 4,00,000 at puberty and ultimately to a critical level at mean age of 45 years, due to continuous follicle wasting throughout reproductive life of a female [13,14].
Few of the studies from recent literature review, have shown that ovarian volume assessment by transvaginal sonography is a marker of ovarian reserve and for clinical pregnancy rate [7,15,16]. In another study, ovarian volume reduction has been confirmed to be an early sign of depletion of the follicular pool [17]. Univariate and multivariate logistic regression of the markers of the ovarian reserve was done in a study by Kwee J et al., which showed AFC having the best predictive variable for ovarian response to ART; however, there was increment in the predictive model from 63% to 72% after adding Inhibin B and BOV in multiple regression [18]. They have stressed upon the fact that, the best prediction model in multivariate analysis is combination of AFC, BOV and Inhibin B; however, AFC is the only reliable test for predicting low and high responders. In present study, BOV was showing parallel trend with AFC and a strong correlation (r=0.295 in cases and r=0.406 in controls) indicating complementary but indecisive role in ovarian reserve testing. Inhibin B was not included in the present study. The recent meta analysis, have also shown that total ovarian volume correlates with outcome measures, but its performance is inferior to the AFC in prediction of poor and high responders [12,18].
Recent study of comparison of the ovarian volume with AFC and endocrine tests has shown 52% sensitivity of the BOV in prediction of the ovarian response after induction with clomiphene, within a given range of BOV (2.6 to 15,25cc) [9]. Regression analysis between the ovarian volume and follicle count showed that an increment of 1 mL in ovarian volume leads to increase in 1.2 follicles.
Various other studies have primarily shown the trend of ovarian volume with increasing age. Scheffer GJ et al., showed decrease in the median value of the BOV (11.8 to 8.3 from 25 to 46 years of age progression) [19]. The r-value for BOV versus age was -0.30, with significant p-value <0.05; however, the mean follicular volume was increasing with age (r=0.37). Another study showed significant difference in the mean value of the BOV in above and below 35 years of the age group females while the mean BOV was insignificant in cases of poor and normal responders in females of both age groups [20]. We have also found a linear and negative correlation of BOV with age in fertile group; while the infertile females showed weaker correlation. Hence, chronological age can be a better approximation of reproductive age in fertile females as compared to the infertile group, probably due to accelerated reproductive ageing in the infertile patients.
Limitation
Few limitations are seen in ovarian volume assessment in cases of Polycystic Ovary Disease (PCOD) and in women on Oral Contraceptive Pills (OCP) as there is increase and decrease in the size of the ovaries respectively. Similarly, there may be variation in the volume measurement which can be overcome to some extent, by automated or 3-D measurements. These limitations were overcome in present study by excluding PCOD and OCP patients and employing VOCAL software for volumetric assessment.
The present study needs to be longitudinal in nature to lay down a protocol for BOV as a reliable marker of ovarian reserve. We need to provide strong evidence of the fact that lower ovarian volume is seen in infertile patients and resulted in poor response to ART stimulation protocols. However, these methods were out of the scope of present study. Another limitation in present study was non inclusion of AMH, which has also proved to be sensitive marker of ovarian reserve; however, it was omitted as it was unjustified to put burden on the control group, reporting to the department for complaint unrelated to fertility [21-23]. Future studies targeting AMH need to be done for further enhancing the predictability of ovarian reserve markers.
An ideal test should be accurate, predictive, objective, reproducible, easily measurable, independent and cost effective. In view of the mentioned criteria, ovarian volume fulfils most of them; however, it may not be accurate and is dependent on other markers. Hence, its role always remains under question, when we compare it to AFC and AMH. The committee opinion on American gynecology practice recommends AMH, AFC and FSH plus estradiol for ovarian reserve assessment; however, none of them is able to predict the outcome of conception [5]. Hence, total ovarian volume can also stand shoulder to shoulder by the side of these recommended markers on account of its ease and supportive role, but not neck and neck due to its less sensitivity and specificity.
Conclusion
In conclusion, the results indicate that BOV is a reliable marker of ovarian reserve on account of its parallel trend with AFC; however, it should not be used as a single viable predictor of fecundity. BOV should not be omitted from the list of ovarian reserve markers on account of its ease of measurement during the standard gynaecological ultrasound. A cutoff value for BOV may be predicted, incorporating a large group of the patients and following them for success or failure in conception.