Cell proliferation is the important factor in determining the behaviour of neoplasms. Mitosis is a process where a cell divides into two daughter cells [1]. The cell undergoes various phases of mitosis like prophase, metaphase, anaphase and telophase; these can be appreciated in the tissue by routine microscope [1]. Increased and abnormal mitotic activity is one of the important features observed in the tissue section for the diagnosis and prognosis of the malignant lesions. Identification and counting of the MFs is an indicator of proliferative activity of neoplastic cells and it has been considered as one of the most reliable prognostic factor in oncology [2,3].
The various abnormal morphological appearance of mitotic defects/activity are nuclear abnormalities like micronuclei, binucleation, pyknosis, broken egg appearance and increased abnormal MFs, which can be seen commonly in OSCC and OED [4].
MFs can be identified by various methods like microscopy, Immunohistochemistry (IHC), morphometry, flow cytometry and nucleotide radiolabelling [5]. Routine stains like H&E stain can be used but the distinction between an apoptotic cell, a pyknotic nucleus and a mitotic cell may be difficult. Special stains like Crystal violet, Giemsa, Toluidine blue, Feulgen have been used for staining MFs in tissues but they are less specific [6]. IHC is an advanced method and staining of MFs with the mitosis-specific antibody anti-PHH3 has been suggested as a promising method for identifying MFs in various carcinomas [7-9].
In the present study, we have compared the IHC expression for MFs using mitotic specific marker anti-PHH3 in OED and OSCC with routine H&E and 1% crystal violet stain.
Materials and Methods
This retrospective study was conducted for a period of six months in the Department of Oral Pathology and Microbiology, Faculty of Dental Sciences, MS Ramaiah University of Applied Sciences, Bangalore. Histopathologically confirmed 30 cases of OED and 30 cases of OSCC were included. 5 confirmed breast carcinoma cases were taken as control. The study was approved by college Ethical Clearance Board (MSRDC/EC/2013-14/). The cases which were confirmed histopathologically with complete patient record were included in the study with exclusion of the cases that had recurrence undergone chemotherapy and radiotherapy. Tissue sections which were too thick, folded or necrosed were also excluded, as individual cells cannot be properly identified in those cases.
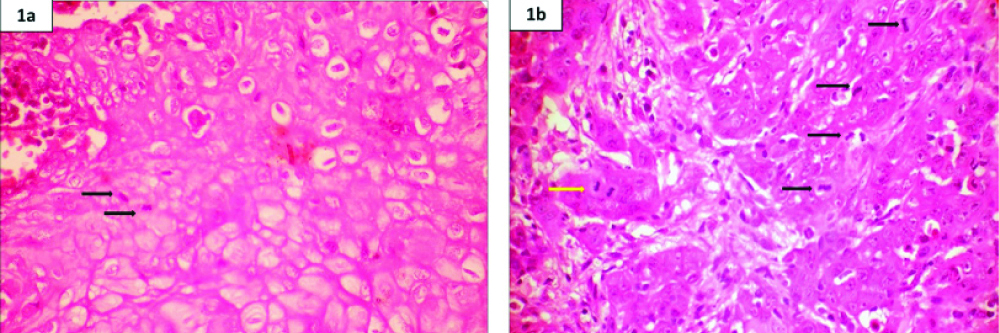
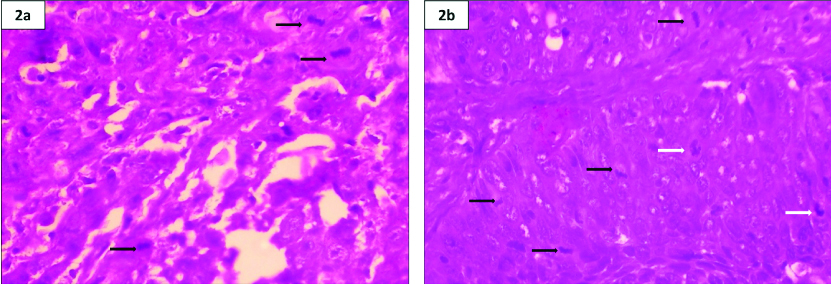
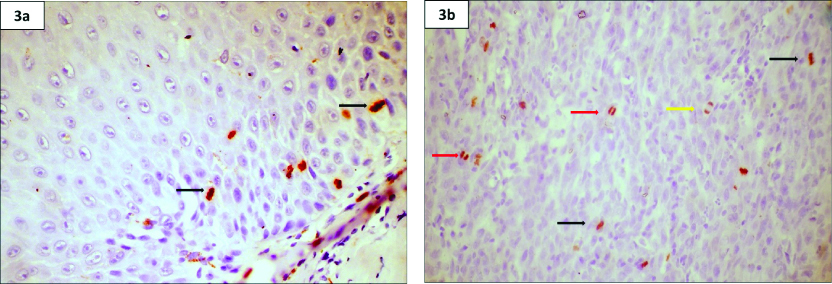
Three sections of 3-4 μ thickness were taken from OED and OSCC cases and stained first with H&E [Table/Fig-1a,b], 1% crystal violet [Table/Fig-2a,b] and lastly anti PHH3 [Table/Fig-3a,b]. In the study sample, in each section, MFs were counted in 10 high power fields (HPFs).
Photomicrograph of H&E stain- a) OED and b) OSCC highlighting MF under 40X magnification
Black colored arrow indicates metaphase, yellow colored arrow indicates anaphase.
Photomicrograph of crystal violet stain- a) OED and b) OSCC highlighting MF under 40X magnification.
White colored arrow indicates prophase, black colored arrow indicates metaphase.
Photomicrograph of anti-PHH3 stain- a) OED and b) OSCC highlighting MF under 40X magnification.
Black colored arrow indicates metaphase, red colored arrow indicates telophase, yellow colored arrow indicates anaphase.
Immunohistochemistry Procedure
A 3-4 μ section of OED and OSCC were first mounted on poly-L-Lysine coated glass slides. After rinsing with two changes of xylene for deparaffinization, the sections were rehydrated with alcohol at different descending concentrations (100%, 85% and 75%). To activate endogenous peroxidase, sections were incubated for five minutes in 3% H2O2 and were then rinsed with Phosphate-Buffered Saline (PBS). Sections were incubated for one hour with monoclonal Anti PHH3 at a dilution of 1:10. Immune complexes were treated with post primary block and then detected by Novolink polymer for 30 minutes at room temperature. After rinsing with PBS, the immunoreactivity was visualized by Diaminobenzidine. The anti PHH3 stained slides were later dried and mounted.
MFs were identified by criteria given by Van Diest P et al., [3]:
a) Absence of nuclear membrane which indicates the cells have passed through prophase;
b) Beginning of metaphase seen as clear, clotted hairy extension of nuclear material, seen in a plane form in metaphase/ anaphase stage or as separate clots in telophase stage;
c) Separate mitosis which is seen as two separate parallel chromosome clots are to be counted individually.
Following the above mentioned criteria, the stained sections were evaluated for MFs and counted under 10 random HPFs by two pathologists.
Statistical Analysis
Data analysis was carried out using Statistical Package for Social Science (SPSS, version 10.5) package. The data were analysed using Chi-square test and Kruskal Wallis Test.
Results
In this study, all the study samples were observed by two observers. The counting of MFs was done independently to reduce the observer bias. Reliability analysis was done to test the consistency between the two observers. Since no interobserver bias was observed between the values of the two observers, the values of the first observer was taken for analysis.
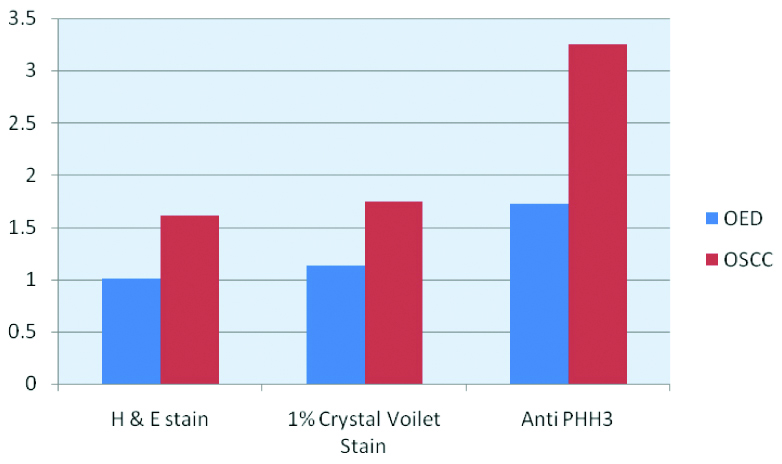
OSCC group samples were compared using Chi-square test for all the three stains with the other groups and it showed statistically significant with p-value (p=0.001). The mean count of 3.25 (SD=2.258) was obtained in PHH3 while a mean mitotic count in crystal violet and H&E were 1.74 (SD=0.518) and 1.61 (SD=0.504) respectively.
OED group showed p-value of (p=0.002) showing significant difference among the stains. The mean mitotic count of 1.72 (SD=0.958) was obtained in PHH3 while a mean mitotic count in crystal violet and H&E were 1.13 (SD=0.684) and 1.01(SD=0.514) respectively [Table/Fig-4].
Comparison of mitotic figures in OED and OSCC using H&E stain, crystal violet stain and anti-PHH3 stain.
| Group | Stain | N | Mean | SD | Median | Min. | Max. | Chi-square* | p-value |
|---|
| OED | H&E stain | 30 | 1.01 | 0.514 | 0.85 | 0.0 | 2.1 | 12.914 | 0.002 |
| 1% Crystal violet stain | 30 | 1.13 | 0.684 | 1.10 | 0.0 | 3.5 |
| Anti-PHH3 stain | 30 | 1.72 | 0.958 | 1.65 | 0.0 | 3.7 |
| OSCC | H&E stain | 30 | 1.61 | 0.504 | 1.6 | 0.5 | 3.1 | 14.306 | 0.001 |
| 1% Crystal violet stain | 30 | 1.74 | 0.518 | 1.7 | 0.5 | 3.1 |
| Anti-PHH3 stain | 30 | 3.25 | 2.258 | 2.65 | 0.4 | 10.1 |
Counting of mitotic figures
*Kruskal Wallis Test
While both OED and OSCC groups were compared statistically using Kruskal Wallis test, OSCC group showed higher number of MFs compared to OED [Table/Fig-4,5].
Comparison of mitotic figures in OED and OSCC using H&E stain, crystal violet stain and Anti PHH3 stain.
Discussion
Mitosis is essential for the normal growth and maintenance of an organism. Increased and abnormal mitosis indicate some form of genetic damage which is part of precancer and cancer. Genetic alterations in the nuclear DNA, like dysregulated mitosis (increased and abnormal mitosis) occur as part of carcinogenesis and can be a valuable prognostic indicator [5]. Thus, it is important to identify, quantify and assess mitotic cells and it is part of most histopathological grading systems used for OED and OSCC.
To our knowledge, literature search revealed limited IHC studies that compared MFs in OED and OSCC, hence this study was undertaken. In OED group, most of the MFs were seen in the basal and parabasal cell layers. In OSCC group, MFs were seen in both the superficial epithelium and in the tumour islands [4]. The identification of MFs in H&E stained slides even in a high power is a tedious and subjective task and may be less reliable in differentiating a mitotic cell from apoptotic cell. Metaphase, anaphase and telophase were easier to detect but prophase was difficult to detect by light microscopy [4,6].
More number of MFs was observed in crystal violet stain than H&E stain. All the stages i.e., prophase, metaphase, anaphase and telophase were recorded. Identification of MFs was not as strenuous as in H&E stained sections, they were easily identified as it clearly stains the chromosome leaving the cytoplasm clear and unstained. This offered a more reliable counting. Yet, it was difficult to differentiate between hyperchromatic nucleus, dyskeratosis and prophase [4]. The increased mitotic counts with 1% crystal violet in comparison to H&E stain suggest that this stain facilitates the identification of MFs even at a lower magnification.
Studies done by Ankle MR and Jadhav KB et al., on normal tissues, OED and OSCC comparing 1% crystal violet and H&E stain, found significantly good results with crystal violet in comparison to H&E stain [4,7]. Studies done by Palaskar SJ et al., on OED tissues, using H&E stain, Giemsa, Crystal violet, Toluidine blue and Feulgen stain, the MFS were enhanced with crystal violet in comparison with H&E stain. However, Feulgen stain showed the best results [6].
Use of 1% crystal violet eliminates false positive results as pyknosis, apoptosis and karyorrhexis can be easily discriminated from MFs. The use of routine H&E, 1% crystal violet stain is economical, easier, speedy and more feasible staining techniques. They can be used even in a small scale laboratory for the localization of MFs and assessing proliferation but they lack specificity [4-6]. Studies done by Rao RS et al., on OED and cervical carcinoma cases, compared Feulgen stain with 1% crystal violet stain and found that Feulgen stain gave much better results in staining MFs [8,9].
Phosphohistone H3 (PHH3) is an immunohistochemical stain, a protein phosphorylated during chromatin condensation in mitosis, and thus anti-pHH3 immunocytochemistry is able to assess mitotic activity [9].
H3 is phosphorylated at serine10 and serine 28 during mitosis and the antibody to PHH3 detect the core protein only when phosphorylated and thus making it mitotic specific antibody. MFs were identified in all phases of mitosis. The mitotic cells stained brown against light blue background. The MFs with condensed nuclear chromatin, visible mitotic spindles were considered as positive. Because of the mitotic specificity of PHH3 and distinct brown stain it was easy to identify the mitotic cells [10].
Various studies suggested that pHH3 index increased with higher grade of tumour, including cancers of breast, ovarian, melanoma, vulval intraepithelial neoplasia and meningioma [11,12]. While Aune G et al., in his study showed that the proliferation markers Ki-67/MIB-1, PHH3, and survivin were positively correlating with each other and with the tumour grade, and may contribute towards identification of aggressive ovarian carcinomas [13,14]. In gastrointestinal stromal tumours, studies done by Kim A et al., PHH3 immunostaining highlighted MFs better as compared to Ki-67 immunostaining [15-17]. All these studies support the present study.
Some studies showed contrasting results, such as studies done by Ladstein RG, suggested Ki-67 was a stronger and more robust prognostic indicator of patient survival than anti-PHH3 in series of nodular melanoma [18,19]. Studies done by Sun A et al., suggested no difference in anti-PHH3 expression between different grades of tumour for colorectal cancer or squamous cell carcinoma of the larynx [10]. Another study done on non-functional pituitary adenomas by Hightower E et al., did not show any correlation with disease progression with expression of anti PHH3 stain [20,21]. Studies done by Palaskar SJ, Rao RS comparing Feulgen stain with 1% crystal violet stain to detect mitosis, showed very good results with Feulgen stain [6,8]. A comparison of Feulgen stain with anti-PHH3 would be preferred to check the efficacy of both stains to detect MFs.
Limitation
Immunohistochemistry procedures are technique sensitive and standardisation was a tedious procedure that was the only limitation of this study.
Conclusion
The present study confirms that counting of MFs can be used as a prognostic indicator of head and neck OSCC and anti-PHH3 is a mitosis specific marker as it stains the MFs in all phases both in OED and OSCC cases and can be identified at lower magnification. Based on our observations, we hypothesize that anti-PHH3 is a better, user friendly, easy and specific marker for MFs than H&E and even 1% crystal violet stain. Additional studies comparing the potential of the marker with large number of cases to ascertain its prognostic value and it’s use in routine diagnosis has to be carried out to help us elucidate the picture more clearly.
Counting of mitotic figures
*Kruskal Wallis Test