Introduction
The diagnosis of HCC on imaging relies on subjective assessment of arterial enhancement and venous or delayed phase washout. The arterial phase enhancement is attributed to an increase in intralesional flow with relative reduction in portal flow which occurs as the lesion progresses from dysplastic nodule to HCC [1,2]. Venous or delayed phase washout is decrease in attenuation of the lesion relative to background liver. Factors attributed to washout include early drainage of contrast material as compared to parenchyma and retention of contrast by surrounding fibrotic parenchyma [1-3]. There is ample literature on arterial enhancing mimics of HCC [1,3-7]. Arterial enhancing metastases, cholangiocarcinomas are known, similarly washout, a hallmark of HCC has been described in other tumours [5-7]. According to some studies Intrahepatic Mass-forming Cholangiocarcinoma (IMCC) showing arterial enhancement, was the most common lesion misinterpreted as HCC in preliver transplant imaging work up in recipients [5,9]. In cirrhotic livers lesions like regenerative nodules, dysplastic nodules, arterioportal or venous shunts and confluent fibrosis may also mimic this appearance [2,5-9]. Owing to typical enhancement characteristics of HCC, radiological imaging plays a crucial role in diagnosis and this combined with certain clinical and biochemical characteristics have been adopted as practice guideline for diagnosing HCC over the world. Differentiating HCC from other hypervascular tumours is important since HCC has therapeutic implications and prognostic factors which are very different from other lesions [2,8,10].
The assessment for hypervascularity of tumours and washout or persistent enhancement relies heavily on radiologist’s subjective visual assessment. Only few studies have attempted to quantitate these variables and define the washout phenomenon [2,10]. In one study, parameters such as relative contrast washout ratio between the arterial phase and delayed phase and attenuation ratio of the lesion to the background liver were studied and the attenuation ratio of the lesion to the background liver in the delayed phase was found to have excellent sensitivity and specificity for HCC detection and good correlation with subjective assessment [2]. In yet another study, an attenuation difference of greater than 10 HU between the arterial and delayed phase yielded optimal sensitivity and specificity for detecting HCC [10]. Certain studies have also quantitatively assessed the washout pattern on Magnetic Resonance Imaging (MRI), with a study evaluating the signal to noise ratio and liver to lesion contrast [11]. Overall the available literature is limited in this aspect with variable results. In present study, we analysed a large retrospective cohort of hypervascular liver tumours which were consecutively diagnosed over a period of four years in our hospital. We performed a qualitative assessment of the imaging characteristics of HCC and non HCC hypervascular liver tumours followed by quantitative assessment of the enhancement, washout kinetics and derived objective values that help in differentiating HCC from non HCC on CT. To the best of our knowledge this is the first such Indian cohort of hypervascular liver tumours being subjected to such qualitative and quantitative assessment.
Materials and Methods
Institutional Ethics Committee approval was obtained and requirement for informed consent was waived after considering the retrospective nature of study. An extensive search of our Hospital Information System/Picture Archiving And Communication System (HIS/PACS-Vepro Medical Systems) for liver lesions on CT using keywords Hepatic, liver lesion, hepatic lesion, space occupying lesion, mass, HCC, Hepatocellular carcinoma and each of the individual common malignant and benign liver lesions revealed a total of 389 patients from January 2012 to February 2016 (four years duration). All Multidetector Computed Tomography (MDCT) examinations were performed on 64 slice MDCT (Somatom 64, Seimens healthcare) or 128 slice (Somatom Definition edge, Siemens healthcare) helical scanners. All studies were carried out in craniocaudal direction with patient supine with average 120 KV and 250-450 mA, values varying depending on patients build. Unenhanced images were obtained followed by administration of IV contrast (Iopromide 350-370 mg/mL), power injector was used for injection of contrast at a rate of 4 mL/sec. Automated bolus tracking was used. Images were obtained in arterial, venous and delayed phases, typically at 18-28 seconds, 55-65 seconds and 300 seconds after initiation of contrast administration.
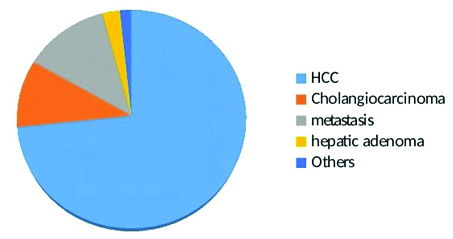
Hypervascular tumours on arterial phase were studied; thus, all hypo or avascular lesions were excluded. Hypodense lesions with thin peripheral enhancement, the pattern which is most common in metastatic lesions, were also excluded. The other exclusion criteria were: i) HCCs without histopathology and not meeting the criteria mentioned below in confirmation of tumor subtype, ii) Diffusely infiltrative HCCs as enhancement pattern and washout characteristics are difficult to assess in them, iii) HCCs with changes related to treatments like thermal ablation or transarterial chemoembolisation, iv) Non HCCs without definitive histological diagnosis, v) Very small tumours less than one cm in size as placing ROI for measurements is difficult in them, vi) Benign lesions like hemangiomas, abscess and cysts were also excluded as they show fairly typical enhancement patterns and in most no histopathological confirmation is done. Histopathological confirmation was available for all non HCCs and HCC (35 cases). 53 HCCs, all in at risk population having underlying cirrhosis were diagnosed based on AASLD guidelines (2010) and LI-RADS (version 2014). First AASLD criteria was applied (a lesion of more than 2 cm showing arterial phase hyperenhancement and subsequent washout, in presence of cirrhosis and elevated AFP levels, we used AFP cutoff of >400 IU/mL to enhance specificity), tumours meeting these criteria are virtually diagnostic of HCC [13]. All of these 53 cases were LI-RADS 5 category (indicating 100% certainty of HCC), with 34 cases being LR-5, 17 cases LR-5V with macrovascular invasion and two cases being LR-5us (being 1-2 cm in size and being visible as discrete nodules on ultrasound) [14]. Two HCCs were histological variants, one a fibrolamellar HCC and another cholangiocellular variant. After application of exclusion and inclusion criteria we arrived at a study population of 120 patients (86 males and 34 females) mean age 58.5 years, range (3-78 years). There were 88 (73%) HCCs, 12 (10%) mass forming cholangiocarcinomas, 15 (12.5%) metastasis, 3 (2%) adenomas, 1 (0.08%) hepatoblastoma and 1 (0.08%) angiosarcoma [Table/Fig-1]. For purpose of comparability the tumours were divided in two broad groups of HCC and non HCC.
A subjective or qualitative assessment was performed by two radiologists; having nine and five years of experience in abdominal imaging. After confirming the hypervascular nature of the tumour on the arterial phase assessment of subjective washout was done and presence or absence of washout on venous or delayed phases was noted. Presence of any delayed hyperenhancing central stroma was also noted. The examining radiologists were blinded to the results of histopathology and final diagnosis. Discrepancies if any were settled by consensus.
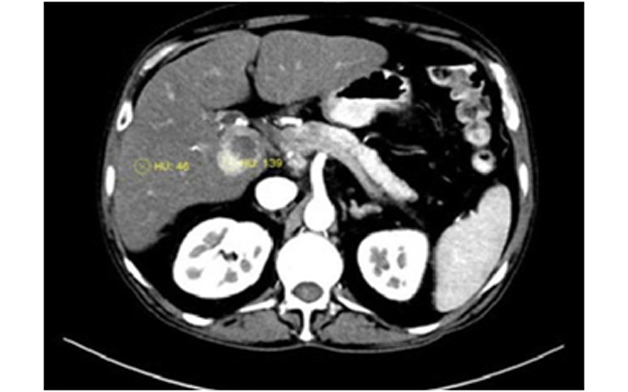
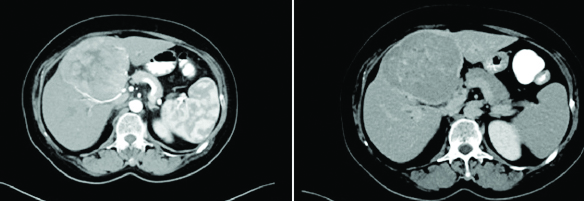
The quantitative analysis was done by one radiologist. The attenuation were measured in HU by drawing circular or oval ROI over the lesion. The ROIs were drawn to include maximally enhancing areas on arterial phase and ranged from 10 to 20 mm with similar ROI drawn on corresponding venous and delayed phase images. The necrotic areas of the tumour, major intratumoral feeding vessels or intratumoral arterioportal shunts were excluded [Table/Fig-2]. In case of large tumours with variable areas of enhancement, multiple ROIs were drawn in the enhancing regions of the tumour and averaged. Two ROIs were also obtained in the adjacent normal background liver in all the phases, taking care to avoid blood vessels. In case of multiple lesions, largest lesion was selected.
Hepatocellular carcinoma in caudate lobe with an eccentric necrotic component, ROI placement was done in the enhancing tumour component .
The following quantitative indices were calculated 1) Mean attenuation(MA) of lesions in different phases 2) Attenuation gain percentage on arterial phase (AGP): SOL a-BL a / BL a x100), Arterial phase attenuation change (AAC): SOL a –BL a (these indices assess the arterial enhancement of the lesions). 3) Attenuation loss percentage in venous and delayed phases (ALP-V, ALP-D): BL v/d-SOL v/d/ BL v/d x100; Percentage attenuation ratio in venous and delayed phases (PAR-V, PAR-D): 100x BL v/d/SOL v/d; Relative wash out ratio (RWR A-V, RWR A-D) from arterial to venous and delayed phases: 100x (SOL a-SOL v/d)/SOL a and from venous to delayed phases(RWR V-D): 100 x (SOLv-SOL d)/ SOL v.(these variables define the washout characteristics). (SOL a and BL a were attenuation of space occupying lesion and background liver attenuation on arterial phase respectively, SOL v/d and BL v/d were lesion and background liver attenuation on venous and delayed phases).
Statistical Analysis
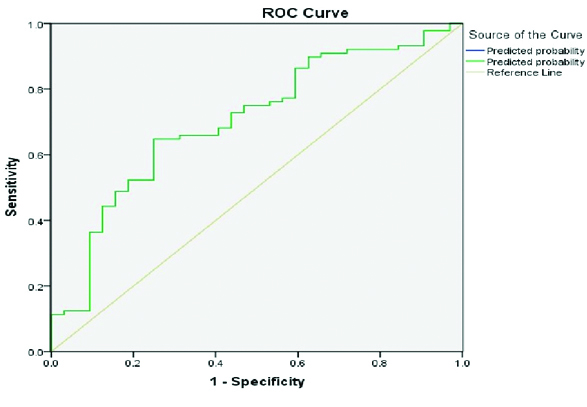
Statistical analysis was performed using IBM SPSS Statistics for Windows, version 20.0 (IBM Corp., Armonk, N.Y., USA). Sensitivity and specificity for washout appearance were calculated. For quantitative variables comparative analysis between HCCs and non HCCs was done using Student’s t-test. ANOVA analysis was used for comparison between HCC and individual categories in Non HCC (cholangiocarcinomas, metastasis and others). ROC curves were drawn for values that were significantly different to establish a cutoff value.
Results
The demographic and qualitative characteristics of the HCC and non HCC are as in [Table/Fig-3]. On qualitative analysis all HCCs showed homogenous or patchy enhancement on arterial phase. There was excellent interobserver agreement between the two radiologists for hypervascularity (Kappa value of 0.91) and presence of washout (Kappa value of 0.86) and discrepancies if any, were settled by consensus. Washout was noted on venous phase in 62/88 (69.3%) patients while on delayed phase additional 19 patients showed washout (81/88,92%). Overall 92% HCCs demonstrated washout in either venous or delayed phase. There was lack of subjective washout as perceived by both radiologists in 7/88 (8%) tumours [Table/Fig-4]. Of these however, two tumours did demonstrate a difference in quantitative washout if absolute values of HU obtained from ROI between the lesion and background liver were considered (though the difference was less than 10 HU). In addition in 8 (9%) tumours the washout was perceived as subtle and required either extensive window setting adjustments (in five cases) or settlement by consensus (three cases). The confounding factors encountered affecting visual assessment were presence of 1) steatosis in the background liver with lesion appearing hyperdense relative to the surrounding fatty liver in two cases, 2) presence of enhancing peripheral pseudocapusle in five cases and a delayed enhancing central fibrous stroma (noted in one case of fibrolamellar HCC). The metastases were the commonest non HCC lesion. Most of the hypervascular metastases were from adenocarcinomas with known or unknown primary sites. A qualitative washout appearance similar to HCC was noted in three cases (20%). Amongst the carcinoid metastasis or neuroendocrine tumours in present study sparing one which washed out the other two were hyper or isodense to parenchyma. Both cases of sarcoma metastasis (n=2) had peripheral enhancement, while washout was seen in one, the other was seen filling in from periphery to the centre. Thus, most of metastatic lesions showed no washout in the venous or delayed phase except one case of transitional cell carcinoma, one of neuroendocrine tumour and one sarcoma. Most of the adenocarcinoma metastases were isodense to parenchyma on delayed phase. The metastasis from gastrointestinal stromal tumour had peripheral fill in pattern.
Demographic and qualitative parameters of HCC and Non HCC.
| HCC | Non HCC | p-value |
|---|
| Females | 21 | 13 | 0.107 |
| Mean age (years) | 63.8 | 54.03 | 0.000 |
| Size <3 cm | 18 (20.45%) | 3 (9.37%) | 0.1868 |
| Mean size (cm) | 6.55±4.17 | 7.00±3.7 | 0.5916 |
| Washout present (%) | 81 (92%) | 7 (21.8%) | 0.001 |
The difference is significant at p<0.05
HCC*- Hepatocellular carcinoma
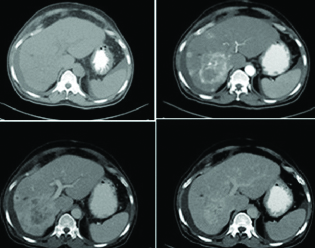
Histopathologically proven hepatocelluar carcinoma, multinodular in alcohol related cirrhosis, showing progressive enhancement pattern with lack of subjective or quantitative washout.
Amongst cholangiocarcinomas, none demonstrated washout on delayed phase, all the lesions appeared isodense, hyperdense or showed central enhancing stroma in the delayed phase. The true HCC mimics on qualitative analysis were the three cases of hepatic adenomas and one case of hepatoblastoma which had an enhancement and washout appearance similar to HCC. The only case of angiosarcoma showed hyperdense appearance on delayed phase. Thus, hepatic adenomas, few hypervascular non adenocarcinoma metastasis and hepatoblastoma showed washout appearance in venous or delayed phase; thus, mimicking HCC. The overall sensitivity of the qualitative washout appearance for predicting HCC was 92% while specificity was 78%.
The difference between the mean attenuation of the HCCs and non HCCs was significant in noncontrast (p-value 0.01), arterial (p-value 0.002) and delayed phases (p-value 0.013), while the difference was not significant in the venous phase (p-value 0.614). The quantitative indices are as listed in [Table/Fig-5]. There was no significant difference between the two groups in attenuation change in arterial phase (AAC), while AGP was significant (p-value 0.018). Of the washout parameters, in venous phase significant difference (p-value 0.002) was found in PAR-V in venous phases with no significant difference seen between the two groups in PAR-D. The washout parameters assessed were relative washout from arterial to venous or delayed phase (RWR A-V, A-D) and from venous to delayed phase (RWR-V-D). The relative washout from arterial to venous or delayed phases was (RWR A-V,A-D) was found to be significant (p-value 0.022, 0.004). Washout from venous to delayed phase (RWR-V-D) was also significant between the two groups (p-value 0.000). ALP-V that is attenuation loss percentage in venous phase was also significant (p-value 0.001). However, area under curve was significant for RWR V-D and PAR-V only (r-value >0.7) and analysis of ROC curves for PAR-V and RWR-V-D revealed good sensitivity and specificity for detection of HCC [Table/Fig-6,7].
Details of quantitative variables assessed.
| HCC (Mean) | Non HCC (Mean) | p-value |
|---|
| MA-NCCT | 66.31 | 52.71 | 0.01 |
| MA-Arterial | 105.96 | 89.8 | 0.002 |
| MA-Venous | 89.34 | 91.73 | 0.614 |
| MA-Delayed | 51.75 | 63.09 | 0.013 |
| AAC | 13.5 | 2.46 | 0.070 |
| AGP | 27.9 | 7.17 | 0.018 |
| PAR-V | 116.29 | 101.89 | 0.002 |
| PAR-D | 117.33 | 116.09 | 0.810 |
| RWR A-V | 9.3 | -6.6 | 0.022 |
| RWR A-D | 45.05 | 25.6 | 0.004 |
| RWR V-D | 43.27 | 31.38 | <0.001 |
| ALP-V | 10.83 | -1.16 | 0.001 |
| ALP-D | 12.01 | 9.73 | 0.487 |
MA-NCCT*-Mean Attenuation Non Contrast CT
AAC*- Arterial phase attenuation change, AGP*- Attenuation gain percentage, PAR-V*- Percentage attenuation ratio-venous phase, PAR-D*- Percentage attenuation ratio-delayed phase, RWR A-V*- Relative washout ratios arterial-ratio, RWR A-D*- Relative washout ratios arterial-delayed, RWR V-D*- Relative washout ratios venous-phase, PLP-V*- Attenuation loss percentage-venous phase, ALP-D*- Attenuation loss percentage-delayed phase
Receiver operating curve (ROC) for RWR-V-D, area under curve >0.7
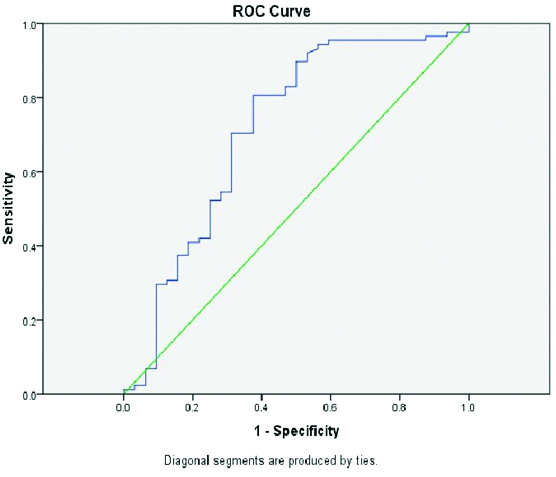
Receiver operating curve (ROC) for PAR-V, area under curve >0.7
On individual comparison of HCC with metastasis, cholangiocarcinoma and others category, significant difference was seen between RWR V-D of HCC (mean 43.27) when compared to cholangiocarcinomas (mean 31.2, p value 0.035) and metastasis (mean 33.63, p value 0.026).
Discussion
Studies show that combination of arterial hypervascularity and washout appearance of HCC on MDCT offers a specificity approaching 100% for HCC >20 mm in at risk populations. According to the AASLD guidelines (2010) a lesion of more than 10 mm showing arterial phase hyperenhancement and subsequent washout, in presence of cirrhosis can be considered as HCC and treated as such. Similar guidelines have been proposed by European Association for the Study of the Liver (EASL) in 2012 [13-15]. More recently LIRADS (2014) has been developed for categorising liver lesions in at risk population; this classification aims to facilitate clear communication between different personnel involved in care of these patients. The lesions falling in LR-5 category are nearly certain to be HCCs and consists of hypervascular lesions of more than 2 cm with one or more combinations of washout, capsule, threshold growth. In addition macrovascular mainly portal vein invasion constitutes LR-5V category [14].
A comprehensive quantitative analysis may help in providing further parameters that assists differentiation between HCC and non HCC. A quantitative assessment may also reduce interobserver variability and lay foundation for development of diagnostic algorithms and computed aided detection parameters. To the best of our knowledge, this is also the first study of this kind in India with no previous Indian cohort of hypervascular liver tumours having being subjected to this kind of qualitative and quantitative assessment.
HCCs showed uniform or nonuniform enhancement with most showing washout appearance. The overall sensitivity of the qualitative washout appearance for predicting HCC was 92% while specificity was 78%. The venous phase washout was seen in 69.3% patients while in delayed phase this number increased to 92%. About 8% of HCC did not washout at all while another 9% had a subtle washout. Latter could be resolved subjectively itself and washout even though subtle could be resolved qualitatively with a consensus agreement of two experienced radiologists. Thus, a qualitative washout assessment in a tertiary level setup with high volumes and experienced radiological staff does hold an excellent sensitivity and a reasonable specificity for HCC detection. The specificity may approach 100% if additionally presence of imaging features of cirrhosis is taken into account since none of the non HCCs had underlying cirrhosis. The overall sensitivity of the qualitative washout appearance for predicting HCC was 92% while specificity was 78%.
On quantitative evaluation there was significant difference in the attenuation between the two groups on noncontrast, arterial and delayed phases. Of the arterial parameters the AAC was found to be significantly different between the HCCs and non HCCs. However, when comparing the HCCs with individual subgroups of non HCCs the significance could not be elicited. The AGP was found to be significantly different between the two groups however, it merely represents arterial hypervascularity and doesn’t quantitate washout. The PAR as suggested by Liu Y et al., is a measurement of washout appearance of HCC, measured as a ratio of liver and lesion attenuation [2]. The values for PAR in venous phase showed significant difference between the HCC and non HCC while in delayed phase the difference was not statistically significant. The mean PAR-V of HCC was higher than Non HCC. The absence of difference of PAR in delayed phase is probably because there were lesions like adenoma and certain metastases that washed out significantly more than HCC from venous to delayed phase as compared to HCC resulting in almost similar values of PAR-D. A cutoff of PAR-V of 106 provided 70% sensitivity in diagnosing HCC. Relative Washout Ratio (RWR) from arterial to delayed and venous phase was significantly different between the two groups but seems irrelevant as many of the values were negative, since maximum enhancement was obtained in venous phase in many tumours. Considering the fact that attenuation of the lesion was maximum in venous phase, the calculated RWR from venous to delayed phase (RWR-V-D) showed that the HCC washout significantly more than non HCC and this temporal parameter of washout from venous to delayed phase seems more relevant than ascertaining washout from arterial to venous or arterial to delayed phase. As discussed earlier the washout phenomena is an appearance based on a lot of factors and RWR from venous to delayed phase seems to be one of the parameters that may differentiate the HCC and non HCC negating the effect of liver parenchymal attenuation. It is likely that gradient of loss of attenuation of lesion from venous to delayed phase is much more significant. The mean values of RWR-V-D of HCC (43.27) and non HCC (31.38) were significantly different and a cutoff of 41.79 offered a sensitivity of 75%.
When comparing individual groups there was a significant difference between the mean RWR-V-D values of HCC (mean 43.27) versus hypervascular IMCC (mean 31.2) and metastasis (mean 33.63). Loyer EM et al., compared the kinetics of HCC versus IMCC and found that HCC loose enhancement from venous to delayed phase while IMCC gain enhancement from the corresponding phases, however they included all cases of cholangiocarcinomas and not just the hypervascular variants [16]. Liu Y et al., used PAR ratio as a simple tool to measure the washout appearance [2]. In present study it is apparent that there are some arterial phase enhancing mimics showing the washout appearance complicating the oversimplified guidelines. We also had a much larger study population. In present study PAR-V was significant offering good sensitivity and specificity. This is in contradistinction to the study by Liu Y et al., which found PAR-D to be significant [2]. RWR-V-D was also significantly different between two groups and this gradient may actually help in cases that are not so straight forward.
In present study we found some true HCC mimics; however, which have similar qualitative appearance and quantitative indices like HCC, something which has not been highlighted in the other studies. These mimics were hepatocellular adenomas, hepatoblastoma and certain hypervascular metastasis [Table/Fig-8]. Hypervascular liver metastases from neuroendocrine tumours mimicking hepatocellular carcinoma in enhancement and washout pattern has been described in literature [16,17]. These mimics should be considered as differentials for HCC arising in noncirrhotic liver. The value of quantitative indices also appears to be doubtful for these mimics and appeared to be similar in both subgroups. Although, proving this statistically was difficult in present study due to the small sample size of the mimics. Thus, while a qualitative assessment combined with some useful quantitative parameters, can provide a noninvasive image based diagnosis in majority of cases in the settings of cirrhosis, the same may not hold true for HCC in noncirrhotic livers. A thorough clinicoradiological assessment can however, point to correct diagnosis with hepatocellular adenoma having distinct age group and predispositions, hepatoblastoma usually arising in pediatric age groups and metastatic lesions usually being accompanied by their primary known tumours, though biopsy may be needed for confirmation. Nevertheless a thorough qualitative assessment combined with assessment of certain useful quantitative indices mentioned above, can permit confident noninvasive image based diagnosis for a majority of HCCs in most radiological setup.
Neuroendocrine tumour metastatic to liver, showing arterial phase enhancement and delayed phase washout, a pattern indistinguishable from HCC.
Limitation
There were some limitations of present study, firstly the lack of histopathology for all HCCs and the use of AASLD guidelines and LIRADS classification with AFP levels for identifying the same (partly because obtaining a biopsy is now almost unethical in patients with cirrhosis meeting the classic imaging diagnostic criteria), but we were stringent in including patients with image based diagnosis, only cirrhotic patients with AFP of more than 400 IU/mL with washout were included. The incidence of cholangiocarcinomas which is known to be the most common mimic would be very low in this group and is unlikely to alter the results. The other limitations included, HCCs less than 1 cm which were not included in our data set. Thus, their behavior was not assessed, heterogeneity within the non HCC group and the sample size of the non HCC group was small compared to HCC. Retrospective nature of analysis also limits the evaluation.
Conclusion
While there are number of guidelines which include the more popular likes of AASLD and LI-RADS for diagnosis of HCCs and categorising liver lesions; yet, most of these continue to be subjective in nature with lack of quantification of hypervascularity or washout. A quantitative analysis defining the washout is useful additional determinant adding objectivity to image based diagnosis. Quantitative variables like PAR-V (threshold value 106), RWR-V-D (threshold of 41.79) complement the qualitative analysis, for diagnosis of HCC and have future implications like incorporation into guidelines and development of diagnostic algorithms for computed aided detection software packages.
The difference is significant at p<0.05
HCC*- Hepatocellular carcinoma
MA-NCCT*-Mean Attenuation Non Contrast CT
AAC*- Arterial phase attenuation change, AGP*- Attenuation gain percentage, PAR-V*- Percentage attenuation ratio-venous phase, PAR-D*- Percentage attenuation ratio-delayed phase, RWR A-V*- Relative washout ratios arterial-ratio, RWR A-D*- Relative washout ratios arterial-delayed, RWR V-D*- Relative washout ratios venous-phase, PLP-V*- Attenuation loss percentage-venous phase, ALP-D*- Attenuation loss percentage-delayed phase
[1]. Kamaya A, Maturen KE, Tye GA, Liu Y, Parti N, Desser T, Hypervascular liver lesionsSemin Ultrasound CT MR 2009 30(5):387-407.10.1053/j.sult.2009.06.001 [Google Scholar] [CrossRef]
[2]. Liu Y, Shin L, Brooke J, Kamaya A, Quantitatively defining washout in hepatocellular carcinomaAJR Am J Roentgenol 2013 200(1):84-89.10.2214/AJR.11.717123255745 [Google Scholar] [CrossRef] [PubMed]
[3]. Khosa F, Khan AN, Eisenberg RL, Hypervascular liver lesions on MRIAJR Am J Roentgenol 2011 197(2):W204-20.10.2214/AJR.10.538221785044 [Google Scholar] [CrossRef] [PubMed]
[4]. Murakami T, Tsurusaki M, Hypervascular benign and malignant liver tumors that require differentiation from hepatocellular carcinoma: Key points of imaging diagnosisLiver Cancer 2014 3(2):85-96.10.1159/00034386424944999 [Google Scholar] [CrossRef] [PubMed]
[5]. Kim SA, Lee JM, Lee KB, Kim SH, Yoon SH, Han JK, Intrahepatic mass-forming cholangiocarcinomas: enhancement patterns at multiphasic CT, with special emphasis on arterial enhancement pattern-correlation with clinicopathologic findingsRadiology 2011 260(1):148-57.10.1148/radiol.1110177721474703 [Google Scholar] [CrossRef] [PubMed]
[6]. Oliver J, Baron R, Federle M, Jones B, Sheng R, Hypervascular liver metastases: Do unenhanced and hepatic arterial phase CT images affect tumor detection?Radiology 1997 205(3):709-15.10.1148/radiology.205.3.93935259393525 [Google Scholar] [CrossRef] [PubMed]
[7]. Kim TK, Lee E, Jang HJ, Imaging findings of mimickers of hepatocellular carcinomaClin Mo Hepatol 2015 21(4):326-43.10.3350/cmh.2015.21.4.32626770920 [Google Scholar] [CrossRef] [PubMed]
[8]. Kang Y, Lee JM, Kim SH, Han JK, Choi BI, Intrahepatic Mass-forming cholangiocarcinoma: Enhancement patterns on gadoxetic acid-enhanced MR imagesRadiology 2012 264(3):751-60.10.1148/radiol.1211230822798225 [Google Scholar] [CrossRef] [PubMed]
[9]. Luca A, Caruso S, Milazzo M, Mamone G, Marrone G, Miraglia R, Multidetector-row computed tomography (MDCT) for the diagnosis of hepatocellular carcinoma in cirrhotic candidates for liver transplantation: prevalence of radiological vascular patterns and histological correlation with liver explantsEur Radiol 2010 20(4):898-907.10.1007/s00330-009-1622-019802612 [Google Scholar] [CrossRef] [PubMed]
[10]. Tan CH, Thng CH, Low AS, Tan VK, Hartono S, Koh TS, Washout of hepatocellular carcinoma carcinoma; quantitative region of interest analysis on CTAnn Acady Med, Singapore 2011 40(6):269-75. [Google Scholar]
[11]. Frericks BB, Loddenkemper C, Huppertz A, Valdeig S, Stroux A, Seja M, Qualitative and quantitative evaluation of hepatocellular carcinoma and cirrhotic liver enhancement using Gd-EOB-DTPAAJR Am J Roentgenol 2009 193(4):1053-60.10.2214/AJR.08.194619770329 [Google Scholar] [CrossRef] [PubMed]
[12]. McEvoy SH, McCarthy CJ, Lavelle LP, Moran DE, Cantwell CP, Skehan SJ, Hepatocellular carcinoma: illustrated guide to systematic radiologic diagnosis and staging according to guidelines of the american association for the study of liver diseasesRadioGraphics201333(6):1653-68.10.1148/rg.33612510424108556 [Google Scholar] [CrossRef] [PubMed]
[13]. Song DS, Bae SH, Changes of guidelines diagnosing hepatocellular carcinoma during the last ten-year periodClin Mol hepatol 2012 18(3):258-67.10.3350/cmh.2012.18.3.25823091805 [Google Scholar] [CrossRef] [PubMed]
[14]. Rakhmonova G, Choi J, Kim M, Liver imaging reporting and data system (LI-RADS) version 2014: understanding and application of the diagnostic algorithmClin Mole Hepatol 2016 22(2):296-307.10.3350/cmh.2016.002827304548 [Google Scholar] [CrossRef] [PubMed]
[15]. Cruite I, Tang A, Sirlin C, Imaging-based diagnostic systems for hepatocellular carcinomaAJR Am J Roentgenol 2013 201(1):41-55.10.2214/AJR.13.1057023789657 [Google Scholar] [CrossRef] [PubMed]
[16]. Loyer EM, Chin H, Dubrow RA, David CL, Eftekhari F, Charnsangavej C, Hepatocellular carcinoma and intrahepatic peripheral cholangiocarcinoma: enhancement patterns with quadruple phase helical CT-A comparative studyRadiology 1999 212(3):866-75.10.1148/radiology.212.3.r99se3286610478259 [Google Scholar] [CrossRef] [PubMed]
[17]. Laroia ST, Sasturkar S, Rastogi A, Pamecha V, Solitary hypervascular liver metastasis from neuroendocrine tumor mimicking hepatocellular cancer: All that glitters is not goldIndian J Nucl Med 2015 30(1):42-46.10.4103/0972-3919.14753525589805 [Google Scholar] [CrossRef] [PubMed]