The prevalence of DM worldwide was estimated to be 2.8% in 2000 and 4.4% in 2030 [1]. Type 2 DM is a part of metabolic syndrome which comprises endothelial dysfunction, platelet hyperreactivity and increased procoagulation factors contributing significantly to the increased risk of atherosclerosis, Coronary Heart Disease (CHD), and Peripheral Arterial Disease (PAD) [2]. Macro and microvascular complications are a major cause of morbidity and mortality in type 2 diabetic patients, and hence there is an increasing quest to find novel biomarkers to identify and treat individuals at high risk [3].
In response to proaggregatory stimuli such as thrombin, collagen generated by the endothelium of blood vessels, platelets change shape, adhere to subendothelial surfaces and aggregate to form a thrombus [4]. Consequently, platelets play an instrumental role in the pathophysiology and development of advanced atherosclerosis in diabetes. Platelets in DM are larger and have dysregulated signalling pathways that lead to an increased tendency to activate and aggregate in response to a given stimulus [5]. Hence, DM has been considered to have a prothrombotic potential with effects on a wide series of pathways which regulates platelet function, the cornerstone is represented by increased platelet reactivity [6].
Altered platelet morphology and function has been reported in patients with DM which have important implications for assessing the functional expressions of platelets and measuring platelet size. MPV is a measure of platelet function and this is supported by evidences such as the differences in platelet volume vividly correlates with differences in dense body content, platelet aggregation to ADP and serotonin uptake and release [7,8]. Experimental evidence points to a positive association of MPV with diabetes, hypertension, metabolic syndrome and acute coronary syndrome [9]. The activated platelets change from a discoid to a spherical shape altering in the PDW [10]. Recent studies proposed that higher MPV and PDW values indicate metabolically and enzymatically more active platelets with a great prothrombotic potential and hence, used as an alternative marker for platelet activity [11]. Despite the growing interest in MPV and PDW, a comprehensive analysis of the relationship between platelet indices and diabetic status is still lacking.
In this study, we aimed to compare and analyse platelet indices with glycaemic statusin type-2 DM patients and to establish the correlation, especially between MPV, PDW, FBS and HbA1c values.
Materials and Methods
Subjects
This analytical cross-sectional study was carried out in Department of Pathology over a period from June 2016 to June 2017, at SRM Medical College Hospital and Research Centre, Kattankulathur, Tamil Nadu, India. After approval approved by Institutional Ethical Committee. Total 450 subjects of both genders (Male 244 and Female 206) aged more than 20 years diagnosed with type 2 DM based on American Diabetes Association (ADA) criteria (2016) were included [12]. Study subjects were subgrouped as 150 uncontrolled diabetic patients (HbA1c >7.5% for previous six months as well as those with history of inadequate treatment), 150 controlled diabetic patients either on drugs or diet (≥6.5% to 7.5%) and compared with 150 non-diabetic controls (HbA1c <6.5%). History of underlying haematologic disorder, chronic kidney disease, hypertension, ischaemic heart disease, stroke pregnant woman and diabetics on antiplatelet drugs were excluded from this study. Informed consent was obtained from all the subjects. Patient’s proforma was maintained which included all past medical, surgical, drug, personal and family history.
Laboratory Methods
Blood samples (5 mL) collected from each subject in dipotassium EDTA tubes were analysed for Glycated haemoglobin (HbA1c) by High-Performance Liquid Chromatography (HPLC) method using Bio–Rad D10 analyser while those collected in sodium fluoride tubes were used for estimation of FBS level by glucose oxidase/peroxidase test method (Beckman coulter analyser). Platelet indices analysed using SYSMEX XT–1800i automated haematology analyser.
Statistical Analysis
Data from all laboratory examinations in this study were systematically and comprehensively collected for further statistical analysis using IBM SPSS software version 20.0. Arithmetic mean and Standard Error of Mean (SEM) were calculated and the expected value of each HbA1c and platelet indices was set as 95% CI. Then mean values of platelet parameters in both study and control groups were compared by one-way ANOVA test to determine whether a significant difference exists between these groups. The correlation between HbA1c, FBS and platelet indices was assessed using regression analysis. Statistical significant difference was accepted at p-value<0.05 (Pearson correlation coefficient).
Results
The observations derived from the present study revealed that diabetics had higher mean platelet count when compared to non-diabetics. Among diabetic patients, those with glycaemic status under control showed lower mean platelet count (273.95±7.54) than those with poor glycaemic status (276.01±7.23), however these differences were not found to be significant. The mean PDW among uncontrolled diabetics (11.86±0.12) was much higher than controlled diabetics (9.93±0.04) and non-diabetics (8.83±0.04) which was found to be statistically significant (p=0.0001). Similarly, the mean MPV among uncontrolled diabetics (10.85±0.05) was much higher than controlled diabetics (8.67±0.03) and non-diabetics (7.61±0.03) which was found to be statistically significant (p=0.0001). Thus, we have shown a significant stepwise increase in MPV from a non-diabetic population to controlled diabetics and then further to uncontrolled diabetic population. As per the data from auto analyser, the mean Platelet Larger Cell Ratio (P-LCR) value among uncontrolled diabetics was lower (24.63±1.41) compared to controlled diabetics which in turn was lower (26.82±0.59) than non-diabetic subjects (27.88±0.64). However, we could not determine a statistical difference for the same (p=0.05). The mean Plateletcrit (PCT) values were similar in all these three study groups. We observed a statistical significant difference (p=0.0001) in mean HbA1c percentage levels in non-diabetics (5.98±0.08), controlled diabetics (7.33±0.14) and uncontrolled diabetics (10.34±0.18) [Table/Fig-1].
Comparison of platelet indices of non-diabetics with controlled and uncontrolled DM.
| Variables | Non-diabetic (n=150) | Controlled DM (n=150) | Uncontrolled DM (n=150) | ANOVA | p-value |
|---|
| Male | 78 (52.0%) | 75 (50.0%) | 91 (60.67%) | Chi-square- 3.885 | 0.143 |
| Female | 72 (48.0%) | 75 (50.0%) | 59 (39.3%) |
| Platelet count X 103 | 267.74±6.47 | 273.95±7.54 | 276.01±7.23 | 0.368 | 0.692 |
| PDW | 8.83±0.04 | 9.93±0.04 | 11.86±0.12 | 387.752 | 0.0001** |
| MPV | 7.61±0.03 | 8.67±0.03 | 10.85±0.05 | 1736.748 | 0.0001** |
| P-LCR | 27.88±0.64 | 26.82±0.59 | 24.63±1.41 | 3.013 | 0.05 |
| PCT | 0.27±0.01 | 0.28±0.01 | 0.27±0.01 | 0.292 | 0.747 |
| HbA1c % | 5.98±0.08 | 7.33±0.14 | 10.34±0.18 | 12.206 | 0.0001** |
Platelet indices and HbA1c data were represented as mean±SEM and analysed by ANOVA. *Significant (p<0.05)
Platelet count, PDW-Platelet distribution width, MPV-Mean platelet volume, P-LCR-Platelet–large cell ratio, PCT-Plateletcrit, DM-Diabetes mellitus
Among non–diabetics, there was a significant difference in platelet count, PDW, P-LCR, PCT and HbA1c percentage between males and females (p=0.0001) except MPV. Among controlled diabetics, there was no difference in all the platelet parameters between males and females but a significant difference was found in HbA1c percentage value between males and females (p<0.05). Among uncontrolled diabetics, only platelet count (p=0.002) and PCT (p=0.0001) showed significant difference between males and females [Table/Fig-2].
Gender wise comparison of mean platelet parameters and HbA1c values in the study groups.
| Variables | Non-diabetes | Controlled DM | Uncontrolled DM |
|---|
| Male | Female | p-value | Male | Female | p-value | Male | Female | p-value |
|---|
| Age | 48.08±1.67 | 47.44±1.67 | 0.789 | 55.31±1.51 | 49.72±1.40 | 0.007 | 54.99±1.20 | 54.49±1.48 | 0.795 |
| Platelet count | 251.63±8.46 | 285.19±9.53 | 0.009 | 269.44±10.90 | 278.47±10.47 | 0.551 | 258.19±8.69 | 303.49±11.79 | 0.002* |
| PDW | 8.91±0.06 | 8.74±0.06 | 0.032 | 9.94±0.05 | 9.92±0.05 | 0.836 | 11.87±0.17 | 11.85±0.17 | 0.923 |
| MPV | 7.66±0.05 | 7.55±0.04 | 0.087 | 8.67±0.05 | 8.66±0.04 | 0.984 | 10.90±0.07 | 10.77±0.08 | 0.233 |
| P-LCR | 26.47±0.88 | 29.42±0.91 | 0.021 | 26.18±0.79 | 27.46±0.88 | 0.282 | 25.21±2.26 | 23.73±0.82 | 0.609 |
| PCT | 0.25±0.01 | 0.30±0.01 | 0.0001 | 0.27±0.01 | 0.29±0.01 | 0.354 | 0.25±0.01 | 0.31±0.01 | 0.0001** |
| HbA1c % | 5.72±0.11 | 6.26±0.11 | 0.001 | 7.00±0.19 | 7.66±0.21 | 0.021 | 10.39±0.23 | 10.28±0.28 | 0.762 |
Data were represented as mean±SEM. ANOVA was applied. *Significant (p<0.05), **highly significant (p<0.0001)
Platelet count, PDW-Platelet distribution width, MPV-Mean platelet volume, P-LCR-Platelet–large cell ratio, PCT-Plateletcrit, HBA1c-Glycated haemoglobin, DM-Diabetes mellitus
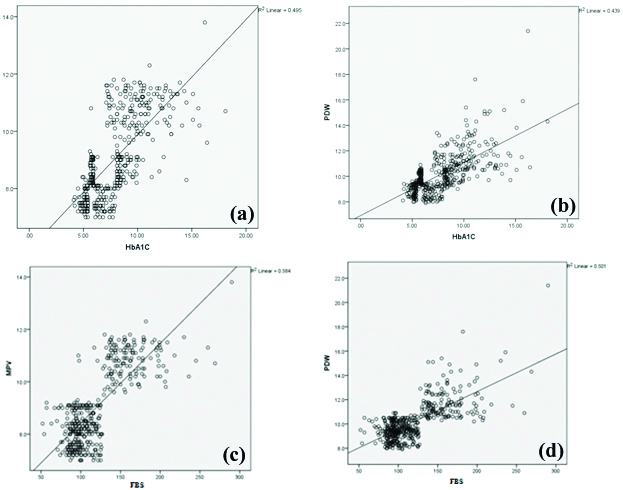
In [Table/Fig-3], there was a significant positive correlation found between HbA1c value and platelet count (p<0.05), PDW (p=0.0001) and MPV (p=0.0001) [Table/Fig-4a,b]. Similarly significant positive correlation was observed between FBS level and PDW (p=0.0001) and MPV (p=0.0001) [Table/Fig-4c,d]. There was also a significant negative correlation observed between FBS levels and P-LCR (p<0.05). There was no correlation between HbA1c (p=0.181) and FBS (p=0.257) levels and PCT.
Correlation analysis between platelet indices with HBA1c percentage and FBS.
| Parameters | HbA1c percentage (%) | FBS |
|---|
| r | p-value | r | p-value |
|---|
| Platelet count | 0.108 | 0.022 | 0.073 | 0.121 |
| PDW | 0.663 | 0.0001 | 0.708 | 0.0001** |
| MPV | 0.703 | 0.0001 | 0.764 | 0.0001** |
| P-LCR | -0.068 | 0.150 | -0.097 | 0.040* |
| PCT | 0.063 | 0.181 | 0.054 | 0.257 |
Platelet count, PDW-Platelet distribution width, MPV-Mean platelet volume, P-LCR-Platelet–large cell ratio, PCT-Plateletcrit, HBA1c-Glycated haemoglobin, FBS-Fasting blood sugar
Scatter plot representation of correlation between a) HbA1c levels and MPV; b) HbA1c levels and PDW; c) FBS levels and MPV; d) FBS levels and PDW.
As strong positive correlation was found between PDW, MPV with HbA1c value, the mean platelet parameters were compared with various grades of HbA1c. We observed a significant difference in the values of PDW (p=0.0001) and MPV (p=0.0001) when compared with various grades of HbA1c [Table/Fig-5].
Association between PDW, MPV with various grades of HbA1c percentage.
| HbA1c percentage (%) | PDW | MPV |
|---|
| ≤7 (n=150) | 9.25±0.05 | 7.99±0.05 |
| 7.1–8.9 (n=43) | 10.20±0.10 | 9.23±0.12 |
| 9–10.9 (n=44) | 11.30±0.14 | 10.25±0.12 |
| 11–12.9 (n=33) | 12.28±0.33 | 10.75±0.16 |
| 13–14.9 (n=23) | 11.29±0.36 | 10.73±0.24 |
| ≥15 (n=7) | 14.01±1.45 | 10.91±0.51 |
| ANOVA | 78.108 | 102.223 |
| p-value | 0.0001** | 0.0001** |
Data were represented as mean±SEM and analysed by ANOVA, Significant* (p<0.05)
PDW-Platelet distribution width, MPV-Mean platelet volume, HBA1c-Glycated haemoglobin
Discussion
The pathophysiological mechanism by which diabetes is associated with increased vascular complications has been explained by many hypotheses: endothelial dysfunction, inflammatory state and altered platelet morphology and dysfunction [13]. Prothrombic state in diabetes is contributed by platelet hyperreactivity, hence causing increased coagulation, impaired fibrinolysis and endothelial dysfunction. Many clinical studies by Demirtunc R et al., have confirmed that these hyperactive platelets play a critical role in the pathophysiology of the thrombotic events leading to diabetic complications [14].
Type 2 DM is associated with metabolic abnormalities like hyperglycaemia, insulin resistance and systemic abnormalities like oxidative stress and inflammation. The influence of each of these abnormalities on platelet function and activity has been addressed by many researchers.
Winocour PD et al., proposed that hyperglycaemia increases platelet reactivity by increasing non-enzymatic glycation of proteins on the platelet surface, and also by the osmotic effect of glucose [15]. Such glycation decreases membrane fluidity and increases the activation of platelets. Insulin is a natural antagonist of platelet hyperactivity. Insulin counteracts the effect of platelet agonists such as epinephrine, collagen and platelet-activating factor. Both insulin resistance and insulin deficiency increase platelet reactivity [16]. Kakouros N et al., suggested that Insulin directly controls the platelet function via a functional Insulin Receptor (IR) present on the surface of human platelets [5].
Platelet hyperreactivity is increased in hyperglycaemia due to activation of protein kinase C. Consequently, persistent hyperglycaemia in diabetes leads to various vascular complications and the platelets add up these effects [5]. Treatment regimens that improve insulin sensitivity and preserve pancreatic-cell function, decrease platelet reactivity and improve the effects of antiplatelet agents. Furthermore, oxidative stress and inflammation in diabetes results in endothelial dysfunction which promotes platelets activation by reducing production of Nitric Oxide (NO) that attenuates platelet reactivity [17].
Platelet size has become an important marker (and possibly a determinant) of platelet function and also a physiological variable of haemostatic importance [18]. MPV is an indicator of the average size and activity of platelets. Larger platelets are younger, hyperreactive and more aggregable when compared with smaller platelets because they secrete more serotonin and β-thromboglobulin, scontain denser granules and produce more thromboxane A2 producing a procoagulant effect leading to thrombotic vascular complications [19]. This suggests the association between the platelet size and diabetic vascular complications, thus indicating alterations in MPV reflect the state of thrombogenesis [20]. PDW can directly measure the variability in platelet size, and its high values suggest increased production of larger reticulated platelets [21].
We could clearly see from the present study results that MPV was significantly elevated (p=0.0001) in uncontrolled Diabetics as compared to controlled diabetics and non-diabetic controls which coincides with the results of Kodiatte TA et al., (p=0.003) [Table/Fig-1] [22]. Demirtunc R et al., (p=0.002), Hekimsoy Z et al., (p<0.0001), Jindal S et al., (p<0.05) but contradicts the results of Unübol M et al., (p=0.64) [14,19,23,24].
The increase in MPV in uncontrolled Diabetics could be justified based on few of the following hypothetical theories. Major source of energy for platelets is glucose. In DM due to chronic hyperglycaemia, platelets are overwhelmed with glucose and subjected to synthesis of glycogen contributing to increase in MPV. Calverley DC and Thienelt CD supported this by saying that electron microscopy of platelets reveals the presence of glycogen as well as prominent masses in diabetic patients [25]. Studies also suggest osmotic swelling and reflection of higher turnover due to raised levels of some glucose metabolites increase MPV in high glycaemic patients [26].
Also, the present results clearly demonstrates that higher PDW in patients with poor glycaemic control when compared with non-diabetic controls which in turn confirms platelet hyperactivity in diabetes, coinciding with the results of Jindal S et al., and Dalamaga M et al., [Table/Fig-1] [23,27]. Vagdatli E et al., proposed that activated platelets differ in size due to a change from a discoid to a spherical shape and pseudopodia formation which results in a change PDW [10].
We also observed that the mean platelet count in the diabetic group was higher than that of the non-diabetic group, similar to the study results of Demirtunc R et al., but contradicts with results of Hekimsoy Z et al., [Table/Fig-1] [14,19]. Ebil N et al., suggested that increase in platelet count in diabetes may be due to increase in glycoprotein IIb/IIIa, 1b-IX,1a/IIa, CD62 and CD63 [28].
When we compared the platelet parameters genderwise [Table/Fig-2] in each study group, in both uncontrolled diabetics and non-diabetic individuals, mean MPV level was higher in men than women, whereas, mean MPV level in controlled diabetics were almost similar in men and women, however the difference was not statistically significant in all three study groups. Other researchers namely Park Y et al., and Bain BJ, have found no statistically significant differences in MPV between women and men and the present results concords with their results but contradicts with results of Radha RK and Selvam D [29-31]. However, the data on this are vague, and further investigation of the topic is needed.
In [Table/Fig-3,4a,b] clearly illustrated a significant positive correlation between HbA1c value and platelet count (r=0.108), PDW (r=0.663) and MPV (r=0.703) and it coincides with the results of Demirtunc R et al., Kodiatte TA et al., and Jindal S et al., but contradicts with results of Mowafy N et al., [14,22,23,32]. This significant correlation clearly suggests the role of chronic hyperglycaemia for the increase in MPV and PDW values.
Similarly, significant positive correlation [Table/Fig-3,4c,d] was observed between FBS level and PDW (p=0.0001) and MPV (p=0.0001) which coincides with the study results of Alhadas KR et al., [33]. Shimodaira M et al., also confirm a relationship between MPV and FBS in prediabetic subjects [34]. However, Hekimsoy Z et al., did not find any correlation between MPV and FBS in patients with type 2 DM [19].
Since, we observed a significant difference in the values of PDW (p=0.0001) and MPV (p=0.0001), in diabetics when compared with non-diabetics, we further wanted to find their association with various grades of HbA1c levels. Interestingly, we observed a significant increase in MPV and PDW as HbA1c level increases [Table/Fig-5]. This finding of ours provides initial evidence for a direct association between glycaemic status and platelet hyperactivity paving way to the pathogenesis of vascular complications in DM. This agreed with the findings of the studies done by Kodiatte TA et al., and Zuberi BF et al., [22,35].
Although, there are several measurements to show the platelet activity like platelet aggregometry, surface p-selectin, activated glycoprotein II b/III a, platelet function analyser–100, serum thromboxane B2 and urinary 11–dehydrate thromboxane B2, almost all of these measurements are time consuming, expensive or they require special training [36].
Limitation
There are few limitations in the present study such as small sample size, qualitative platelet disorders were not assessed and patients were not categorised according to diabetic complications. Hence, further multicentric research with larger same size and qualitative platelet function analysis may provide a future strategy to prevent thromboembolic events in DM.
Conclusion
From the present results, we conclude that MPV and PDW are increased in diabetics. They are simple and cost-effective tools that can be used as a good indicator of platelet activation and an independent predictor of impending vascular complications in DM. Moreover, the present results strongly indicate that achieving good glycaemic control may limit platelet activation, and delay the onset or progression of vascular complications in DM. Future research with large sample size is needed to classify these relations in terms of the pathogenesis.
Platelet indices and HbA1c data were represented as mean±SEM and analysed by ANOVA. *Significant (p<0.05)
Platelet count, PDW-Platelet distribution width, MPV-Mean platelet volume, P-LCR-Platelet–large cell ratio, PCT-Plateletcrit, DM-Diabetes mellitus
Data were represented as mean±SEM. ANOVA was applied. *Significant (p<0.05), **highly significant (p<0.0001)
Platelet count, PDW-Platelet distribution width, MPV-Mean platelet volume, P-LCR-Platelet–large cell ratio, PCT-Plateletcrit, HBA1c-Glycated haemoglobin, DM-Diabetes mellitus
Platelet count, PDW-Platelet distribution width, MPV-Mean platelet volume, P-LCR-Platelet–large cell ratio, PCT-Plateletcrit, HBA1c-Glycated haemoglobin, FBS-Fasting blood sugar
Data were represented as mean±SEM and analysed by ANOVA, Significant* (p<0.05)
PDW-Platelet distribution width, MPV-Mean platelet volume, HBA1c-Glycated haemoglobin