Marfan’s Syndrome is an autosomal dominant inherited multisystem disorder that occurs worldwide and affects both sexes equally. The incidence of MS is estimated to be two to three per 10,000 individuals without any racial predilection [1]. Classic MS occurs due to mutations in the FBN1 gene localised on chromosome 15q21, which encodes the matrix protein fibrillin 1; although, it is documented that 25% of the sporadic cases led to de novo mutations in zones which are several distant base pairs from this gene sequence [2]. In a minority of cases (less than 10%) with a typical Marfan phenotype, no mutation in FBN1 is identified [2].
Marfan’s Syndrome may affect various apparatus including the cardiovascular, musculoskeletal, central nervous, pulmonary, ocular and integumentary systems. Aortic dissection, congestive heart failure and cardiac valve disease are the most common causes of death in more than 90% of subjects affected by MS and, thus the primary causes of reduction in life expectancy [3].
Oral manifestations of MS are identifiable during a routine intraoral examination. It is well known that MS frequently entails local hypoplastic enamel spots, root and crown deformity, abnormal pulp shape, pulpal inclusions, calculus and gingival indices. Dental agenesis was reported with a lower prevalence (1.45%) [4], if compared with general population (7.1%) [5], but more researches are needed. Temporomandibular alterations are more frequently detected in Marfan subjects caused by an articular deformation and ligament hyperlaxity [6]. A number of craniofacial characteristics, mainly comprising maxillary/mandibular retrognathia, long face and skeletal open bite tendency show a strong correlation with MS [7].
There is no data available in the literature with regard to morphological characteristics of the maxilla in MS assessed by 3D morphometric analysis.
The maxillary arch morphology in MS has been usually assessed measuring transverse dental distances only by clinical evaluation or study casts [8]. This kind of measurements did not consider the influence of dental inclination and position on the alveolar bone, often altered in Marfan subjects. Moreover, bidimensional analysis gave incomplete information about the morphology of the palatal vault in the three dimensions of the space. Considering these limitations, an evaluation of 3D characteristics of the maxilla by means of 3D laser technology may be preferred [9], in order to obtain a better comprehension of MS oral manifestations.
Geometric morphometrics analysis has been proposed in the literature as an original method of visualisation of shape changes [10,11]. It can show three-dimensional morphological changes in their complexity, in a more efficient way rather than traditional bidimensional measurements. To our knowledge, no study has been conducted on Marfan subjects using these analyses.
The aim of this preliminary study was to use 3D geometric morphometrics in order to evaluate the variability of palatal shape in a group of Marfan subjects as compared with a CG.
Materials and Methods
In the present preliminary cross-sectional study, a group of five male subjects with a mean age of 9.1±0.8 years, with a clinical diagnosis of MS, were recruited from the Centre for Rare Diseases for Marfan Syndrome and Related Disorders of Tor Vergata University Hospital during the period of December 2016 to April 2017. The subjects were evaluated in the Departments of Orthodontics of the same University.
The inclusion criteria for MG were genetic assessment of MS, Caucasian ancestry, intermediate mixed dentition (first permanent molars and incisors erupted), prepubertal stage of cervical vertebral maturation as assessed on lateral cephalograms (CS1, CS2) [12], good quality of initial radiographs (panoramic and cephalometric) and dental casts. The MG was compared with a CG of five non-syndromic male subjects (mean age 9.3±0.6 years). Inclusion criteria for CG were the same selected for MG with the exception of Marfan diagnosis. Moreover, all subjects of CG had Class I or end-to-end molar relationship and no posterior cross bite relationship. Exclusion criteria for both MG and CG were presence of sucking habits, previous orthodontic treatment, cleft lip and/or palate, other genetic diseases.
This project was approved by the Ethical Committee of the University of Rome Tor Vergata (Protocol number: 4544/2017) and informed consent was obtained from the patients’ parents.
For each subject, dental impressions of both the arches were taken before any treatment and used to make study models. Maxillary study casts of all subjects were scanned using the extraoral scanner OrthoX®scan (OrthoX®scan; Dentaurum GmbH and co, Ispringen, Germany) with a manufacturer’s reported accuracy <20 μm. All models were exported in a Standard Tesselation Language format (STL digital file). To study the entirety of the shape of the palate at any point of the surface, 3D Geometric Morphometrics (GMM) analysis was used [13].
A template for data set/collection of homologous landmarks describing a palate was created with view box four (dHAL software, Kifissia, Greece).
On each digital cast, three curves were drawn and a total of 239 landmarks were digitised [Table/Fig-1] [14]. The boundaries of the palate were defined as: the midsagittal suture (nine points), a perimeter curve of the dental arch passing apical to the gingival sulcus of each tooth (21 points) and a posterior curve passing from distal of the first permanent molars, perpendicular to the midsagittal line (nine points). The remaining points (semilandmarks) were placed uniformly on the palatal surface within the confines delimited by the three curves [15]. The averages of all the datasets were calculated and used as a fixed reference (Procrustes average) to allow all semilandmarks to slide and become more homologous from subject to subject in order to minimise the thin plate spline bending energy [16,17]. This procedure was repeated three times.
The template of 239 landmarks used to study the palatal shape.
The three curves drawn on the digital casts. Green points: midsagittal suture, orange: perimeter of the dental arch on margin, pink: posterior border tangent to the distal surface of permanent first molars, dark green and blue: semilandmarks on the palatal surface.

All digitisation’s of study casts were performed by the same operator and analysed using the Generalised Procrustes Analysis (GPA).
Statistical Analysis
Procrustes analysis was applied and Principal Component Analysis (PCA) was performed to reveal the main patterns of palatal shape variation [18]. The test used to evaluate the statistical differences between the two groups was Procrustes distance between means with 10000 permutations.
To determine the reliability of the method, all the casts were re-digitised by the same operator 10 days after the first digitisation.
Results
Mean random error of the 20 repeated digitisations, expressed as a percentage of total shape variance was 2.8%.
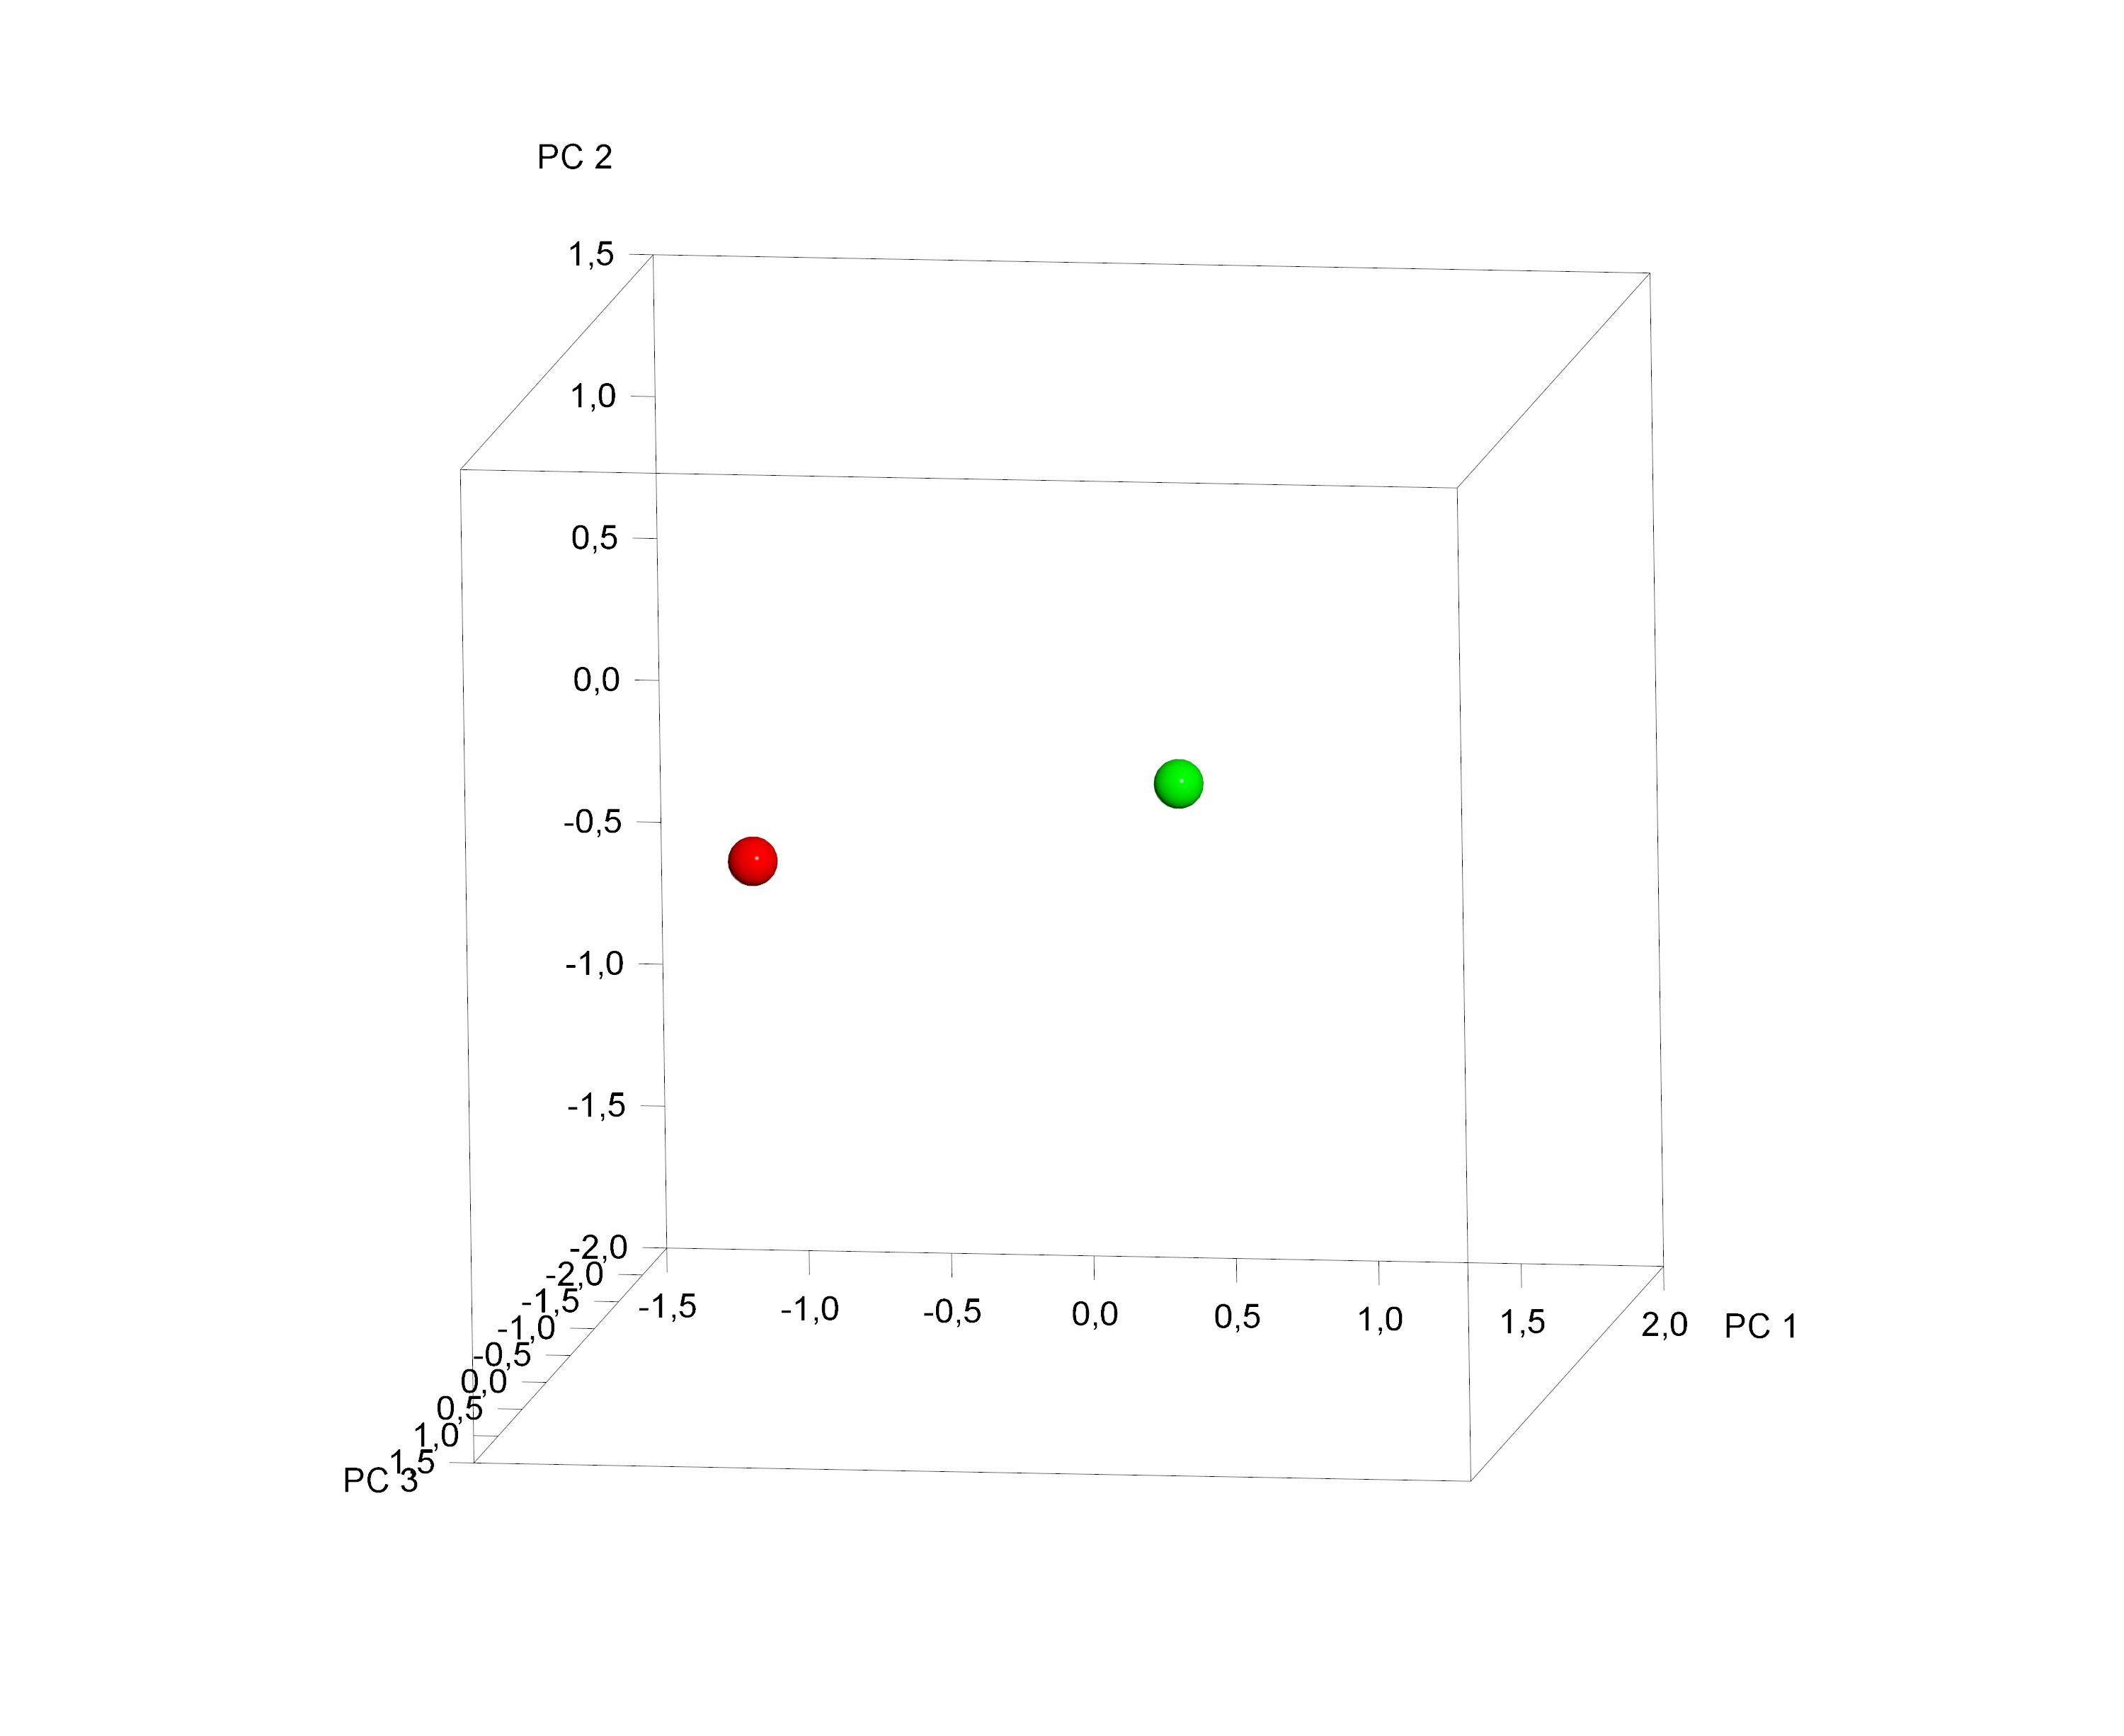
The [Table/Fig-2] shows a cluster distribution of the average total palatal shape of MG and CG palate, after Procrustes superimposition. A statistically significant difference between the palate’s shape of MG and CG was found (10000 permutations; p = 0.017).
Plot of the sample average distribution.
Red sphere: Marfan Group (MG), green sphere: Control Group (CG)
Principal Component (PC)
The first four Principal Components (PCs) were considered to be statistically meaningful (at least 5% of total shape variability) and composed the 88.8% of total shape variability (PC1= 65.7%, PC2= 11.3%, PC3= 6.7%, PC4= 5.1%).
The variability described by the first PC1 was morphologically the most significant because it defines the 65.7% of total shape variability. It was concerned with shape variations in all three dimensions of space. More specifically on a lateral view, PC1 shows, a high and long palate’s conformation in MG [Table/Fig-3a]. On a superior view [Table/Fig-3b], the palate of MG appears not significantly constricted in the premaxilla zone; by contrast, it presents a marked reduction gradient from the canine to the posterior region of the palate. Observing the palate from the posterior view [Table/Fig-3c], it is possible to confirm the severe transverse constriction; furthermore, it is evident a reduction in the height of the palate.
Graphic depiction of the first principal component (PC1) of the palate from the three views.
Red line: −3 Standard Deviation, blue line: +3 Standard Deviation.
a. lateral view, b. superior view, c. posterior view

The [Table/Fig-4a-c] shows the comparison between MG (blue points) and CG (red points) palatal shape on lateral, superior and posterior views. Significant changes were particularly related to a deformation located on lateral and posterior regions. In particular, MG showed a narrower and higher palate compared to CG.
Comparison between MG and CG palatal shape.
Blue points: Marfan Group (MG); Red points: Control Group (CG)
a. lateral view, b. superior view, c. posterior view

Discussion
The present study aim to analyse palatal region morphology in five growing MS subjects and to compare them with a control group by means of 3D geometric morphometric evaluation of digital dental casts.
Several studies aimed to identify orofacial manifestations of MS and a general consensus has been reached in finding a significant correlation between MS and palatal shape alteration. Cephalometric surveys indicated a prevalence of a high and deep palate in 50% [8,19].
A previous study by Cistulli PA et al., assessed maxillary morphology of 13 MS adults, with a mean age of 32.3 years, using study casts and linear measurements like intercuspid distance, interpremolar distance, intermolar distance and maximum height of hard palate. They found a marked constriction of maxillary arch; by contrast a significant difference in the height of hard palate was not detected in comparison with a control group [20]. However, the limitation of this study was that they evaluated maxillary morphology using dental index in MS subjects, which usually are affected by dental crowding and abnormality of tooth surfaces [21].
Westling L et al., evaluated the craniofacial manifestation and palatal dimension from dental cast and lateral cephalograms of 76 adults (mean age 24.3 years) affected by MS. High and narrow palate vaults, as well as maxillary and mandibular retrognatic position, were found to be strongly correlated to the syndrome [8].
However, the large range of age of the sample (subjects from 0.5 to 55 years), made the study non-reliable for a real description of palatal morphology in MS.
De Coster PJ et al., described the craniofacial structure in MS by comparing cephalometric measurements to population standards. They reported short maxilla, increased palatal height and palatal length compared to controls [22].
Docimo R et al., agreed that Marfan patients generally present a high-arched palate, associated with maxillary constriction that represents a distinctive syndromic occlusal feature. Nevertheless, they evaluated 32 peadiatric subjects (mean age 10.5 years) but only based on a clinical evaluation of ogival palate and cross-bite [23].
Previous studies limitations mainly consisted the bidimensional evaluation of palatal morphology and maxillary dimensions by clinical, radiographic and dental casts measurements; these data may not deeply describe the morphology of the palatal vault in three planes of the space and they were influenced by the dental inclination and position on the alveolar bone.
Moreover, in medical examinations, the registration of high and narrow palatal vaults has primarily been based on clinical evaluations like palatal index and controversy exists in defining palatal height as well as palatal length [24,25].
To overcome these limitations, in the present study we used the 3D geometric morphometric analysis. This method enables a better representation of shape than traditional linear measurements and allows the visualisation of shape differences and the evaluation of the interaction with transversal, sagittal and vertical factors between groups of specimens [26].
The method used for the palate evaluation and the criteria selection, such as age range, dentition stage and skeletal maturation, allowed an accurate representation of the maxilla in MS growing subjects.
As recommended by Parcha E et al., subjects with tooth agenesis and impacted teeth were excluded to avoid their potential impact on palatal shape and asymmetry. The palatal vault was assessed up to the gingival margin in order to eliminate the influence of dental inclination and position on the alveolar bone [14].
Data from the current study indicated that subjects with MS, compared to the CG, show a transverse maxillary deficiency. In particular, the superior palatal region and the lateral maxillary surface were different between the two groups. As shown in [Table/Fig-4], MG has a different maxillary morphology with a narrower and higher palatal vault compared with subjects without syndrome.
These features confirm the lack of space for the tongue, which contributes to malocclusion, reduced posterior airway space, breathing disorders and posterior rotation of the mandible. All these elements are present in MS subjects.
Moreover, our study revealed that the most notable size contraction is localised especially in the posterior palatal region in MG.
These results were similar to other outcomes by Cistulli PA and Sullivan CE which also assessed a significant correlation with high Nasal Airway Resistance (NAR) in these patients [27].
The same author in 1998 supported the use of Rapid Maxillary Expansion (RME) to decrease the incidence of NAR and related obstructive sleep apnea in MS [28]. In fact, the use of RME in early mixed dentition increases the transverse dimension of the maxillary arch, allowing an improvement of the width of the maxilla and reducing nasal resistance [29,30].
Often subjects with undiagnosed MS may present for orthodontic treatment. In these situations, the orthodontist could be the first health care provider to come in close contact with the patient.
Limitation
This paper is a preliminary study and findings should be considered in light of limitations. The Marfan syndrome is a rare disease with a low prevalence in general population (two to three per 10,000 individuals) and its rarity makes difficult to collect a large sample. The study was conducted on small number of males subjects in order to obtain a more homogeneous study sample and to avoid a sexual dimorphism. In order to obtain more data and suitable information about this pathology, further researches are necessary with large sample size including both males and females.
Conclusion
Our data suggests that Marfan subjects have a specific palatal morphology characterised by high palatal vault and narrow maxillary posterior region.
Further investigations on more numerous and sexual homogeneous growing subjects are necessary for a complete comprehension of palatal morphology in Marfan syndrome.