The human gingiva is an integral part of the oral mucosa and forms the soft tissue casing for the periodontal attachment apparatus. The human gingiva has been identified as target tissue for synthesis, biochemical transformation and action of hormones like oestrogen, progesterone, testosterone and cortisol [1-4]. In recent times, another hormone, melatonin has been projected to play a significant role in periodontal homeostasis and pathology. Melatonin, chemically denoted as N-acetyl-5-methoxytryptamine is synthesised predominantly by the pinealocytes, the resident cells of the pineal gland during the dark phase of the day. A complex biochemical cascade operates to synthesise melatonin from its precursor tryptophan. The enzymes involved are tryptophan-5-hydroxylase, 5-hydroxytryptophan decarboxylase, AANAT and HIOMT [5]. Melatonin performs numerous functions in the human body including free radical scavenging, immunomodulation, inhibition of carcinogenesis and stimulation of bone formation [6-9]. Extra pineal production of melatonin has been documented in other tissues such as the ovaries, retina and gastrointestinal tract [10-12]. In the oral cavity, the salivary glands are known to possess the biochemical machinery for melatonin biosynthesis [13]. A previous study showed the presence of melatonin in gingival tissue samples obtained from healthy individuals and chronic periodontitis patients [14]. With this background, the present study was performed to analyse if the gingiva could synthesise melatonin and inturn function as an extrapineal site of melatonin production. The current study was performed in non smokers and current smokers with and without chronic generalised periodontitis to assess if the genes coding the enzymes AANAT and HIOMT, the melatonin receptors MT1 and MT2 are present in the gingival tissues. Current smokers were chosen as smoking is a condition associated with oxidative stress and depletion of antioxidants such as melatonin. It was hence, planned to assess the status of melatonin biosynthesis in this state. It is mandatory that a tissue must have receptor for a particular drug/hormone to consider it as a target tissue. Hence, a quantification of melatonin receptors and immunolocalisation was also carried out in the gingival tissue samples to analyse if the gingiva is a target for receptor mediated actions of melatonin in the above mentioned states.
Materials and Methods
Study Design and Patient Selection
This Case control study was approved by the Institutional Ethics Committee of Sri Ramachandra University, Chennai and performed between June 2016 to June 2017. A total of 60 volunteers were recruited after taking written informed consent and allocated into four groups namely, PHN-Group 1, NCP-Group 2, PHS-Group 3, and current SCP-Group 4. The sample size was calculated by the statistical expert with support of relevant literature [12]. Based on the true probability of exposure a sample size of 15 volunteers per group was arrived at, to reject the null hypothesis with a type 1 error of 5% and a power of 80%. The PHN group comprised of 15 non smokers who had clinically healthy gingiva without the signs of inflammation and bleeding on probing. The NCP group comprised of 15 non smokers with Chronic generalised periodontitis with at least the presence of 10 natural teeth who manifested clinical signs of gingival inflammation and periodontal pockets with attachment loss in greater than 30% of the intraoral sites examined with radiographic evidence of bone loss [15]. The PHS group comprised of 15 cigarette smokers who were currently smoking and had smoked at least 100 cigarettes in their lifetime with clinically healthy gingiva without the signs of inflammation and Bleeding On Probing (BOP) [16]. The SCP group comprised of 15 cigarette smokers who were currently smoking and had at least smoked 100 cigarettes in their lifetime with the clinical signs of chronic generalised periodontitis as described above. The general exclusion criteria for all groups in the present study were the presence of any systemic disease, consumption of antibiotics, anti-inflammatory drugs, melatonin and antioxidant supplements in the past six months before the study. Patients with previous history of periodontal therapy, pregnant and lactating women were also excluded from the study.
Clinical Parameters
All subjects were examined clinically for the following periodontal parameters: Plaque Index (PI) calculated by measuring the presence or absence of supragingival plaque biofilm around the buccal, mesial, distal and lingual regions of all teeth [17], gingival bleeding (BOP) calculated as percentage positive sites that bleed upon probing in six sites per tooth [18], probing pocket depth and Clinical Attachment Loss (CAL). One examiner performed all the CAL measurements at six sites per tooth: mesiobuccal, mesiolingual, midbuccal, distobuccal, distolingual and midlingual. The researcher was calibrated prior to the study by repeated examination in five patients. Probing depth was measured from the free-gingival margin to the base of the periodontal pocket and CAL was estimated from the cementoenamel junction of the tooth to the base of the periodontal pocket [19]. Measurements were rounded to the highest whole millimetre using the Michigan 0 probe with William’s markings.
Gingival Tissue Sample Collection
Gingival tissue samples were obtained during surgical crown lengthening in the PHN and PHS groups and prior to scaling and root planning in the NCP and SCP groups. A portion of the marginal gingiva and the interdental papilla was surgically excised using a sterile 15 size surgical blade after administration of local anaesthesia. A sterile aseptic protocol was strictly followed during sample collection. The tissue samples after collection were cut into bits by using sterile scissors and a surgical blade. A portion of these were transferred onto ice and immediately shifted to the laboratory for flow cytometry experiment. Other portions were transferred to sterile vials containing RNA later and 10% phosphate buffered formalin for RT-PCR and immunohistochemistry experiments.
Reverse transcriptase polymerase chain reaction analysis for detection of genes coding AANAT, HIOMT, MT1 and MT2.
Total RNA (Ribonucleic Acid) was isolated from the gingival tissue samples using RNA plus (M.P biologicals) according to the manufacturers instructions. Briefly, samples of approximately 50 mg weight were homogenised using a tissue homogeniser in 2 mL of RNA plus in sterile 15 mL centrifuge tubes and centrifuged at 1000 rpm for two minutes to settle the tissue debris. The supernatant was processed according to a standard protocol till a visible RNA pellet was obtained. After processing the pellet, the final RNA samples were quantified using the Eppendorf Bio Spectrophotometer and stored at −80°C until Complimentary Deoxyribonucleic Acid (cDNA) conversion. A total of 1 μg of RNA was taken for the first strand cDNA synthesis with the verso cDNA synthesis kit (ABgene) using manufacturers protocol. The resultant cDNA samples were quantified using the Eppendorf Bio Spectrophotometer and stored in −20°C until PCR amplification. A total of 250-500 ng of cDNA was used for PCR amplification. A 2X red dye mastermix from ampliquon was used for the reaction. The PCR reaction was carried out with the following conditions-Denaturation of 94°C for 30 seconds, primer annealing for 30 seconds at temperature indicated in [Table/Fig-1]. Extension step of 72°C for 30 seconds. PCR was carried out with 35 cycles for all genes. A 2% agarose gel was cast in tris acetate EDTA buffer and 5-10 μL of the PCR reaction product was run at 100 volts for 45 minutes. A 1000 basepair ladder was also run with every gel to verify if the amplified fragments were of the right size. GAPDH was used as the house keeping gene for RTPCR analysis. The bands were visualised using safe dye stain in a UV transilluminator gel imaging platform. Images were captured using the chemidoc software and quantified using Image J software.
Primer sequences, annealing temperature and PCR product size of the GAPDH, AANAT, HIOMT, MT1 and MT2 genes.
| GENE | Primers | Annealing Temp | Product size |
|---|
| GAPDH | Forward 5’-ACCACAGTCCATGCCATC-3’Reverse 5’-TCCACCACCCTGTTGCTG-3’ | 58°C | 452 bp |
| ANAAT | Forward 5’- TGCCAGTGAGTTTCGCTGCCTC-3’Reverse 5’ACCTGTGCAGCGTCAGTGACTC-3’ | 58.6°C | 242 bp |
| HIOMT | Forward - 5’ CCTGAAGCTGCTGAAAGTGG 3’Reverse 5’ GGACCTGTAGATGGCCGTAA 3’ | 57°C | 371 bp |
| MT1 | Forward 5’ CATCCTGTCGGTGTATCGGA 3’Reverse 5’ CGATGCCGGTGATGTTGAAT 3’ | 60°C | 295 bp |
| MT2 | Forward - 5’ GTGATCCTCTCCGTGCTCAG 3’Reverse 5’ GCCGGTAGATTCGGTGGTAG 3’ | 58°C | 273 bp |
PCR-Polymerase Chain Reaction, GAPDH-Glyceraldehyde-3-Phosphate Dehydrogenase, AANAT-N-Acetyl Transferase, HIOMT-Hydroxyindolyl-O-Methyltransferase, MT1-Melatonin Receptor 1, MT2-Melatonin Receptor 2
Flow Cytometry Analysis for Detection of Melatonin Receptors in Gingival Tissue Samples
Gingival tissue samples freshly obtained on ice were digested in 1X Phosphate Buffered Saline (PBS) (pH 7.4) containing 2 mg/mL of collagenase enzyme for two hours in a 37°C incubator. At the end of the incubation period, collagenase action was arrested by the addition of ice-cold 1X PBS (pH 7.4), the digested gingival tissues were dispersed thoroughly with 1 mL pipette to release the gingival cells into PBS and the cell suspensions were filtered through 70 μm cell strainer to remove undigested tissue. The filtrate was centrifuged at 1500 rpm for 10 minutes at 4°C to pellet the gingival cells. The cell pellets were again resuspended in 3 mL of 1X PBS (pH 7.4), washed by vortexing and again centrifuged at 1500 rpm for five minutes at 4°C. The cell pellets were then resuspended in 100 μL of 1X PBS and this 100 μL of gingival cell suspensions were then divided into 50 μL aliquots in 1.5 mL microcentrifuge tubes. Out of these two 50 μL gingival cell aliquots, one aliquot was maintained as unstained cells without the addition of antibodies for melatonin receptor 1A tagged to a complimentary secondary antibody with fluorochrome label (Fluorescin isothyocyanate) (Novus Biologicals, Catalogue no: NBP1-71113). To the other 50 μL aliquot of gingival cells, antibody for melatonin receptor 1A was added at 1:50 dilution and incubated in dark at room temperature for 15 minutes. At the end of 15 minutes incubation period, 500 μL of 1X PBS (pH 7.4) was added to each aliquot including unstained cells, washed by vortexing to remove any unbound antibody and centrifuged at 1500 rpm for five minutes at 4°C. After centrifugation, the supernatants were discarded and the cell pellets were resuspended in 600 μL of 1X PBS (pH 7.4), mixed well by vortexing and acquired in the flow cytometer for the assessment of the expression of MT1 receptor.
Immunohistochemical Detection of Melatonin Receptors in Gingival Tissue Samples
Immunohistochemical staining was done as a qualitative experiment to understand the localisation of MT1 receptors in the gingival tissue samples of the four study groups. Tissue sections of 4 μm thickness were made and transfered onto poly-L-Lysine coated slides. The tissue sections were dehydrated by immersing the slides in three changes of absolute alcohol each for five minutes. After washing procedure, antigen retrieval was done with the help of pressure cooker. The sections were immersed in citrate buffer solution and placed into the cooker and heated for 15 minutes. The slides were then washed in running tap water for five minutes. Following this, the tissue sections were incubated with super block (Scytek Laboratories, U.S.A) for 15 minutes. Then, the sections were incubated with the Primary antibody, polyclonal human anti-rabbit melatonin receptor 1 (Novus Biologicals, Catalogue no: NBP1-71113) for 30 minutes at room temperature. The excess of primary antibody was drained and the slides were washed with Tris buffer twice, each for 15 minutes. The sections were then stained with the universal secondary antibody kit (Scytek Laboratories, U.S.A) according to manufacturers instructions. The sections were air dried, cleared in xylene and mounted with Distyrene Plasticiser Xylene (DPX) and visualised under light microscope. Human brain was used as positive control as this tissue is known to express MT1. The MT1 receptor stained the membrane brown against blue background in positive cells. Staining was categorised as weak, moderate and intense based on standard criteria [20].
Statistical Analysis
The numerical data obtained from the RT-PCR and flow cytometry experiments were statistically analysed using SPSS software version 23.0. One-way ANOVA was used to analyse overall significance and the Post-hoc Tukey’s test was used to assess the intragroup differences. A p-value <0.05 was considered significant in both the tests.
Results
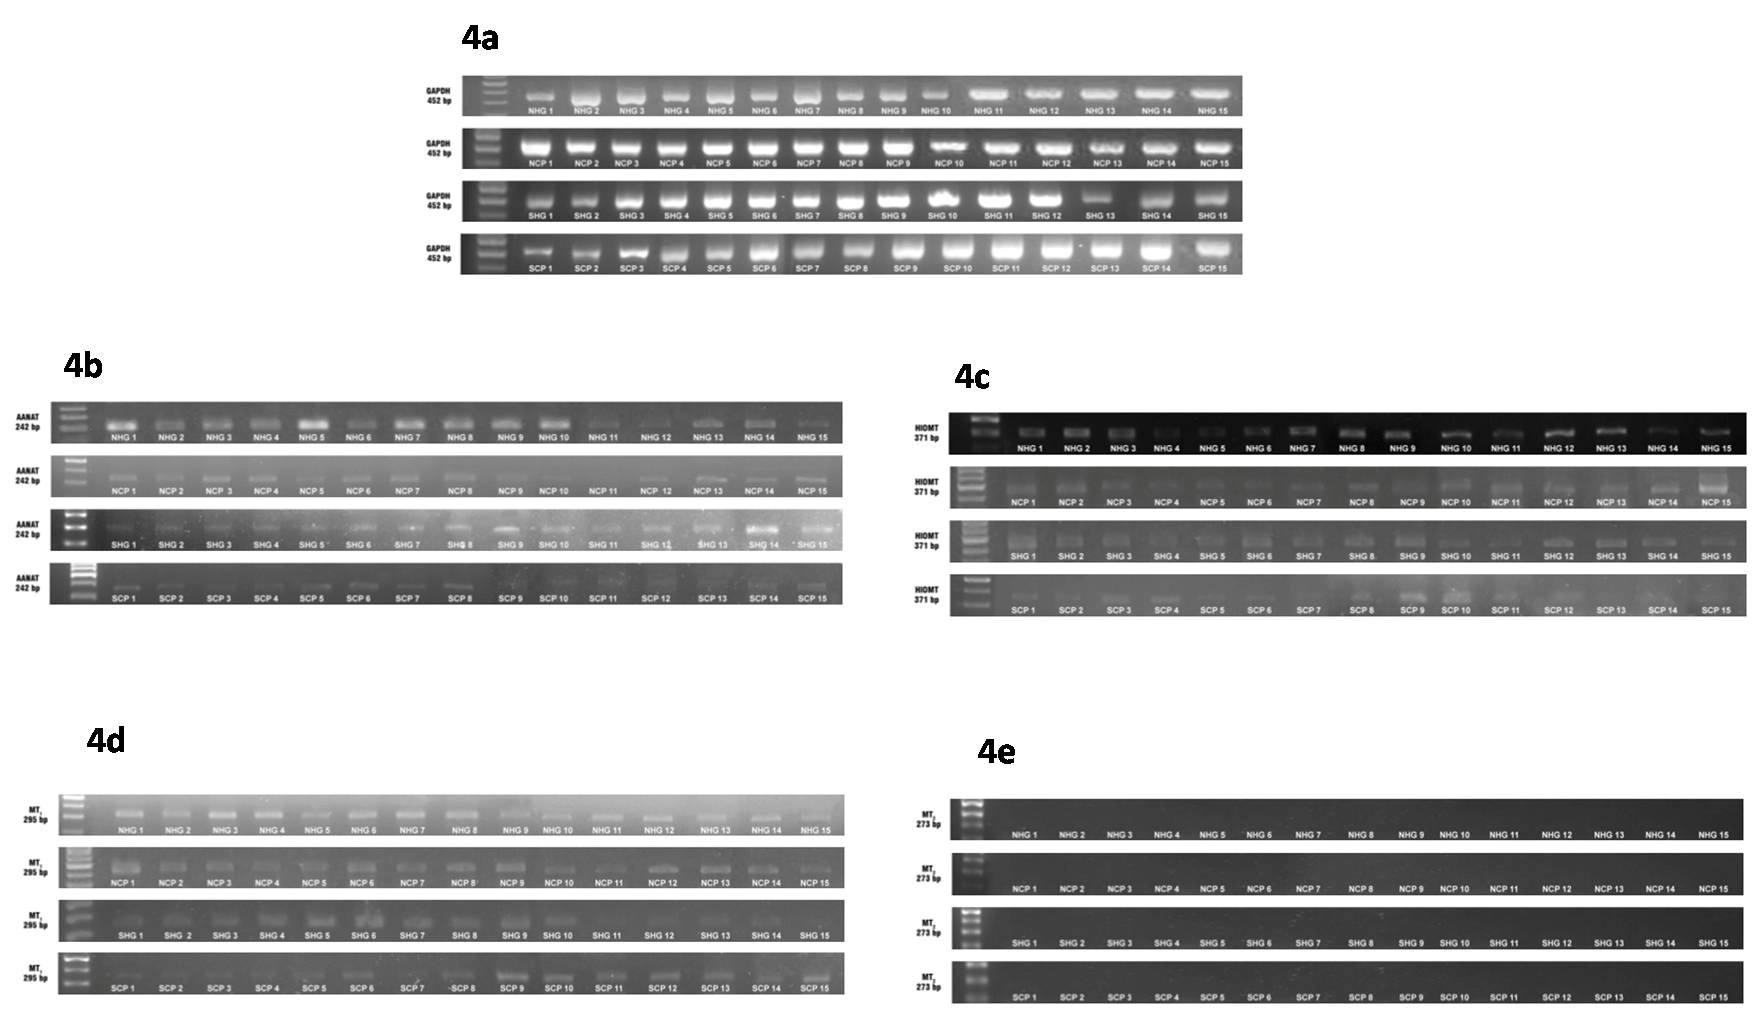
A total of 60 participants with an age range of 41 to 46 years were recruited into this study. The demographic details of the study participants is depicted in [Table/Fig-2]. This table shows the gender distribution, mean plaque index, BOP, CAL and smoking scores of the study participants. It can be inferred that the PHN and PHS groups had no CAL and significantly lower PI, bleeding scores compared to the NCP group. With regard to the SCP group, the bleeding scores were comparable to the PHN and PHS groups while PI scores were significantly higher. The [Table/Fig-3], shows the mean levels of expression of the AANAT, HIOMT, MTI and MT2 genes in the gingival tissue samples of the four study groups. The agarose gel images and associated bar diagrams depict the house keeping gene GAPDH, AANAT, HIOMT, MTI and MT2 gene expression in the samples [Table/Fig-4a-e]. The results of the study revealed the presence of the AANAT, HIOMT, and MTI genes in all the samples assayed while none of the samples expressed the MT2 gene. One-way ANOVA test revealed an overall significant difference in the expression of AANAT, HIOMT and MT1 genes amongst the groups.
Demographic details of the study participants. PHN-periodontally healthy non smokers, NCP-Non smokers with Chronic generalised Periodontitis, PHS-denotes periodontally healthy current smokers, SCP-current Smokers with Chronic generalised Periodontitis (n=15 in each group). One-way ANOVA test performed with level of significance set at p<0.05.
| Group | Total number of participants | Gender distributionNumber of males/Number of Females | Mean Age (years) | Mean PI | Mean BOP scores (%) | Mean Attachment loss (mm) | Mean smoking scores (pack years) |
|---|
| PHN | 15 | 7/8 | 45.47±1.36 | 13.03±0.78 | 3.4±0.27 | 0.00 | 0.00 |
| NCP | 15 | 8/7 | 41.50±1.19 | 88.47±1.61 | 79.73±2.06 | 1.74±0.07 | 0.00 |
| PHS | 15 | 15/0 | 43.17±1.37 | 12.13±0.77 | 2.63±0.22 | 0.00 | 1.18±0.08 |
| SCP | 15 | 15/0 | 42.63±1.34 | 86.13±1.74 | 3.27±0.31 | 3.45±0.14 | 1.419±0.12 |
| p-value | | p<0.05 | 0.194 | p<0.05 | p<0.05 | p<0.05 | p<0.05 |
*denotes significant
BOP-Bleeding On Probing, PI-Plaque Index
Gene expression of AANAT, HIOMT, MT1 and MT2 in the gingival samples. PHN-periodontally healthy non smokers, NCP-Non smokers with Chronic generalised Periodontitis, PHS-periodontally healthy current smokers, SCP-current Smokers with Chronic generalised Periodontitis (n=15 in each group). One-way ANOVA test performed with level of significance set at p<.05.
| Variable measured | PHN | NCP | PHS | SCP | F test ratio df | p-value |
|---|
| Mean AANAT gene expression | 7.44±0.65 | 6.76±0.80 | 5.08±0.77 | 3.56±0.45 | 6.593 | p<0.001 |
| Mean HIOMT gene expression | 8.00±0.57 | 4.35±0.72 | 5.22±0.77 | 1.79±0.32 | 17.068 | p<0.001 |
| Mean MT1 receptor gene expression | 8.03±0.79 | 4.77±0.73 | 2.02±0.20 | 3.78±0.40 | 18.724 | p<0.001 |
| Mean MT2 receptor gene expression | - | - | - | - | - | - |
*denotes significant
AANAT-N-Acetyl Transferase, HIOMT-Hydroxyindolyl-O-Methyltransferase, MT1-Melatonin Receptor 1, MT2-Melatonin Receptor 2
Agarose gel images showing the expression of the genes encoding GAPDH (4a), AANAT (4b), HIOMT (4c), MT1(4d) and MT2 (4e) in the gingival tissue samples of the study groups. PHN-periodontally healthy non smokers, NCP-Non smokers with Chronic generalised Periodontitis, PHS-periodontally healthy current smokers, SCP-current Smokers with Chronic generalised Periodontitis.
GAPDH-Glyceraldehyde-3-Phosphate Dehydrogenase, AANAT-N-Acetyl Transferase, HIOMT-Hydroxyindolyl-O-Methyltransferase, MT1-Melatonin Receptor 1, MT2-Melatonin Receptor 2
Furthermore Post-hoc Tukey’s HSD test [Table/Fig-5] revealed the highest levels of AANAT expression in the PHN group and lowest levels of ANAAT expression in the SCP group which was statistically significant when compared to each other (p<.05) but not when compared to the other groups (p>.05). With regard to HIOMT gene expression Post-hoc Tukey’s HSD test revealed highest levels in the PHN group and lowest levels in the SCP group which was statistically significant when compared to each other (p<.05). The HIOMT values were significantly higher in the NCP group compared to the SCP group (p<0.001) but no significant difference was observed in the values when the NCP and PHS groups were compared (p>0.05). With reference to the MT1 gene expression the highest levels were observed in the PHN group which was statistically significant when compared to the other three groups (p<0.05). The lowest level of MT1 gene expression was observed in the PHS group. This value was significantly lower compared to the PHN and NCP groups (p<0.001) but not significant when compared to the SCP group (p>0.05).
Comparison of AANAT, HIOMT, MT1 gene expression levels in the gingival tissue samples between the study groups. PHN-periodontally healthy non smokers, NCP-Non smokers with Chronic generalised Periodontitis, PHS-periodontally healthy current smokers, SCP-current Smokers with Chronic generalised Periodontitis, (n=30 in each group). SE denotes Standard Error, Post-hoc Tukey’s HSD test performed with level of significance set at p<0.05.
| Dependent Variable | Group | Group | Mean Difference±SE | p-value | 95% Confidence Interval |
|---|
| Lower Bound | Upper Bound |
|---|
| AANAT Gene | PHN | NCP | 0.67±0.95 | 0.894 | -1.86 | 3.21 |
| | PHS | 2.35±0.95 | 0 .078 | -0.18 | 4.89 |
| | SCP | 3.87±0.95 | p<0.001 | 1.33 | 6.42 |
| NCP | PHN | -0.67±0.95 | 0.894 | -3.21 | 1.86 |
| | PHS | .6±0.95 | 0.308 | -0.86 | 4.22 |
| | SCP | 3.20±0.95 | p<0.05 | 0.65 | 5.74 |
| PHS | PHN | -2.35±0.95 | 0.078 | -4.89 | 0.18 |
| | NCP | -1.68±0.95 | 0.308 | -4.22 | 0.86 |
| | SCP | 1.52±0.95 | 0.396 | -1.02 | 4.06 |
| SCP | PHN | -3.87±0.95 | p<0.001 | -6.42 | -1.33 |
| | NCP | -3.20±0.95 | p<0.001 | -5.74 | -0.65 |
| | PHS | -1.52±0.95 | 0.396 | -4.06 | 1.02 |
| HIOMT Gene | PHN | NCP | 3.65±0.87 | p<0.001 | 1.33 | 5.98 |
| | PHS | 2.78±0.87 | p<0.001 | 0.46 | 5.10 |
| | SCP | 6.21±0.87 | p<0.001 | 3.89 | 8.53 |
| NCP | PHN | -3.65±0.87 | p<0.001 | -5.98 | -1.33 |
| | PHS | -0.87±0.87 | 0.752 | -3.19 | 1.44 |
| | SCP | 2.55±0.87 | p<0.001 | 0.23 | 4.87 |
| PHS | PHN | -2.78±0.87 | p<0.001 | -5.10 | -0.46 |
| | NCP | 0.87±0.87 | 0.752 | -1.44 | 3.19 |
| | SCP | 3.42±0.87 | p<0.001 | 1.10 | 5.75 |
| SCP | PHN | -6.21±0.87 | p<0.001 | -8.53 | -3.89 |
| | NCP | -2.55±0.87 | p<0.001 | -4.87 | -0.23 |
| | PHS | -3.42±0.87 | p<0.001 | -5.75 | -1.10 |
| MT1 Gene | PHN | NCP | 3.25±0.82 | p<0.001 | 1.06 | 5.43 |
| | PHS | 6.01±0.82 | p<0.001 | 3.82 | 8.19 |
| | SCP | 4.24±0.82 | p<0.001 | 2.06 | 6.43 |
| NCP | PHN | -3.25±0.82 | p<0.001 | -5.43 | -1.06 |
| | PHS | 2.75±0.82 | p<0.001 | 0.57 | 4.94 |
| | SCP | 0.99±0.82 | 0.626 | -1.19 | 3.17 |
| PHS | PHN | -6.01±0.82 | p<0.001 | -8.19 | -3.82 |
| | NCP | -2.75±0.82 | p<0.001 | -4.94 | -0.57 |
| | SCP | -1.76±0.82 | 0.154 | -3.94 | 0.42 |
| SCP | PHN | -4.24±0.82 | p<0.001 | -6.43 | -2.06 |
| | NCP | -0.99±0.82 | 0.626 | -3.17 | 1.19 |
| | PHS | 1.76±0.82 | 0.154 | -0.42 | 3.94 |
*denotes significant
AANAT-N-Acetyl Transferase, HIOMT-Hydroxyindolyl-O-Methyltransferase, MT1-Melatonin Receptor 1
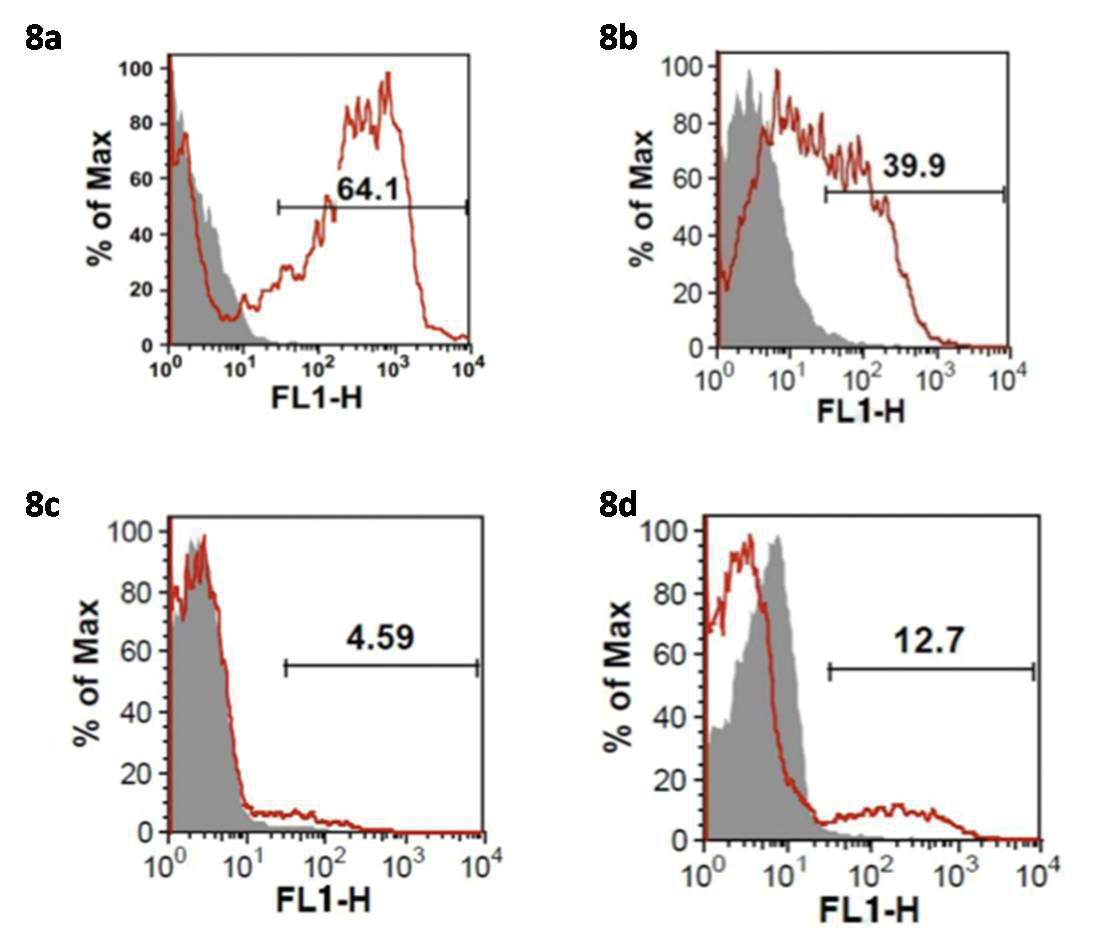
The [Table/Fig-6] shows the mean levels of expression of the MT1 receptor protein levels as a percentage in the gingival tissue samples of the four study groups. Representative flow cytometry histograms depict the MT1 receptor protein levels in the samples. The numerical values depicted in the histogram are the individual values as percentage for the respective samples [Table/Fig-7]. One-way ANOVA test was used to analyse overall significance and Post-hoc Tukey’s HSD test was used to assess the differences in expression of the MT1 receptor protein levels between the groups. A p-value<0.001 was considered significant in both the tests. One-way ANOVA test revealed an overall significant difference in the MT1 receptor protein levels amongst the groups [Table/Fig-6]. Furthermore, Post-hoc Tukey’s HSD test [Table/Fig-8a-d] revealed the highest levels of MT1 receptor protein levels in the PHN group which was statistically significant when compared to the other three groups (p<0.001). The lowest levels of MT1 receptor protein were observed in the PHS group which was statistically significant when compared to the PHN and NCP groups (p<0.001) but not when compared to the SCP group (p>0.05).
Mean MT1 receptor protein levels in the gingival tissue samples of the study participants. PHN-periodontally healthy non smokers, NCP-Non smokers with Chronic generalised Periodontitis, PHS-periodontally healthy current smokers, SCP-current Smokers with Chronic generalised Periodontitis (n=15 in each group). One-way ANOVA test performed with level of significance set at p<0.05.
| Variable measured | PHN | NCP | PHS | SCP | F test ratio df | p-value |
|---|
| Mean MT1 receptor protein levels (%) | 60.59±5.18 | 37.47±2.94 | 5.48±1.69 | 11.63±2.23 | 59.204 | p<0.05 |
*denotes significant
MT1-Melatonin Receptor 1
Comparison of MT1 receptor protein levels in the gingival tissue samples between the study groups. PHN-periodontally healthy non smokers, NCP-Non smokers with Chronic generalised Periodontitis, PHS-periodontally healthy current smokers, SCP-current Smokers with Chronic generalised Periodontitis, (n=30 in each group). SE denotes Standard Error, Post-hoc Tukey’s HSD test performed with level of significance set at p<0.05.
| Dependent Variable | Group | Group | Mean Difference±SE | p-value | 95% Confidence Interval |
|---|
| Lower | Upper |
|---|
| MT1 Protein | PHN | NCP | 23.12±4.65 | p<0.001 | 10.79 | 35.45 |
| PHS | 55.11±4.65 | p<0.001 | 42.78 | 67.44 |
| SCP | 48.96±4.65 | p<0.001 | 36.63 | 61.29 |
| NCP | PHN | -23.12±4.65 | p<0.001 | -35.45 | -10.79 |
| PHS | 31.98±4.65 | p<0.001 | 19.66 | 44.31 |
| SCP | 25.83±4.65 | p<0.001 | 13.51 | 38.16 |
| PHS | PHN | -55.11±4.65 | p<0.001 | -67.44 | -42.78 |
| NCP | -31.98±4.65 | p<0.001 | -44.31 | -19.66 |
| SCP | -6.15±4.65 | 0.554 | -18.47 | 6.17 |
| SCP | PHN | -48.96±4.65 | p<0.001 | -61.29 | -36.63 |
| NCP | -25.83±4.65 | p<0.001 | -38.16 | -13.51 |
| PHS | 6.15±4.65 | 0.554 | -6.17 | 18.47 |
*denotes significant
MT1-Melatonin Receptor 1
Representative flow cytometry histograms showing MT1 receptor expression in the gingival tissue samples of the PHN (8a), NCP (8b), PHS (8c) and SCP (8d) groups.
FLH-Flow cytometry Histograms, MT1-Melatonin Receptor 1, PHN-periodontally healthy non smokers, NCP-Non smokers with Chronic generalised Periodontitis, PHS-periodontally healthy current smokers, SCP-current Smokers with Chronic generalised Periodontitis
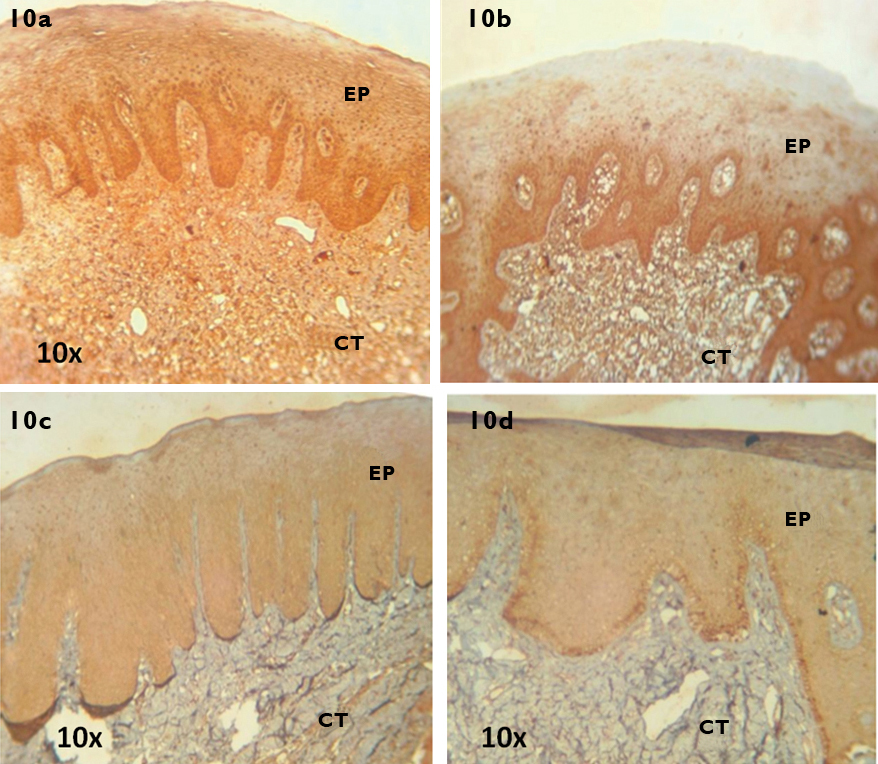
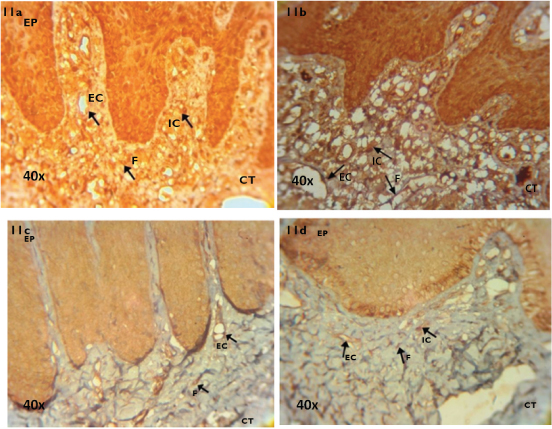
With regard to the immunohistochemical staining, Human brain tissue was used as positive control and stained positive for MT1 receptor [Table/Fig-9]. In the PHN group, intense staining was observed in all layers of the gingival epithelium and the fibroblasts, endothelial lining of blood vessels and resident inflammatory cells in the connective tissue. [Table/Fig-10a (10X) and 11a (40X)]. In the NCP group, moderate staining was observed in the basal and suprabasal layers of the gingival epithelium and the fibroblasts, endothelial lining of blood vessels and the infiltrating inflammatory cells in the connective tissue [Table/Fig-10b (10X) and 11b (40X)]. In the PHS group, weak staining was observed in all layers of the gingival epithelium and the fibroblasts and endothelial lining of blood vessels in the connective tissue [Table/Fig-10c (10X) and 11c (40X)]. In the SCP group, weak staining was observed in all layers of the gingival epithelium and the fibroblasts, endothelial lining of blood vessels and scattered inflammatory cells in the connective tissue [Table/Fig-10d (10X) and 11d (40X)].
Immunohistochemical localisation of MT1 receptor in brain tissue sample (40X).

Immunohistochemical localisation of MT1 receptor in tissue samples (10X) of PHN (10a), NCP (10b), PHS (10c) and SCP (10d) groups. Ep denotes Epithelium and Ct denotes Connective tissue.
MT1-Melatonin Receptor 1, PHN-periodontally healthy non smokers, NCP-Non smokers with Chronic generalised Periodontitis, PHS-periodontally healthy current smokers, SCP-current Smokers with Chronic generalised Periodontitis
Immunohistochemical localisation of MT1 receptor in tissue samples (40X) of PHN (11a), NCP (11b), PHS (11c) and SCP (11d) groups.
EP-Epithelium, CT-Connective Tissue, IC-Inflammatory Cells, EC-Endothelial Cells, F-Fibroblasts MT1-Melatonin Receptor 1, PHN-periodontally healthy non smokers, NCP-Non smokers with Chronic generalised Periodontitis, PHS-periodontally healthy current smokers, SCP-current Smokers with Chronic generalised Periodontitis
Discussion
The present study gives a preliminary insight into the role of the human gingiva as an extrapineal site of melatonin biosynthesis. The presence of melatonin as a free radical scavenger in saliva and plasma has been previously documented by studies that have shown lowered levels of melatonin in saliva and gingival crevicular fluid of patients with chronic periodontitis compared to healthy subjects [21,22]. A previous study has also showed the presence of melatonin in gingival tissues [14]. The authors found lowered levels of gingival melatonin in chronic periodontitis compared to healthy individuals. The finding on lowered melatonin in periodontal disease can be explained on the basis that chronic periodontitis is an inflammatory condition in which oxidative stress plays a major role. The presence of free radicals and reactive oxygen species in higher amounts compared to antioxidants in diseased compared to healthy periodontium has been previously documented [23]. In this regard, melatonin could serve as a potent radical scavenger and could hence, be depleted in diseased periodontal tissues compared to healthy tissues.
Based on the available literature the present study was planned to investigate if the gingival tissues synthesise melatonin. The present study was performed on current smokers and non smokers with and without chronic generalised periodontitis. Smokers were included in the study group as smoking is a significant risk factor for chronic periodontitis and is associated with a jeopardised oxidant-antioxidant balance and could probably affect melatonin biosynthesis. The results of the RT-PCR analysis revealed that all the gingival samples expressed the genes coding the enzymes AANAT and HIOMT. MT1 gene expression was evident in all the samples while MT2 gene was absent in all the samples assayed. With regard to the AANAT gene, highest levels were found in Group 1 (PHN) while lowest levels were found in Group 4 (SCP). These findings were statistically significant. AANAT expression in Group 2 (NCP) and Group 3 (PHS) were lower than Group 1, however no statistical significance was observed. With regard to AANAT, several significant studies have shown that it is a significant rate limiting enzyme in melatonin biosynthesis [24-26]. AANAT levels were found to correlate with pineal melatonin levels in these studies proving the significant role of AANAT in melatonin biosynthesis. In the present study higher AANAT gene levels in Group 1 compared to the other three groups could be explained on the basis that both periodontal inflammation and smoking could alter the expression of AANAT. With regard to HIOMT gene expression, highest levels were found in Group 1 and lowest levels were found in Group 4. In Group 2 the HIOMT levels were lower than Group 1 and Group 3. These values were also statistically significant. However, no significant difference was observed between Group 2 and Group 3. HIOMT is also described in predominant studies as a rate limiting enzyme in melatonin biosynthesis. In a study on Siberian hamsters, it was observed that melatonin levels correlated with HIOMT levels but not significantly with AANAT levels [27]. In another study, using a genetic Long Evans Cinnamon (LEC) rat mutant model, it was examined that a point mutation in the AANAT gene leads to a change in a conserved histidine residue to tyrosine at position 28 of the polypeptide chain. This resulted in low stability of the AANAT protein and reduced its activity by 90%. In comparison to the LEC rats, their wild counterparts (Long evans rats) had significantly high AANAT activity. However, melatonin levels were not different in the two rat groups showing that HIOMT could be the significant rate limiting enzyme in melatonin biosynthesis [28]. In the present study, HIOMT gene levels were higher in health and lower in both inflammation and smoking. Both these factors could modulate and reduce the expression of HIOMT. These results are concurrent with the findings of a previous study which found positive expression of AANAT and HIOMT by RT-PCR and Immunohistochemistry in the rat submandibular gland [13]. Presence of the enzymes AANAT and HIOMT have also been shown in several extrapineal sites like the Retinal Pigment Epithelium cells (ARPE-19) and human thymic tissue [11,29]. With regard to melatonin receptor gene expression, the MT1 receptor gene was expressed in all the samples while none of the samples expressed the MT2 receptor gene. These finding are concurrent with a previous study which found predominant expression of MT1 receptor gene in the buccal mucosa of rats [13]. However, another study showed the presence of both MT1 and MT2 receptors in rat and human salivary glands by immunoblotting and immunohistochemistry methods. In this study too, a higher reactivity to MT1 and a lower intensity of MT2 expression was seen showing that MT1 receptor could be the predominant type in oral tissues [30]. In connection to the MT1 gene, highest levels were found in Group 1 and lowest levels in Group 3. These values were statistically significant. The MT1 gene levels were significantly lower in Group 3 compared to Group 1 and 2 but not when compared to Group 4. It is possible that smoking and periodontal inflammation could alter MT1 gene expression. To confirm and quantify the MT1 receptors at the protein level, flow cytometry experiment was performed in freshly obtained gingival tissue samples. It was found that Group 1 had highest MT1 receptor levels and Group 3 had lowest MT1 receptor levels. These values were statistically significant. Group 3 had significantly lower MT1 receptor levels compared to Group 2 but not when compared to Group 4. In connection to MT1 receptor the flow cytometry results correlated positively with the MT1 gene expression confirming the genetic findings at the protein level. Further immunohistochemical staining of gingival tissue samples to detect MT1 receptor was done as a qualitative experiment. These results revealed that in Group 1 there was intense staining in the epithelium and connective tissue, while in Group 2 there was moderate staining. In Group 3 and 4 weak staining was observed in the epithelium and connective tissue compartments. The immunohistochemical staining results also showed the influence of smoking and periodontal inflammation on the MT1 receptor. This study has thrown light on the influence of tobacco smoking and periodontal inflammation at a genetic and protein level on the biosynthesis of potent antioxidants such as melatonin.
Limitation
The limitations of the study include the fact that enzymes involved in melatonin biosynthesis have been evaluated only at the genetic level and not at the protein level. Such proteomic studies are required in the future. Clinical studies employing melatonin as a pharmacological and host modulatory agent in the management of periodontal disease in smokers need to be performed in the future to exploit the protective benefits of melatonin on periodontal homeostasis.
Conclusion
The present study demonstrated that the gingiva is an extrapineal site of melatonin biosynthesis. Further, the presence of MT1 receptors in the gingiva confirms that melatonin could exert receptor mediated effects on the gingiva. The reduction in AANAT, HIOMT and MT1 gene levels in smokers with and without disease and the reduced MT1 protein levels in the gingival tissues of smokers demonstrates the molecular and genetic effects of smoking on potential antioxidants and cytoprotective molecules such as melatonin.
*denotes significant
BOP-Bleeding On Probing, PI-Plaque Index
*denotes significant
AANAT-N-Acetyl Transferase, HIOMT-Hydroxyindolyl-O-Methyltransferase, MT1-Melatonin Receptor 1, MT2-Melatonin Receptor 2
*denotes significant
AANAT-N-Acetyl Transferase, HIOMT-Hydroxyindolyl-O-Methyltransferase, MT1-Melatonin Receptor 1
*denotes significant
MT1-Melatonin Receptor 1
*denotes significant
MT1-Melatonin Receptor 1