Alcoholic beverages are one of the major causes of disease burden globally. According to the World Health Organization (WHO), alcohol ingestion is responsible for approximately 2.5 million deaths per year globally. Of all those deaths, people aged 15 to 29 years account for about 3,20,000 deaths [1]. In the recent times, there has been a rapid and significant increase in per capita consumption of alcohol especially in the developing countries of the Asian continent [2].
Liver disease related to alcohol is one of the major complications of alcoholism [3]. The spectrum of ALD consists of three major lesions: (1) fatty liver, (2) alcoholic hepatitis, and (3) cirrhosis. Normally, two or more such sub-types coexist. Fatty liver is present in more than 90% of binge and chronic drinkers. A smaller percentage of heavy drinkers progress to alcoholic hepatitis which may in turn lead to cirrhosis. The prognosis of severe ALD is very poor. The mortality of patients with alcoholic hepatitis concurrent with cirrhosis is nearly 60% at four years [4].
The major underlying cause of ALD is hepatocyte death induced by alcohol itself. ALD is a result of interaction of different immune responses, as liver is an organ rich in different cells of the immune system. The role of lymphocytes in ALD has been the subject for different lines of research with variable results. Lymphocytes together with neutrophils, macrophages, and plasma cells are present as lobular inflammatory infiltrate in alcoholic steatohepatitis [5]. Lymphopenia and altered ratio of CD4 and CD8 lymphocyte subsets in peripheral blood of patients of ALD was described in few studies but the results were not uniform [6]. Similarly, Th17 lymphocytes, a subpopulation of CD4 cells, are found to be more populous in ALD and their increased numbers are associated with fibrosis [7]. So, there is a scope that these lymphocyte markers in peripheral blood can be used for staging of ALD and its prognostication. This study was attempted in a high prevalence region for alcoholism like North Eastern India, to compare the lymphocyte subsets between ALD patients and healthy controls and to study its utility as a non-invasive prognostic marker of ALD.
Materials and Methods
This case-control study was conducted in the Department of Pathology, North Eastern Indira Gandhi Regional Institute of Health and Medical Sciences, Shillong, for a period of 16 months (April 2014 to July 2015). The study complied with the ethical standards prescribed by the Declaration of Helsinki, and Institutional Ethical Committee approval was obtained prior to the onset of the study.
A total of 40 patients, diagnosed with ALD clinically, were included as cases and an equal number of age and sex matched healthy controls, without any history of alcoholism or ALD, or any other hepatic lesion were included as control in the study. The initial diagnosis of the cases was based on clinical signs and symptoms and a history of alcoholism. Patients had history of average daily intake of 40 to 80 mL of alcohol for minimum 10 years. The patients had range of symptoms from upper abdominal pain, nausea, jaundice, anorexia, and malaise to ascites, variceal bleeding or encephalopathy. The diagnosis was confirmed by abdominal Ultrasonography (USG) and Liver Function Test (LFT). Patients with associated disorders like diabetes mellitus, HIV, tuberculosis, cholecystitis or biliary disease and patients on cancer chemotherapy or any immunosuppressant drug were excluded from the study. These conditions may alter the lymphocyte subset ratio of the patient independent of the underlying ALD and may confound the results.
The evaluation of the stage of liver disease was established with the help of USG. Histopathological grading of the liver lesions was planned, but could not be done in any of the cases, owing to the safety profile of the patients. The ALD patients were divided into three categories, viz., fatty liver, chronic hepatitis and cirrhosis, based on the USG findings [8,9]. Other biochemical parameters for liver function which were evaluated included total serum protein, Albumin/Globulin (A/G) ratio, Alanine Transaminase (ALT), Aspartate Transaminase (AST), and bilirubin.
Peripheral Blood Analysis
Peripheral blood of the cases and controls was collected in Ethylenediaminetetraacetic Acid (EDTA) test tubes. The sample was processed within one hour of sample collection. Absolute lymphocyte counts were determined using Sysmex XS800i hematology analyser (Kobe, Japan).
Flow Cytometric Analysis
It was done to determine the T lymphocyte subsets using FACSCalibur (Beckton Dickinson, San Jose, CA, USA). Calibration was done using BD Calibrite TM 3 beads (Beckton Dickinson, San Jose, CA, USA). The subsets of lymphocytes that were measured included CD3, CD4, CD8 and Th17. The relative proportions of the major lymphocyte subpopulations, i.e., CD4 and CD8 were determined using the standard protocol. Fluorescent tagged antibodies against CD45, CD3, CD4 and CD8 were utilised for the same. The following conjugated antibodies were used: anti-CD3-FITC, anti-CD4-APC, anti-CD4-PerCP, anti-CD8-PE, anti-CD45-PerCP (Beckton Dickinson, San Jose, CA, USA).
For the measurement of Th17 cells, those cells expressing IL-17 were counted as Th17 cells. IL-17 is a signature cytokine produced by Th17 cells. For this purpose, an antibody cocktail was used where IL-17 and CD4 were two of the components conjugated with the fluorochromes PE and PerCP respectively (Beckton Dickinson, San Diego, CA, USA). A 1 mL sample was taken in a test tube to which 4 μL of BD Golgi-stop (a protein transport inhibitor) was added, and incubated in dark for five hours. The sample was centrifuged at 250 g for 10 minutes at room temperature, followed by addition of 1 mL of cold BD Cytofix fixation buffer and incubation of 10-20 minutes at room temperature. The sample was again centrifuged at 250 g for 10 minutes, washed twice in sheath fluid and centrifuged again at 250 g for 10 minutes. The cells were permeabilised by suspending the cells in 1 mL of 1 × BD Perm/Wash buffer and incubated for 15 minutes. The sample was then centrifuged at 250 g for 10 minutes supernatant was removed and 50 μL of BD Perm/Wash buffer and 20 μL of antibody cocktail were added. The sample was incubated at room temperature for 30 minutes in the dark. Cells were protected from light throughout the staining procedure and storage. After the incubation, the cells were washed twice with 1 mL of 1 × BD Perm/Wash buffer and suspended in 1 mL sheath fluid prior to analysis.
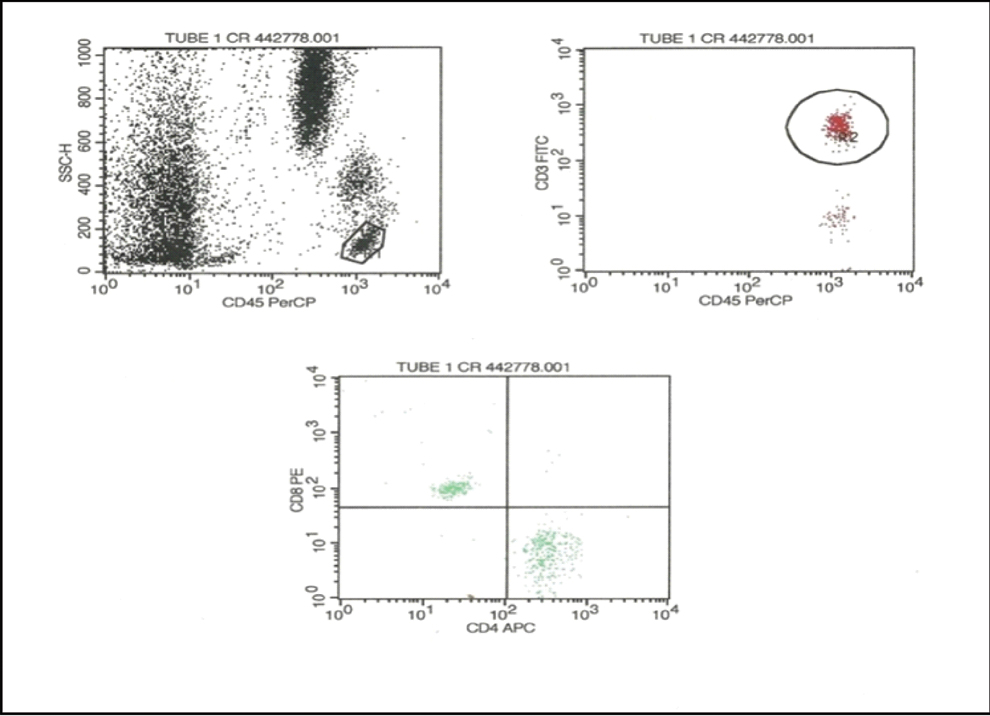
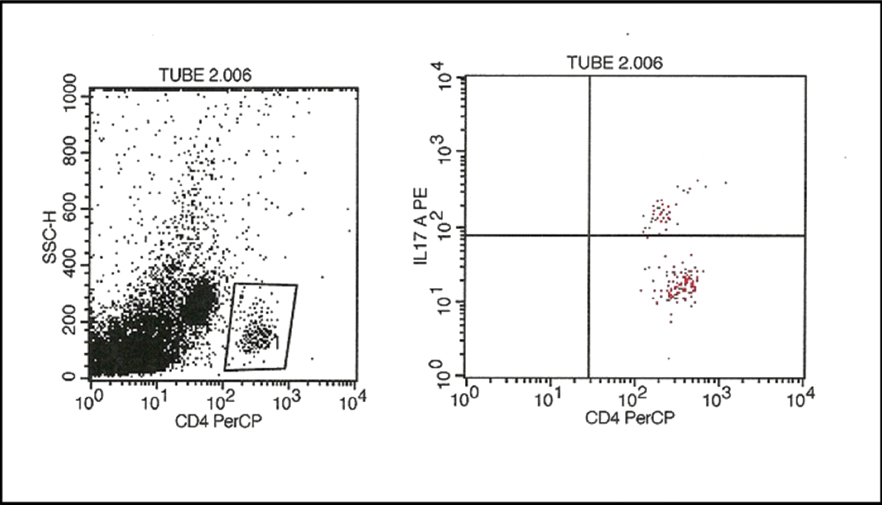
The lymphocyte population was identified in a CD45/side scatter dot plot. The T lymphocyte population was identified on the basis of CD3 positivity. The CD3 positive population was gated and analysed in a CD4/CD8 dot plot and the numbers of CD4 and CD8 cells were counted. For IL-17 analysis CD4 cells were gated and analysed in IL-17/CD4 dot plot and the percentage of IL-17 cell was measured [Table/Fig-1,2].
Flow cytometric analysis of CD4 and CD8 cells. Initially, the lymphocyte population was gated in a CD45/side scatter plot. From the lymphocytes, the CD3+ T cells were gated. Subsequently, the CD4 and CD8 cell populations were identified.
Flow cytometric analysis of IL-17 (Th17). Initially, the CD4 lymphocyte population was gated in a CD4/side scatter plot. From the CD4 lymphocytes, the Th17cells were identified by their expression of IL-17.
Statistical Analysis
Statistical analysis was performed using SPSS statistics version 22.0 (IBM). Liver function parameters and the lymphocyte subsets were measured across various categories of ALD and controls using one way Analysis of Variance (ANOVA) test. These tests were considered to be statistically significant when their p-values were <0.05 and extremely significant for values <0.001. Receiver operating characteristic (ROC) curve was generated to define the optimal cut-off point for IL-17 to distinguish cirrhosis from other categories of ALD and alcoholic hepatitis from fatty liver cases, and to analyse the utility of IL-17 as a predictive marker for progression of ALD.
Results
All the cases in the study were male and the age varied from 28 years to 65 years with mean age of 43.4±9.85 years. The clinical and laboratory data of the patients and healthy controls are shown in [Table/Fig-3].
Comparison of laboratory parameters between alcoholic liver disease cases with controls.
| Parameters | Control(n=40) | Fatty Liver(n=13) | ChronicHepatitis(n=19) | Cirrhosis(n=8) | p-value |
|---|
| Haemoglobin (g/L) | 12.17±1.19 | 10.01±2.78 | 9.58±2.04 | 8.12±3.35 | 0.0064 |
| Platelets (× 109/L) | 221.0±69.9 | 227.3±100.5 | 231.6±85.6 | 166.2±32.9 | 0.002 |
| WBC (× 109/L) | 7.9±1.5 | 7.8±2.6 | 11.9±6.7 | 8.6±4.8 | 0.0012 |
| Lymphocyte (× 109/L) | 2.36±0.46 | 1.74±0.51 | 1.53±0.77 | 1.11±0.71 | 0.0014 |
| CD3 (× 109/L) | 1.75±0.39 | 1.24±0.36 | 1.18±0.58 | 0.84±0.48 | 0.0022 |
| CD4 (× 109/L) | 1.08±0.28 | 0.58±0.20 | 0.53±0.28 | 0.47±0.30 | <0.001 |
| CD8 (× 109/L) | 0.55±0.12 | 0.44±0.16 | 0.41±0.21 | 0.24±0.12 | 0.0042 |
| CD4/CD8 ratio | 1.93±0.25 | 1.36±0.40 | 1.30±0.34 | 1.84±0.36 | <0.001 |
| IL-17 (% of CD4) | 0.38±0.35 | 1.57±1.38 | 4.36±3.38 | 9.78±3.26 | <0.001 |
| Albumin (g/dL) | 3.95±0.62 | 3.36±1.05 | 2.41±0.59 | 2.17±0.65 | <0.001 |
| Albumin/Globulin ratio | 1.48±0.20 | 1.38±0.56 | 0.63±0.27 | 0.53±0.18 | <0.001 |
| Serum bilirubin (mg/dL) | 1.06±0.25 | 3.39±4.41 | 7.34±8.75 | 4.45±5.13 | 0.0022 |
*Statistical test used- ANOVA
Abdominal USG diagnosed 13 cases as fatty liver, 19 cases as chronic hepatitis and eight cases as cirrhosis. Difference in the A/G ratio across the various categories was found to be statistically significant.
The mean value of ALC was 1.11×10⁹/L±0.71×109/L in cirrhosis, 1.53×10⁹/L±0.77×109/L in chronic hepatitis, and 1.74×10⁹/L±0.51×109/L in fatty liver, compared to 2.36×10⁹/L±0.46×109/L in control. Though no statistical difference was seen between different categories of ALD, significant difference between advanced ALD cases (cirrhosis and chronic hepatitis) and control was observed (p-value 0.0014) [Table/Fig-4].
Lymphocyte subsets in patients and controls. Mean value of absolute lymphocyte count and its subsets CD3, CD4, CD8 (per cubic millimetre of blood). ALC: Absolute lymphocyte count.
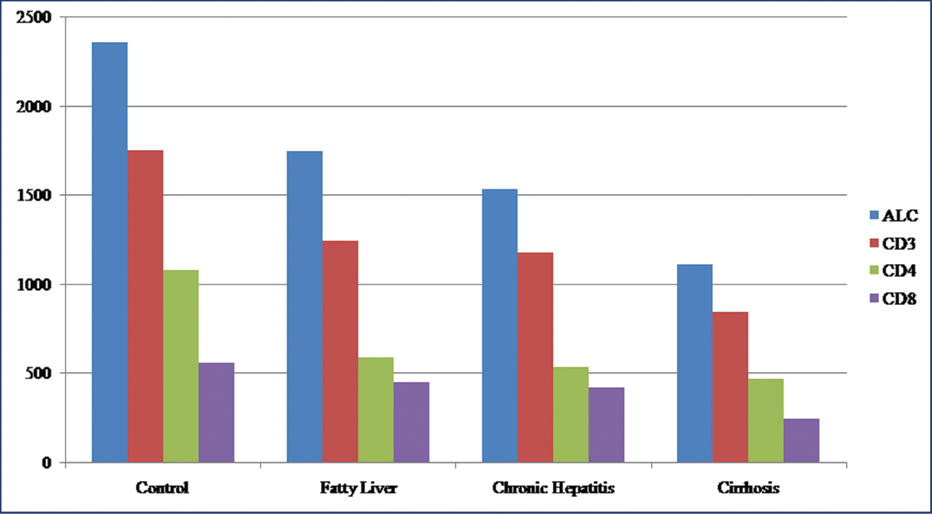
CD3 positive cells represented the T cell subpopulation of lymphocytes. Their counts were decreased in ALD patients in comparison to controls with mean value of 1.24×10⁹/L±0.36×109/L in fatty liver, 1.18×10⁹/L±0.58×109/L in chronic hepatitis, 0.84×10⁹/L±0.48×109/L in cirrhosis as compared to 1.75×10⁹/L±0.39×109/L in controls. The decrease in CD3 count was found to be extremely significant (p-value 0.0022) amongst different categories of ALD as well as between all ALD cases and controls.
CD4 and CD8 subsets of T lymphocytes were decreased in ALD patients in comparison to healthy controls. CD4 counts were progressively lower with increasing severity of ALD. The mean CD4 count was 1.08×10⁹/L±0.28×109/L in controls, 0.58×10⁹/L±0.20×109/L in fatty liver, 0.53×10⁹/L±0.28×109/L in chronic hepatitis and 0.47×10⁹/L±0.30×109/L in cirrhosis. Similar trend has been noticed with CD8 counts with mean value of 0.44×10⁹/L±0.16×109/L in fatty liver, 0.41×10⁹/L±0.21×109/L in chronic hepatitis and 0.24×10⁹/L±0.12×109/L in cirrhosis. The mean CD8 count in controls was 0.55×10⁹/L±0.12×109/L.
Ratio of CD4/CD8 cells showed comparable values between fatty liver 1.36±0.40 and chronic hepatitis 1.30±0.34. However, increased value was seen in cirrhosis 1.84±0.36. Controls showed a value of 1.93±0.25. Statistical significance was observed between the cirrhosis group and the other two groups namely fatty liver and chronic hepatitis with respect to the CD4/CD8 ratio.
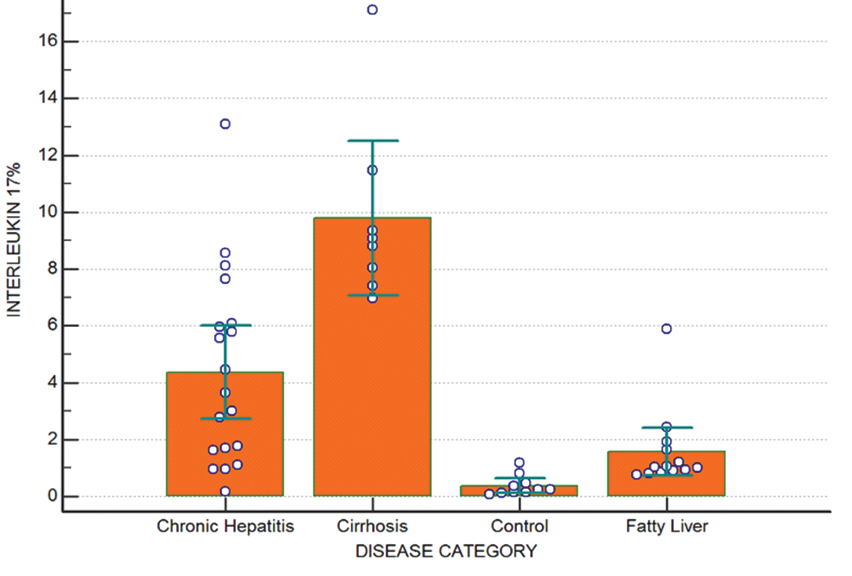
IL-17 positive cells are a distinct subpopulation of CD4 cells, the Th17 cells. It showed an increased value with increased severity of ALD. The mean percentage of IL-17 positive CD4 cells in controls was 0.38±0.35, while the means of fatty liver, chronic hepatitis and cirrhosis were 1.57±1.38, 4.36±3.38 and 9.78±3.26 respectively. Extremely significant statistical correlation was found across all categories of ALD and between ALD and controls with increasing trends observed for IL-17 with advancing ALD (p-value <0.001) [Table/Fig-5].
IL-17% in patients and controls. It shows the mean percentage of CD4 cells expressing IL-17 (Th17 cells).
To determine the utility of IL-17 as a marker of advanced stage of ALD, ROC curves were generated as already described. Optimal cut-off value of IL-17 subset of the T lymphocyte for distinguishing cirrhosis from other category of ALD was >6.07% with sensitivity of 100% and specificity of 87.5%, and this value was found to be extremely significant (p<0.001). IL-17 value of 2.44% can be taken as cut-off for predicting progression into advanced stage of ALD (cirrhosis and chronic hepatitis) from fatty liver with sensitivity of 74.1% and specificity of 92.3% and significant p-value (p<0.001). Similar comparisons were made between the healthy controls and all the cases of ALD and IL-17 level of >0.82% was found to be the optimal cut-off for ALD with sensitivity of 92.5% and specificity of 90.0%.
If the disease groups were segregated into cirrhosis and chronic hepatitis/fatty liver, an IL-17% cut-off of 6.07% was generated by the ROC curve. Based on this cut-off, the cases were divided as mentioned below. The results showed that 62% of the cases with IL-17% level above 6.07% had cirrhosis and none of the case with IL-17% below 6.07% had cirrhosis, whereas all the cases (100%) with IL-17% below 6.07% had either fatty liver or chronic hepatitis.
If the disease groups were segregated into cirrhosis/chronic hepatitis and fatty liver, an IL-17% cut-off of 2.44% was generated by the ROC curve. It was seen that 91% of the cases with IL-17% level above 2.44% had either cirrhosis or chronic hepatitis, compared to 39% of the cases with IL-17% below 2.44%, whereas 61% cases with IL-17% below 2.44% had milder disease in form of fatty liver compared to 9% who had severe disease.
The relative risk of development of cirrhosis or chronic hepatitis at IL-17% of more than 2.44% was found to be 2.34 (95% CI: 1.29-4.23).
Discussion
Liver is a major organ with diverse spectrum of functions including metabolic, synthetic and immune functions. ALD affects all aspects of liver function. These deranged liver functions are reflected by various biochemical parameters. Significant changes with respect to different ALD categories as well as between ALD patients and controls were most markedly noted in serum protein levels. Serum albumin is exclusively synthesised by hepatocytes. It has a long half-life of 18-20 days. So, hypoalbuminemia reflects a state of chronic liver disorder like chronic hepatitis and cirrhosis. Serum globulins are a group of proteins made up of α, β and γ globulins. The γ globulins are increased in chronic liver disease, such as chronic hepatitis and cirrhosis. This is due to the increased synthesis of antibodies, some of which are directed against intestinal bacteria [10]. Because of that albumin globulin ratio is altered in chronic liver disease. Matos LC et al., in their study found a significant decrease in the A/G ratio of ALD patients in comparison to healthy controls [6]. In the present study, similar results were found with significant decrease in A/G ratio in chronic ALD patients in comparison to fatty liver and healthy controls.
Previous studies related to lymphocytes in ALD patients have shown variable results. Lymphopenia in alcoholic cirrhosis patients was first described by Couzigou P et al., [11]. They also found an increased CD4/CD8 ratio in those patients. Matos LC et al., also found similar results with lymphocyte counts of (1.5±0.5)×109/L in alcoholic patients in comparison to (2.1±0.5)×109/L in controls with a p-value of <0.001 [6]. They noted a decrease in CD3, CD4 and CD8 cell counts in ALD patients and increased CD4/CD8 ratio only in patients in the cirrhosis stage. A later study reported no change in the total lymphocyte count, but did find an increased CD4/CD8 ratio in ALD patients [12]. Cook RT et al., found an increase in the number of T lymphocytes in alcoholic patients without liver disease which is mainly due to an increased number of activated CD8 cells [13]. Similarly, Arosa FA et al., reported a relative increase of some CD8 lymphocyte subtypes in alcoholic patients compared to healthy control; however there was no significant difference for total CD4 or CD8 T lymphocyte counts [14]. Naude CE et al., did a similar study in adolescent alcoholics and found a significantly lower mean number of circulating total lymphocytes, CD3, CD4, and CD8 T lymphocytes. However, there was no significant difference in the CD4/CD8 ratio [15]. Other studies had identified significant lymphopenia in ALD patients [16,17].
In the present study, ALC showed a steady decline in patients of ALD starting from fatty liver to cirrhosis in comparison to controls. Similarly CD3, CD4 and CD8 subsets of T lymphocytes were decreased in ALD patients in comparison to healthy controls. The CD4/CD8 ratio which showed an increased value in cirrhosis cases in comparison to healthy controls, fatty liver and chronic hepatitis was attributed to disproportionate decrease in CD8 cells in comparison to CD4 cells. This decrease in CD8 levels may be due to sequestration at the site of hepatic lesion. In previous studies involving murine models, fibrosis is found to be mediated by CD8 lymphocytes induced activation of hepatic stellate cells [18, 19].
In alcoholic patients, there is overgrowth of lipopolysaccharide (LPS) secreting gram negative bacteria in intestine. These LPS endotoxins are implicated in pathogenesis and progression of ALD. These endotoxins along with the toxic metabolites of alcohol decrease lymphoid cell number by fas-mediated apoptosis of lymphoid cells which is responsible for the lymphocytopenia [20].
Alcoholic liver disease is accompanied by a severe secondary inflammation which follows the initial phase induced by toxic metabolites derived from the degradation of ethanol by cytochrome CYP2E1 [21]. The extent of subsequent liver damage is directly influenced by the severity of inflammation [22]. Degradation of ethanol by cytochrome P4502E1 induces PPARα signalling as well as formation of Reactive Oxygen Species (ROS) along with activation of TNFα production and TRAIL-mediated hepatocyte apoptosis [23].
T cells play a major role in the inflammatory response following alcohol induced liver injury. They show high activity by secretion of a variety of inflammatory cytokines such as IL-1β, IL-6, and TNFα, as described in vitro after isolation of these cells [24]. A large number of neutrophils are also found in such lesions which invade the liver tissue [25, 26].
IL-17 producing Th17 cells were discovered as a separate subgroup of T helper cells in 2005. Since then, there is growing evidence of Th17 cells involvement in ALD.
Lemmers A et al., in their study demonstrated a close correlation between the number of neutrophils and Th17 cells in the inflammatory infiltrates in liver of ALD cases [26]. These cases also showed increase in both IL-17 plasma titers and circulating Th17 cells.
In the present study, IL-17 was used as the surrogate marker of Th17 cells as it is the major cytokine produced by it. It was measured with the help of flow cytometry. The CD4 cells were gated in the side scatter/CD4 dot plot and the IL-17 positive cells were identified and expressed in percentage. This percentage of IL-17 positive cells was increased in ALD cases in comparison to the controls and among the ALD cases it showed an increasing trend with advancing stage of the disease. They showed a significant difference with respect to each category.
Limitation
Since, the number of cases in our study are limited and tissue diagnosis was not possible, further studies of similar nature involving biopsy needs to be carried out to validate the present findings. Moreover, as the reagents used in the study are relatively costly and there is requirement of infrastructure along with trained staff and equipments, it is still not feasible to utilise this as a routine practice in most of the set-ups.
Conclusion
Alcoholic liver disease is a multifactorial process involving complex interaction between various components of the immune system with elaboration of many cytokines. Analysis of these markers can help us to better understand the underlying pathologic mechanism, to predict the course of the disease and to find therapeutic intervention. Lymphocytes and its subpopulation of CD3, CD4 and CD8 were decreased in ALD patients in comparison to controls, signifying an immune dysregulation. T helper cells 17 percentage is increased with each advancing stage of ALD. The results emphasise the fact that Th17 along with other lymphocyte subsets have a role in pathogenesis of ALD. So, their level and especially of Th17 maybe used as marker to determine the severity of the disease and can be used for its prognostication. This may help in timely intervention before the disease reaches the stage of irreversibility.
*Statistical test used- ANOVA