The term dysplasia (dys=abnormal/bad; plasia=growth) has its origin from the Greek language and literally means “disordered growth” [1]. The term ‘dysplasia’ was introduced in pathology by Reagon in 1958 in relation to cells exfoliated from lesions of the uterine cervix. In the past, epithelial dysplasia, epithelial atypia and dyskeratosis had the same connotations. Nowadays, it is considered that the first change suggestive of malignant transformation is epithelial dysplasia [1].
Various researches have shown a significant increase in vascularity (angiogenesis) during the transition from normal oral mucosa through the different degrees of dysplasia to frank invasive carcinoma [2-4]. Angiogenesis is the process of new blood vessel formation from pre-existing vascular networks by capillary sprouting [5]. It is extremely important not only in physiological conditions such as ovulation, development of corpus luteum, embryogenesis etc., but also in pathological conditions e.g., during the growth and metastasis of solid tumours, angiofibroma, arteriovenous malformation, pyogenic granuloma, psoriasis and rheumatoid arthritis [6-8]. Angiogenesis is thought to be initiated by an increase in the level of angiogenic stimuli like VEGF, angiogenin, angiotensin II, basic Fibroblast Growth Factor (bFGF) etc., and a concomitant decrease in the level of angiogenic inhibitors like angiostatin, nitric oxide, substance P, angiostatic steroids etc., in the local environment. Angiogenesis is considered to be an important phenomenon in epithelial dysplasia for the nutrition and growth of the dysplastic cells. Angiogenic factors are produced by the dysplastic cells, tumour cells, stromal cells like fibroblasts and inflammatory cells such as mast cells and macrophages. These factors are said to be responsible for progression, invasion and metastasis of the tumour [5,9-11].
VEGF is a powerful cytokine implicated in neoangiogenesis as the malignant cells are rapidly dividing and they require nutrients in higher quantities. Neovascularisation, possibly via the overexpression of VEGF helps in their sustenance. Recent studies have shown up-regulation of VEGF expression in oral tissues during the transition from normal oral mucosa to varying grades of epithelial dysplasia and then to Oral Squamous Cell Carcinoma (OSCC) [12-14].
CD34 is a heavily glycosylated type I transmembrane glycoprotein and is a member of the sialomucin family of surface molecules. It is expressed on lymphohaematopoietic stem cells, progenitor cells, small vessel endothelial cells and embryonic fibroblasts. CD34 is also determined to be an essential marker for tissue vascularisation and signifies microvascular density in the tissue [15].
The present study was undertaken to assess, compare and correlate the degree of angiogenesis in normal oral mucosa and in various grades of dysplasia by assessing the expression of VEGF and CD34 in normal oral mucosa and in the different grades of oral epithelial dysplasia. The role of angiogenesis in the biological behaviour and progression of epithelial dysplasia was also evaluated based on the above findings.
Materials and Methods
A retrospective study was carried out on 40 formalin-fixed paraffin- embedded tissue blocks comprising of 10 cases of normal oral mucosa and 30 cases of oral epithelial dysplasia histopathologically diagnosed (using H&E) and retrieved from archives of the Department of Oral Pathology IDST College, Modinagar, Uttar Pradesh, India, and from a private laboratory in Jaipur. The presence of epithelial dysplasia and its histologic grading was categorized according to the World Health Organization classification (2005) into mild, moderate and severe epithelial dysplasia [16]. The study was approved by the Institutional Ethical Committee of IDST College, Modinagar.
The tissue samples were divided into various groups:
Group 1- Normal oral mucosa (10 cases);
Group 2- Mild epithelial dysplasia (10 cases);
Group 3- Moderate epithelial dysplasia (10 cases);
Group 4- Severe epithelial dysplasia (10 cases).
The reagents {i.e., Primary anti-human rabbit monoclonal antibody VEGF, mouse monoclonal anti-human antibody CD34 and secondary conjugated polymer (Biocare Medical manufacture’s)} were stored at 2-8°C temperature in the refrigerator as per the manufacturer’s instructions.
From each paraffin embedded block, two sections of 3-4 μm thickness were cut by using semiautomatic rotary microtome (Yorko) and the sections were lifted on to the pre-coated (3- Aminopropyl triethoxy silane) slides for Immunohistochemical (IHC) staining for VEGF and CD34 antibody. After staining and mounting Dibutylphthalate Polystyrene Xylene (DPX), all the stained slides were analysed by three observers under the microscope to eliminate any subjective bias. VEGF expression was determined by IHC on the basis of localisation, intensity and area of stained cells whereas CD34 expression was observed on the basis of microvessel density.
Evaluation of VEGF Immunoreactivity
VEGF immunostaining was evaluated by a semi-quantitative scoring system as: a) Percentage of VEGF immunoreactivity; b) Intensity of staining; and c) VEGF final score. In each section, five high power light microscopic fields (400X magnification i.e., 40X objective lens and 10X ocular lens) were randomly selected. Three observers individually noted the percentage of VEGF positivity in each field and the region of staining was scored as follows:
Score 0 - no staining of cells in any microscopic field;
Score 1+ - less than 25% of tissue stained positive;
Score 2+ - between 25% and 50% of tissue stained positive;
Score 3+ - between 50% and 75% of tissue stained positive;
Score 4+ - more than 75% of tissue stained positivity.
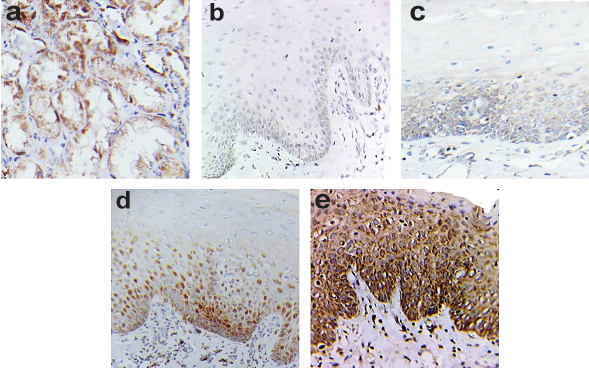
Three observers were independently recording the intensity scores by comparing it with the positive control slides (i.e., renal glomerulus) [Table/Fig-1a]. The intensity of VEGF reaction was scored as follows:
Photomicrograph showing: a) VEGF expression in renal glomerulus (positive control); b) Negative to mild VEGF immunoreactivity in the epithelium in normal oral mucosa; c) Mild VEGF immunoreactivity in basal and suprabasal layer of epithelium in mild epithelial dysplasia; d) Moderate VEGF immunoreactivity in basal and suprabasal layer of epithelium in moderate epithelial dysplasia; and e) Intense VEGF immunoreactivity occurs throughout the epithelium in severe epithelial dysplasia with diffuse and diminishing reactivity in most superficial layer of epithelium (IHC stain, 40X).
Score 0- No staining was evident;
Score 1- Mild staining when intensity was less than the positive control;
Score 2- Moderate staining when intensity was equal to the positive control;
Score 3- Intense staining when intensity was greater than the positive control.
VEGF final score was obtained by the product of percentage score (0-4) and intensity score (0-3). A VEGF final score was assessed as:
Score 0-4- Negative staining;
Score 5-12- Positive staining.
Evaluation of CD34 Immunoreactivity
The presence of brown coloured cytoplasmic staining of endothelial cells lining the lumen surfaces of blood-vessels, or clusters of endothelial cells without lumen formation which were considered as a single microvessel unit. The microvessel counting was performed using an Olympus research microscope CX41 and three observers independently recorded the microvessel count. For the determination of microvessel counting, five most vascular areas (i.e., hot spots) within a section were selected in the connective tissue adjacent to the basement membrane i.e., subepithelially and counted under a light microscope with a 400-fold magnification (i.e., 40X objective lens and 10X ocular lens). Microvessel density was calculated as their mean number per optical field.
Statistical Analysis
Data on immunohistochemical expression of VEGF and CD34 in all the tissue sections was collected and statistically analysed with the help of Statistical Package for Social Sciences (SPSS) software version 19.0 using mean, standard deviation, Analysis of Variance (ANOVA), Post-hoc Bonferroni test, Independent t-test, Pearson Chi-square test, Pearson correlation coefficient test and Cronbach’s alpha reliability test. A probability value of <0.05 was considered to be statistically significant.
Results
In all the study groups included in the present study, majority of the patients were males (82.5%) and rest were females (17.5%). The age of the patients ranged from 19-60 years with a mean of 39.08 (±12.88) years. A good interobserver reliability was found on applying Cronbach’s alpha reliability test [Table/Fig-2] to the observations obtained from all three observers for the assessment of percentage of VEGF immunoreactivity, intensity of VEGF staining and CD34 immunostaining. Thus the observations of only one observer (observer 1) were considered for all further statistical analysis.
Interobserver reliability analysis for VEGF percentage, VEGF intensity and CD34 immunostaining.
| Reliability Analysis | Cronbach’s α Test |
|---|
| CD34 | PVEGF | IVEGF |
|---|
| Observer 1 and Observer 2 | 0.997 | 0.975 | 0.993 |
| Observer 1 and Observer 3 | 0.997 | 0.984 | 0.997 |
| Observer 2 and Observer 3 | 0.996 | 0.978 | 0.992 |
PVEGF- VEGF percentage, IVEGF- VEGF intensity
a. Evaluation of VEGF Immunostaining
VEGF immunostaining was heterogeneous, diffuse, brownish and showed granular staining of cytoplasm of the epithelial cells along with a few stromal components like fibroblasts, endothelial cells, inflammatory cells, salivary glands and muscle fiber bundles. Negative to mild VEGF immunoreactivity was found in the epithelium in normal oral mucosa [Table/Fig-1b]. Mild VEGF immunolocalisation was observed in the basal and suprabasal layers of epithelium in mild epithelial dysplasia [Table/Fig-1c], whereas moderate staining intensity was determined in the basal and suprabasal layers of epithelium in moderate epithelial dysplasia [Table/Fig-1d]. Intense VEGF immunoreactivity occurred throughout the thickness of the epithelium in severe oral epithelial dysplasia with a diffuse and diminished reactivity in the most superficial layer of the epithelium [Table/Fig-1e].
Percentage of VEGF immunoreactivity: A significant difference (p=0.002) was observed in VEGF percentage between normal oral mucosa and all the sum total of oral epithelial dysplasia cases. Percentage of VEGF immunoreactivity increased during the progression from normal oral mucosa through varying grades of oral epithelial dysplasia [Table/Fig-3a].
Comparison between percentage of VEGF immunoreactivity in normal oral mucosa and in oral epithelial dysplasia.
| Group | VEGF percentage |
|---|
| Score 0 | Score 1+ | Score 2+ | Score 3+ | Score 4+ |
|---|
| Normal oral mucosa | 02 (20.0%) | 06 (60.0%) | 02 (20.0%) | 00 (00.0%) | 00 (00.0%) |
| Total dysplasia | 01 (03.3%) | 04 (13.3%) | 07 (23.3%) | 18 (60.0%) | 00 (00.0%) |
| Chi-square test | 15.348 |
| Degree of freedom (df) | 3 |
| p-value | 0.002 |
| Group | Score 0 | Score 1+ | Score 2+ | Score 3+ | Score 4+ |
| Group 1 | 02 (20.0%) | 06 (60.0%) | 02 (20.0%) | 00 (00.0%) | 00 (00.0%) |
| Group 2 | 01 (10.0%) | 02 (20.0%) | 05 (50.0%) | 02 (20.0%) | 00 (00.0%) |
| Group 3 | 00 (00.0%) | 02 (20.0%) | 01 (10.0%) | 07 (70.0%) | 00 (00.0%) |
| Group 4 | 00 (00.0%) | 00 (00.0%) | 01 (10.0%) | 09 (90.0%) | 00 (00.0%) |
| Chi-square test | 27.822 |
| Degree of freedom (df) | 9 |
| p-value | 0.001 |
| Group | VEGF percentage |
|---|
| Chi-square test | Degree of freedom (df) | p-value |
|---|
| Group 1 vs Group 2 | 5.619 | 3 | 0.132 |
| Group 1 vs Group 3 | 11.333 | 3 | 0.010 |
| Group 1 vs Group 4 | 17.333 | 3 | 0.001 |
| Group 2 vs Group 3 | 6.444 | 3 | 0.092 |
| Group 2 vs Group 4 | 10.121 | 3 | 0.018 |
| Group 3 vs Group 4 | 2.250 | 3 | 0.325 |
Group 1- Normal oral mucosa, Group 2- Mild epithelial dysplasia, Group 3- Moderate epithelial dysplasia, Group 4- Severe epithelial dysplasia
Intensity of VEGF immunostaining: There was a statistically significant difference (p=0.001) reported between VEGF intensity in normal oral mucosa and that of all the cases of oral epithelial dysplasia together. Intensity of VEGF immunostaining increased during the progression from normal oral mucosa to severe oral epithelial dysplasia [Table/Fig-3b].
Comparison between intensity of VEGF immunostaining in normal oral mucosa and in oral epithelial dysplasia.
| Group | VEGF intensity |
|---|
| Score 0 | Score 1 | Score 2 | Score 3 |
|---|
| Normal oral mucosa | 04 (40.0%) | 06 (60.0%) | 00 (00.0%) | 00 (00.0%) |
| Total dysplasia | 01 (03.3%) | 09 (30.0%) | 12 (40.0%) | 08 (26.7%) |
| Chi-square test | 16.533 |
| Degree of freedom (df) | 1 |
| p-value | 0.001 |
| Group | Score 0 | Score 1 | Score 2 | Score 3 |
| Group 1 | 04 (40.0%) | 06 (60.0%) | 00 (00.0%) | 00 (00.0%) |
| Group 2 | 01 (10.0%) | 07 (70.0%) | 02 (20.0%) | 00 (00.0%) |
| Group 3 | 00 (00.0%) | 02 (20.0%) | 07 (70.0%) | 01 (10.0%) |
| Group 4 | 00 (00.0%) | 00 (00.0%) | 03 (30.0%) | 07 (70.0%) |
| Chi-square test | 43.000 |
| Degree of freedom (df) | 9 |
| p-value | < 0.001 |
| Group | VEGF intensity |
|---|
| Chi-square test | Degree of freedom (df) | p–value |
|---|
| Group 1 vs Group 2 | 3.8777 | 3 | 0.144 |
| Group 1 vs Group 3 | 14.000 | 3 | 0.003 |
| Group 1 vs Group 4 | 20.000 | 3 | <0.001 |
| Group 2 vs Group 3 | 7.556 | 3 | 0.05 |
| Group 2 vs Group 4 | 15.200 | 3 | 0.002 |
| Group 3 vs Group 4 | 8.100 | 3 | 0.017 |
Group 1- Normal oral mucosa, Group 2- Mild epithelial dysplasia, Group 3- Moderate epithelial dysplasia, Group 4- Severe epithelial dysplasia
Evaluation of VEGF final score: A statistically significant correlation (p=0.001) was found between VEGF positivity in normal oral mucosa and the total oral epithelial dysplasia cases together [Table/Fig-3c].
Comparison between VEGF final score in normal oral mucosa and in oral epithelial dysplasia.
| Group | VEGF final score |
|---|
| Negative | Positive |
|---|
| Normal oral mucosa | 10 (100.0%) | 0 (00.0%) |
| Total dysplasia | 11 (36.7%) | 19 (63.3%) |
| Chi-square test | 12.063 |
| Degree of freedom (df) | 1 |
| p-value | 0.001 |
| Group | Negative | Positive |
| Group 1 | 10 (100.0%) | 0 (00.0%) |
| Group 2 | 9 (90.0%) | 1 (10.0%) |
| Group 3 | 2 (20.0%) | 8 (80.0%) |
| Group 4 | 0 (00.0%) | 10 (100.0%) |
| Chi-square test | 29.975 |
| Degree of freedom (df) | 3 |
| p-value | < 0.001 |
| Group | VEGF final score |
|---|
| Chi-square test | Degree of freedom (df) | p–value |
|---|
| Group 1 vs Group 2 | 1.053 | 1 | 0.305 |
| Group 1 vs Group 3 | 13.333 | 1 | < 0.001 |
| Group 1 vs Group 4 | 20.000 | 1 | < 0.001 |
| Group 2 vs Group 3 | 9.899 | 1 | 0.002 |
| Group 2 vs Group 4 | 16.364 | 1 | < 0.001 |
| Group 3 vs Group 4 | 2.222 | 1 | 0.136 |
Group 1- Normal oral mucosa, Group 2- Mild epithelial dysplasia, Group 3- Moderate epithelial dysplasia, Group 4- Severe epithelial dysplasia
A statistically significant difference (p<0.001) was noticed between VEGF final score in all the groups [Table/Fig-3c]. VEGF expression was found to be higher in oral epithelial dysplasia than in normal oral mucosa.
b. Evaluation of CD34 Immunostaining
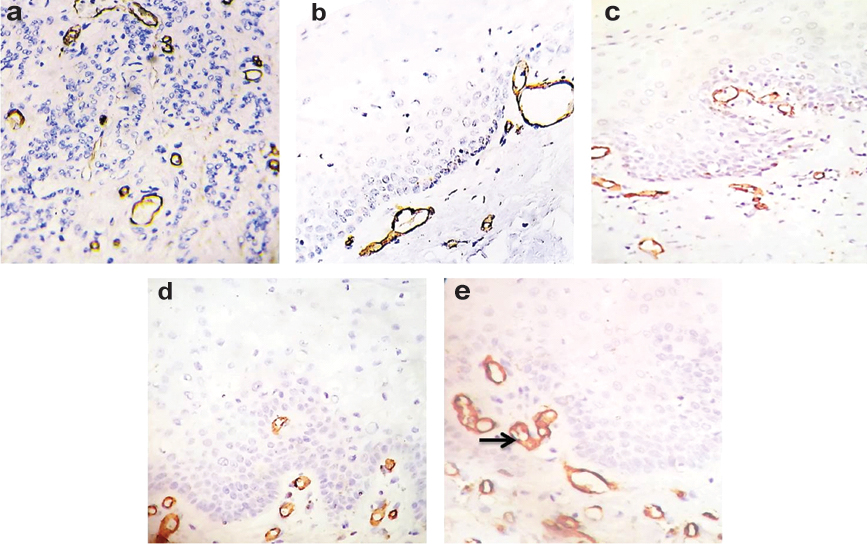
A sharp and crisp brown coloured staining was seen in the cytoplasm of CD34 positive endothelial cells of blood vessels in normal oral mucosa and in different grades of dysplasia as well as in positive control [Table/Fig-4a-d]. In severe epithelial dysplasia, capillary tufts were noticed closer to the juxtaepithelial zone [Table/Fig-4e].
Photomicrograph showing: a) CD34 positive endothelial lined blood vessels in renal fibrosis (positive control); b) CD34 positive endothelial lined blood vessels in normal oral mucosa; c) CD34 positive endothelial lined blood vessels in mild epithelial dysplasia; d) CD34 positive endothelial lined blood vessels in moderate epithelial dysplasia; and e) CD34 positive endothelial lined blood vessels in severe epithelial dysplasia, Arrow showing capillary tufting in severe epithelial dysplasia (IHC stain, 40X).
A statistically significant (p<0.001) difference was reported between the mean microvessel density in normal oral mucosa and the total number of oral epithelial dysplasia cases [Table/Fig-5].
Comparison between microvessel density in normal oral mucosa and in oral epithelial dysplasia.
| Group | Microvessel density |
|---|
| Mean | SD |
|---|
| Normal oral mucosa | 3.8400 | 0.5641 |
| Total Dysplasia | 16.9733 | 5.5233 |
| Independent t-test | 7.442 |
| p-value | < 0.001 |
| Group | Mean | SD |
| Group 1 | 3.8400 | 0.5641 |
| Group 2 | 10.5400 | 1.4698 |
| Group 3 | 17.8200 | 2.8479 |
| Group 4 | 22.5600 | 2.5626 |
| ANOVA (F) | 157.514 |
| p-value | < 0.001 |
| Group | Microvessel density {Post-hoc Bonferroni (p-value)} |
| Group 1 vs Group 2 | <0.001 |
| Group 1 vs Group 3 | <0.001 |
| Group 1 vs Group 4 | <0.001 |
| Group 2 vs Group 3 | <0.001 |
| Group 2 vs Group 4 | <0.001 |
| Group 3 vs Group 4 | <0.001 |
Group 1- Normal oral mucosa, Group 2- Mild epithelial dysplasia, Group 3- Moderate epithelial dysplasia, Group 4- Severe epithelial dysplasia, SD – Standard Deviation
c. Correlation between VEGF and CD34 Expression
A statistically significant correlation (p < 0.001) was found between VEGF and CD34 expression [Table/Fig-6].
Correlation between VEGF and CD34 expression.
| PVEGF | IVEGF |
|---|
| CD34 | r=0.726 | r=0.804 |
| p-value | <0.001 | <0.001 |
r– Correlation Coefficient, PVEGF- VEGF percentage, IVEGF- VEGF intensity
Discussion
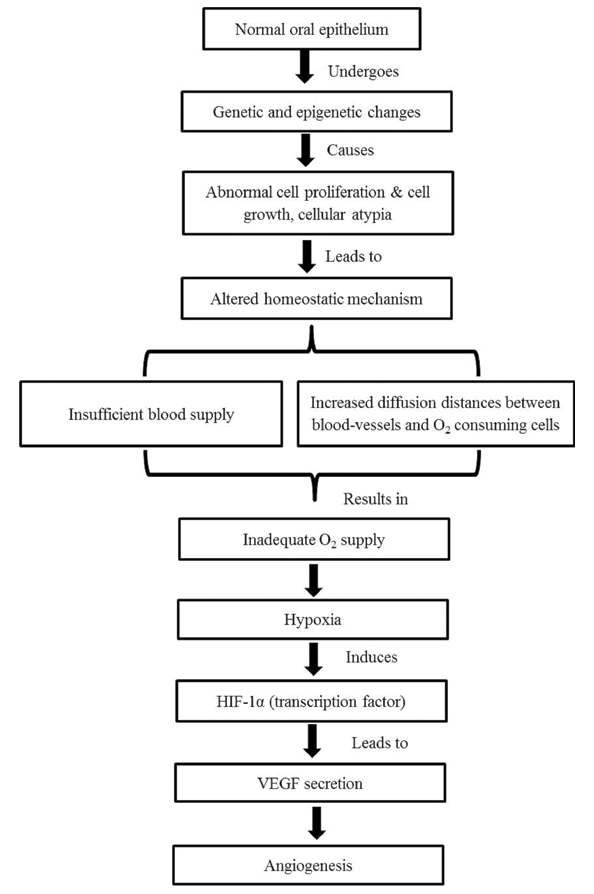
For the progression of oral epithelial dysplasia to frank carcinoma, angiogenesis i.e., the growth of new blood-vessels from the pre-existing vasculature plays an essential role. This process is dependent on the net balance between angiogenic factors like VEGF, Tumour Necrosis Factor alpha (TNF-α), bFGF etc., and antiangiogenic factors like angiostatic steroids, angiostatin, nitric oxide etc., [5,6]. The most potent angiogenic factor which acts on endothelial cells is VEGF. The primary regulator of VEGF secretion is a hypoxic microenvironment, which is mediated by the transcription factor i.e., Hypoxia Inducible Factor 1-α (HIF-1α). Increased production of VEGF stimulates angiogenesis, which in turn give rises to increased blood cells and oxygen delivery [5] [Table/Fig-7].
Possible role of vascularity in oral epithelial dysplasia.
In our study, we observed that VEGF immunostaining was heterogeneous, diffuse, brownish and showed a granular staining of the cytoplasm of epithelial cells along with a few stromal components like fibroblasts, endothelial cells, inflammatory cells, salivary glands and muscle fiber bundles. This was in agreement with the study done by Carlile J et al., and Gandolfo M et al., [3,17]. The immunolocalisation of VEGF in mild, moderate and severe oral epithelial dysplasia [Table/Fig-1c-e] in the present study was in accordance with the study carried out by Brennan PA et al., who found that the expression of VEGF in mild dysplasia was limited to the basal and suprabasal layers of the epithelium whereas in severe dysplasia, intense expression of VEGF was seen throughout the epithelium [18].
We also found that a significant (p<0.001) increase in VEGF expression both in the percentage of VEGF stained epithelial cells and in the intensity of VEGF [Table/Fig-3a-c] in oral tissues during the transition from normal oral mucosa to oral epithelial dysplasia and was in agreement with the study done by Michailidou EZ et al., [19]. This signified that the angiogenic activity in the involved tissues increased with the aggressiveness of the lesions. Amongst the dysplastic lesions observed in the present study, a significant difference (p<0.001) was found between the VEGF expression and the grade of dysplasia which was in accordance with the study carried out by Michailidou EZ et al., [19], but this was in contrast with the results obtained by Carlile J et al., Johnstone S and Logan RM, Darwish ZE and AlGhamdi AS, Astekar M et al., who all suggested that an increase in dysplasia was not inevitably accompanied by an increase in VEGF expression [3,14,20,21].
CD34 is a transmembrane glycoprotein expressed by the vascular endothelial progenitor cells at the site of active angiogenesis and determines the microvessel density (i.e., tissue vascularisation) in the tissue [15]. In the present study, a sharp and crisp brown colour was seen in the cytoplasm of endothelial cells of blood vessels in normal mucosa [Table/Fig-4b] and also in the positive control [Table/Fig-4a]. Similar expression was observed in the different grades of dysplasia [Table/Fig-4c-e] but in addition, capillary tufting was noticed in cases of severe epithelial dysplasia nearer to the juxtaepithelial zone [Table/Fig-4e]. These findings were also encountered by Siar CH et al., who reported capillary tufts both in moderate and severe dysplasia [22].
In the present study, a significant (p<0.001) increase in the vascularity [Table/Fig-5] was observed as the oral mucosa progressed from normal through the increasing grades of dysplasia and these findings were similar with the study conducted by Michailidou EZ et al., and Siar CH et al., [19,22]. These results indicated that the disease progression in the oral cavity was associated with angiogenesis.
In the present study, VEGF expression in epithelial cells correlated significantly (p<0.001) with the microvessel density [Table/Fig-6]. Our findings were not in agreement with the study obtained by Michailidou EZ et al., and Nayak S et al., who found no significant correlation between the expression of VEGF and CD34 [19,23], but findings were similar to study carried out by Astekar M et al., [21].
Hence, the alteration in the immunolocalisation of VEGF between different grades of oral epithelial dysplasia could suggest that this protein is involved in the progression of dysplasia and may culminate in the malignant transformation of the epithelium but in the present study, we could not evaluate the potential for malignant transformation of oral epithelial dysplasia. We assessed that up-regulation in the expression of VEGF and CD34 occurs as the normal mucosa progresses from normal to severe epithelial dysplasia. Thus, stating that the expression of epithelial VEGF and subepithelial vascularisation might be an additional tool for the evaluation of the severity of the lesion. Further studies on larger series of samples are necessary in order to clarify the role of VEGF and CD34 expression in oral carcinogenesis from a clinical, biological and molecular point of view.
Limitation
The limitation of this study was that the sample size was small and the study group was limited to different grades of epithelial dysplasia. In this study, we could not assess the potential for malignant transformation of oral epithelial dysplasia.
Conclusion
Oral epithelial dysplasia is a potentially malignant disorder of the oral cavity characterized histopathologically by varying degree of cytological atypia and an abnormality in the maturation of cells within a tissue. The role of angiogenesis in various physiological and certain pathological conditions is well established. In the present study, we observed that the progression of epithelial dysplasia in the oral cavity was accompanied by an increase in angiogenesis. VEGF and CD34 both are considered as potent candidates responsible for neovascularisation and our results suggest that they may play an important role in the maintenance of a blood supply for developing and progression of potentially malignant disorders.
PVEGF- VEGF percentage, IVEGF- VEGF intensity