Globally the highest number of child death is reported in India, with an estimate of 1.2 million deaths by 2015, which is 20% of the 5.9 million global deaths [1]. Unfortunately India fails to achieve its Million Development Goal (MDG-4) which was to reduce under-five mortality by two-third [2]. Mosley WH and Chen LC had developed a conceptual framework to assess child mortality in developing countries [3]. According to the framework, the proximate determinants contributing to childhood mortality are: Maternal factors (age, parity, and birth order); Environmental contamination; Nutrient deficiency and injury; Personal illness control. The framework relies on the premises that all socioeconomic factors must operate through the proximate determinants to have an impact on child survival. Study of the literature reveals that a lot of emphases have already been given to strengthen the proximate determinants, and various programmes are going on to improve the present scenario but still we are lagging far behind other countries. Only a handful studies are done considering all the proximate determinants taken together [4-6]. Unidentified heterogeneity within the framework has uniformly been ignored [4]. The present study considered domestic violence as a heterogeneity factor existing within the framework.
For the first time in Indian law the definition of "domestic violence" was given in an act called “The Protection of Women from Domestic Violence Act” [7]. Prohibition of marital rape, provision of protection and maintenance orders for domestic violence victims are key elements of domestic violence act. The victim of domestic violence in India is generally female and the accused is generally the male member of her family or relatives [8,9]. In India, according to a National Family and Health Survey in 2005, the total lifetime prevalence of domestic violence was 33.5% and 8.5% for sexual violence among women aged 15-49 [10].
Few studies observed physical abuse during pregnancy accelerates the risk of preterm labour [11] or delivery [12], low-birth offspring [13-17] and foetal distress or death [18-21]. Domestic violence and its possible effect on child survival are still not known limited literatures are available on the relationship between the two [8,13,15]. To honestly assess the effect of domestic violence on early childhood mortality, one needs to look data from undeveloped and developing countries where the prevalence of domestic violence is much higher as compared to developed world. India is one such example. Non-reporting is a leading cause contributing to domestic violence prevalence [22]. Physical violence in combination with emotional violence or they independently may have an indirect impact on child survival. There is a lack of conclusive evidence that the risk of domestic violence escalates or de-escalates during pregnancy; however, it is evident from the literature review that a significant subgroup of females in India has exposure to one or more form of domestic violence during pregnancy [23-25]. Usage of preventive or curative health services during pregnancy, delivery and after birth may vary by presence or absence of violence within the household. The present study aims to explore the social domain about domestic violence and its impact on under-five mortality in India.
Materials and Methods
Data Sources
The present study was based on NFHS-3 data, the Indian version of the Demographic and Health Survey (DHS). The third round of NFHS-3 in India was completed during 2005-06 covering a nationally representative sample of ever married women aged 15-49 years. The study type was descriptive and the study design was cross-sectional. NFHS-3 adopted a two stage sample design in most rural areas and three stage sample design in most urban areas. In rural areas at 1st stage of sampling Primary Sampling Units (PSUs) that are villages are selected, with probability Proportion to Population Size (PPS) and in second stage within each PSU the random selection of household is done. For urban areas at first stage, wards were selected using PPS sampling. In the second stage, one Census Enumeration Block (CEB) from each sample ward is randomly selected. In the final stage, the household is randomly selected within each selected CEB. Ninety-nine percent of India’s population living in all the 29 states is covered in NFHS-3. NFHS-3 covers 109,041 households, 124,385 women age15-49, and 74,369 men age 15-54. The survey provides information on domestic violence, fertility, child mortality, family planning, HIV-related knowledge, and important aspects of nutrition, health and healthcare. For the present study aggregated national data of 124,385 women having 51,555 live births and experiencing 3,551 under-five mortality was considered.
Measurement of Domestic Violence
Domestic violence is defined as ‘to include not only physical abuse, but also other forms of violence such as emotional/verbal, sexual, and economic abuse done by spouses as well as by other household members’. For the present study, only violence done by the husband was considered and it was measured by using a greatly shortened and modified Conflict Tactics Scale (CTS) [6]. The revised CTS scale measures a total of 39 behaviours. This is further divided into five categories: “Negotiation”, “Psychological Aggression”, “Physical Assault”, “Sexual Coercion” and “Injury." Each of the five categories is then subdivided into two subscales: "Negotiation" is subdivided into "Cognitive" and "Emotional", while the other four categories are subdivided into "Minor" and "Severe." There are six items in "Negotiation", eight in "Psychological Aggression," twelve in "Physical Assault," seven in "Sexual Coercion," and six in "Injury. NFHS-3 uses the following set of questions to assess physical or sexual violence:
a) Does your husband slap you?
b) Does he twist your arm or pull your hair?
c) Does he push you, shake you, or throw something at you to physically harm you?
d) Punch or kick you, drag you or beat you up?
e) Does your husband try to choke you or burn you on purpose?
f) Does he threaten or attack you with a knife, gun, or any other dangerous weapon?
g) Does your last husband physically force you to have sexual intercourse even when you did not want to?
h) Does he force you to perform any sexual acts which you did not want to do?
A ‘yes’ response to one or more of items (a) to (f) above constitutes evidence of physical violence, while a ‘yes’ response to items (g) or (h) constitutes evidence of sexual violence. Emotional violence was measured in a similar way, using the following set of questions:
a). Does your husband try to humiliate you in front of others?
b). Does he verbally threaten you to hurt or harm you or someone close to you?
c). Does your husband often insults you or make you feel bad about yourself?
Study Variables
The outcome variable was childhood mortality. It is defined as the death of a new born before his/her fifth birthday. Potential predictors related with maternal factors of child survival as summarized in the conceptual Mosley WH and Chen LC framework was considered, for the present study [3]. Maternal factors included- age at marriage, parity and birth order. Pregnancy-related variables listed in the study were-place of delivery, mode of delivery, complications during pregnancy, utilisation of Antenatal Care (ANC), child health care services. Variables pertaining to socio-demographic profile were also included in the study.
Kaplan-Meir or product limit function method was applied to examine the differentials in the child survival probabilities for a group exposed to domestic violence with the child whose mother was not at risk of any such violence. Logistic regression was used to assess the odds of violence against women with domestic violence as dependent and socio-demographic covariates and pregnancy-related variables as independent predictor variables.
Weibull Frailty Modelling Approach
The magnitude of under-five mortality hazard does not follow a particular trend (increasing or decreasing) instead it has a monotone nature i.e., it can increase or decrease with age. For example, from birth till infancy the death hazard has an exponentially decreasing function due to endogenous factors but for the period between post-infancy and childhood, the shape of the hazard is monotone in nature due to exogenous factors. This variability in the shape of hazard can be best captured using Weibull distribution [26]. Weibull distribution is the most popular distribution in survival analysis. The reason behind its wide popularity is the flexibility it allows in modelling the hazard function. The Weibull distribution can handle a variety of monotonically increasing or decreasing shape of the hazard function. The Weibull model assumes a baseline hazard of the form hD(t)=ptp-1exp(βD), where p is shape parameter estimated from the data and the scale parameter is parameterized as exp(βD). Given a set of covariates, Xj under the Proportional Hazard (PH) model (the model assumes that hazard between any two or more groups is proportional in nature), the hazard function h(t) for the set of Xj covariates is estimated as:
h(t)=hD(t)exp(Xjβx)=ptp-1exp(βD+Xjβx)...............(1)
Where:
t, is the time until the event of interest has occurred
p, is the shape parameter (if p>1 hazard is increasing, p<1 decreasing hazard and is constant for p=1).
Frailty models are extensions of the proportional hazards models. For the present study Weibull, PH model with domestic violence as shared frailty variable was studied. Vaupel JW et al., were first to introduce the term frailty [27]. For survival, data frailty provides a convenient way to address random effects, association, and unobserved heterogeneity into the model. Frailty (α) is an unobserved random proportionality factor that modifies the hazard function i.e., the hazard reported in equation (1) now becomes:
h(t|α)=α*h(t)..............(2)
The frailty α(α>0) follows some distribution generally Gamma/Inverse-Gaussian; although, the result obtained from both the distributions is similar in nature. The present study, g(α) is assumed to have gamma distribution with the mean of g(α), equal to 1 (μ=1) and variance of, g(α)= ϴ (Theta) which is evaluated from the data. Theta measures the variability of the frailties, if ϴ is non-significant, then the frailties are virtually non-existing but if it is different from zero, i.e., it’s significant, this indicates significant heterogeneity which should be addressed while model building.
Statistical Analysis
The aggregate national data of NFHS-3 was downloaded from DHS data distribution system website: http://www.measuredhs.com [28]. All the variables were read and coded using R-software (version 3.2.2, 2015). Based on the objectives of the study descriptive and inferential statistics were drawn.
Results
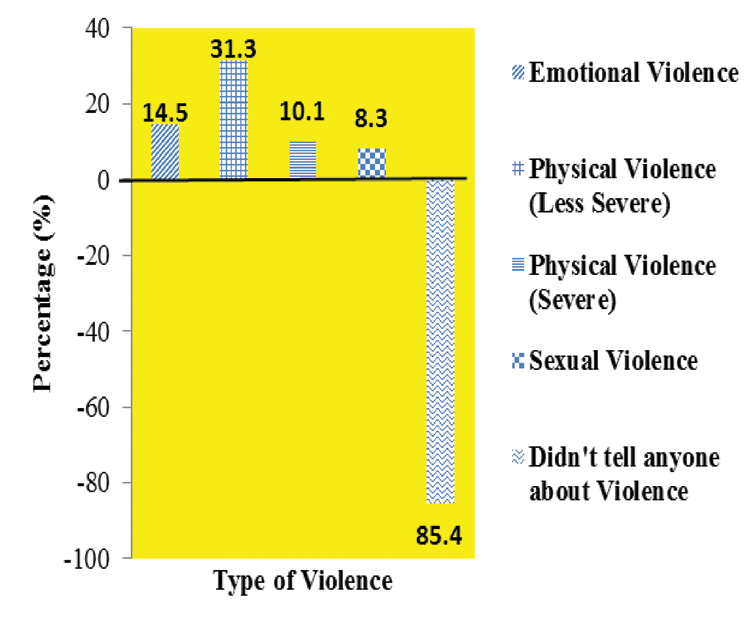
The study sample primarily consisted of younger women (mean age 29.2±9.4 years). More than half (58%) of the women were married before (mean age at marriage 17.9±3.9 SD) the legal age (18 years) of marriage in India. The majority (90%) of females had the low level of education, secondary or below, with every third woman being illiterate (32%). [Table/Fig-1] shows the percentage distribution of females exposed to the type of domestic violence. Thirty-one percent of women were exposed to some type of physical abuse where as 10% of women had faced severe physical abuse incidences. The majority 85.4% (n=17,702) of mothers interviewed did not report violence but it is not known what proportion had suffered violence but choose not to report it. [Table/Fig-2] depicts the early as well as late childhood mortality rate by exposure to violence. The most pronounced difference in mortality was in the neonatal period and in older infants. Physical violence seems to have the highest impact on childhood mortality rate followed by emotional and sexual violence.
Percentage distribution of females by type of domestic violence.
Comparison of childhood mortality rate (per thousand people at risk) by type of domestic violence exposure.
| Type of violence (95% C.I) |
|---|
| Physical violence | Emotional violence | Sexual violence |
|---|
| Mortality Period | Yes | No | Z-test(p-value) | Yes | No | Z-test(p-value) | Yes | No | Z-test(p-value) |
|---|
| Neonatal | 23.85(21.7, 26.0) | 16.91(15.7, 18.1) | 6(<0.001) | 23.32(20.2, 26.4) | 18.42(17.3,19.5) | 3.2(0.002) | 23.60(19.5, 27.7) | 18.7(17.6, 19.8) | 2.5(0.012) |
| Post-Neonatal | 19.31(17.4, 21.2) | 10.32(9.3, 11.3) | 9.3(<0.001) | 22.67(19.6, 25.7) | 11.58(10.7,12.5) | 8.6(<0.001) | 19.91(16.2, 23.6) | 12.57(11.6, 13.4) | 4.6(0.001) |
| Child* (1-4 Years) | 12.32(10.8, 13.9) | 8.21(7.3, 9.1) | 5(<0.001) | 12.11(9.9, 14.3) | 9.09(8.3,9.9) | 2.7(0.006) | 13.2(10.1, 16.2) | 9.2(8.4, 10.0) | 2.9(0.004) |
*Excluding Infancy period
Logistic regression was used to assess the odds of violence against women with domestic violence as dependent and socio-demographic covariates and pregnancy-related variables as independent variables detail results are presented via [Table/Fig-3,4]. Compared to general category, schedule caste/tribe, O.R=1.21 (1.1,1.3) and other backward class, O.R = 1.15(1.1, 1.2) population were at significantly higher risk of exposure to domestic violence. As one moves down in wealth index category from richest to poorest, the odds ratio increases from 1.00 to 3.28. Rural females have 53% (N=672220) more risk of in-house physical violence, O.R=1.53 (1.4,1.6) compared to urban females. An illiterate woman has almost (O.R=3.83) four times higher risk of physical brutality compared to educated women [Table/Fig-3].
Percentage distribution of sociodemographic covariates with the type of domestic violence.
| Type of domestic violence |
|---|
| Any emotional violence | Any physical violence |
|---|
| Sociodemographic Covariates | No | Yes | Odd’s Ratio (95% C.I) | No | Yes | Odd’s Ratio (95% C.I) |
|---|
| Caste |
| Schedule Caste /Tribe | 17525 (30.40) | 3585 (37.41) | 1.21* (1.1, 1.3) | 13477 (39.08) | 7633 (36.57) | 1.16* (1.1, 1.2) |
| Other Backward Class | 18798 (32.61) | 3341 (34.86) | 1.15* (1.1, 1.2) | 14739 (31.80) | 7400 (35.45) | 1.15* (1.1, 1.2) |
| None of the above (ref) | 21315 (36.99) | 2658 (27.73) | 1.00 | 18133 (39.12) | 5840 (27.98) | 1.00 |
| Wealth Index |
| Poorest | 7730 (12.97) | 2004 (20.32) | 2.49* (2.3, 2.7) | 5335 (11.11) | 4399 (20.50) | 3.28* (3.0, 3.5) |
| Poorer | 8987 (15.07) | 2130 (21.59) | 2.31* (2.1, 2.5) | 6531 (13.60) | 4586 (21.36) | 2.89* (2.7, 3.1) |
| Middle | 11396 (19.12) | 2155 (21.84) | 1.87* (1.7, 2.0) | 8754 (18.23) | 4797 (22.35) | 2.34* (2.2, 2.5) |
| Richer | 13983 (23.45) | 2068 (20.96) | 1.48* (1.4, 1.6) | 11282 (23.49) | 4769 (22.22) | 1.87* (1.8, 2.0) |
| Richest (ref) | 17522 (29.39) | 1509 (15.29) | 1.00 | 16119 (33.57) | 2912 (13.57) | 1.00 |
| Place of Residence |
| Rural | 32960 (55.29) | 6002 (60.84) | 1.34* (1.3, 1.4) | 25921 (53.98) | 13041 (60.76) | 1.34* (1.3, 1.6) |
| Urban (ref) | 26658 (44.71) | 3864 (39.16) | 1.00 | 22100 (48.02) | 8422 (39.24) | 1.00 |
| Level of Education |
| Illiterate | 22553 (37.77) | 5002 (50.70) | 2.17* (1.9, 2.5) | 16113 (33.55) | 11441 (53.31) | 3.83* (3.5, 4.2) |
| Primary | 8917 (14.93) | 1829 (18.53) | 2.24* (2.0, 2.6) | 6919 (14.41) | 3827 (17.83) | 3.33* (3.0, 3.7) |
| Secondary | 22541 (37.76) | 2697 (27.34) | 1.60* (1.4, 1.8) | 19495 (40.60) | 5653 (26.34) | 2.18* (2.0, 2.4) |
| Higher (ref) | 5697 (9.54) | 338 (3.43) | 1.00 | 5494 (11.44) | 541 (2.52) | 1.00 |
*p<0.001; ref=Reference
Total number of observation (N)=67,222
Percentage distribution of pregnancy-related covariates with the type of domestic violence.
| Type of domestic violence |
|---|
| Any emotional violence | Any physical violence |
|---|
| Pregnancy-related covariates | No | Yes | Odd’s Ratio (95% C.I) | No | Yes | Odd’s Ratio (95% C.I) |
|---|
| Planned/Unplanned Pregnancy |
| Unplanned Pregnancy | 5232 (21.0) | 1126 (28.0) | 1.38* (1.3, 1.5) | 3911 (19.92) | 2447 (26.50) | 1.31* (1.2, 1.4) |
| Planned Pregnancy (ref) | 19643 (79.0) | 2872 (72.0) | 1.00 | 15725 (80.08) | 6790 (73.50) | 1.00 |
| Complete ANC visits |
| No | 15007 (60.3) | 2963 (74.1) | 1.40* (1.3, 1.5) | 11133 (56.70) | 6837 (74.02) | 1.53* (1.4, 1.6) |
| Yes (ref) | 9868 (39.7) | 1035 (25.9) | 1.00 | 8503 (43.30) | 2400 (25.98) | 1.00 |
| Ever terminated pregnancy |
| Yes | 10259 (17.21) | 2214 (22.44) | 1.36* (1.2, 1.5) | 7492 (15.60) | 4981 (23.21) | 1.73* (1.6, 1.8) |
| No (ref) | 49359 (82.79) | 7652 (77.56) | 1.00 | 40529 (84.40) | 16482 (76.79) | 1.00 |
| Place of delivery |
| Home | 12762 (51.30) | 2509 (62.76) | 1.24* (1.1, 1.4) | 9309 (47.41) | 5962 (64.56) | 1.42* (1.3, 1.5) |
| Institutional (ref) | 12113 (48.70) | 1489 (37.24) | 1.00 | 10327 (52.59) | 3273 (35.44) | 1.00 |
| IFA during pregnancy |
| No | 7941 (31.92) | 1513 (37.84) | 1.03** (0.9, 1.1) | 5736 (29.21) | 3718 (40.25) | 1.20* (1.1, 1.3) |
| Yes (ref) | 16934 (68.08) | 2485 (62.16) | 1.00 | 13900 (70.79) | 5519 (59.75) | 1.00 |
| Mode of delivery |
| Caesarean section | 3093 (12.43) | 305 (7.63) | 0.80*(0.7, 0.9) | 2755 (14.03) | 643 (6.97) | 0.72* (0.7, 0.8) |
| Normal (ref) | 21782 (87.57) | 3693 (92.37) | 1.00 | 16881 (85.97) | 8594 (93.03) | 1.00 |
Total number of observation (N)=28,873
*p<0.001, **p=0.414; ref=Reference; ANC- Antenatal; Care IFA- Iron-Folic Acid
From [Table/Fig-4] one can observe that there were 26% to 28% unplanned pregnancies, among females exposed to any form of domestic violence and among exposed around 23% women were there who had terminated their pregnancy in past. The risk of domestic violence both physical and emotional was significantly high (31% and 38%) among mothers who had unplanned pregnancies or abortions {73% and 36%, (N=28873)} [Table/Fig-4]. Among exposed, almost three-fourth (74%) of the study subject were deprived of complete antenatal care (ANC) during pregnancy and majority (62-65%) of deliveries were at home. Compared to the reference category (ref), all the pregnancy related covariates were at higher risk of any form of domestic violence exposure (odd’s ratio > 1 and p-value <0.0001).
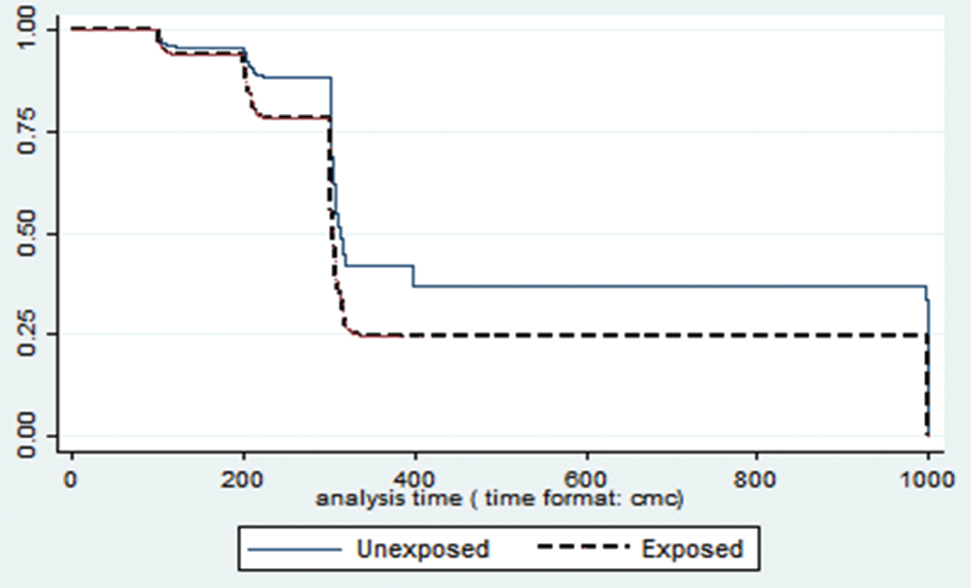
Compared to non-exposed survival probability for a child whose mother was exposed was lower (Log rank χ2=228.97; p<0.001) [Table/Fig-5].
Child survival estimates by mother’s exposure to violence.
[Table/Fig-6] shows the distribution of childhood mortality hazard across potential determinants of under-five mortality using Weibull frailty modelling approach. The shortlisting of covariates is based on Mosley WH and Chen LC framework. Within maternal factor: Parity and Birth Interval; within environmental factors: the source of drinking water and fuel used for cooking and within preventive measures: the total number of antenatal care visit and the distance from the health-care center, were acting as prominent determinants influencing childhood mortality pattern in India. One of the important finding from [Table/Fig-6] was that domestic violence is working as significant (p<0.005) frailty variable while assessing childhood mortality.
Distribution of childhood mortality across potential determinants of under-five mortality using Weibull frailty model.
| Potential Determinants | Hazard Ratio (95% C.I) | Standard Error | p-value |
|---|
| Age at marriage |
| ≤ 18 Years (ref) | 1 | - | - |
| > 18 Years | 1.14 (0.96, 1.34) | 0.09 | 0.130 |
| Parity |
| ≥ 2 (ref) | 1 | - | - |
| < 2 | 0.69 (0.59, 0.80) | 0.06 | <0.001 |
| Birth interval |
| ≥ 36 months (ref) | 1 | - | - |
| < 36 months | 1.25 (1.06, 1.46) | 0.09 | <0.001 |
| Fuel used for cooking |
| Smokeless (ref) | 1 | - | - |
| Smoke | 0.67 (0.55, 0.82) | 0.07 | <0.001 |
| Source of drinking water |
| Improved source (ref) | 1 | - | - |
| Non Improved source | 0.74 (0.61, 0.90) | 0.73 | 0.003 |
| Body Mass Index (BMI) |
| Normal (ref) | 1 | - | - |
| Underweight/Obese | 1.01 (0.86, 1.17) | 0.08 | 0.930 |
| Anti-natal care (ANC) visit |
| ≤ 4 (ref) | 1 | - | - |
| > 4 | 1.48 (1.23, 1.79) | 0.14 | <0.001 |
| Anaemic |
| No (ref) | 1 | - | - |
| Yes | 1.13 (0.97, 1.32) | 0.09 | 0.106 |
| Distance to health facility |
| ≥1 km (ref) | 1 | - | - |
| <1 km | 1.17 (1.09, 1.37) | 0.08 | 0.050 |
| Variance of frailty (θ) (Domestic violence is acting as frailty variable) | 0.02 (0.00, 0.17) | 0.01 | 0.005 |
Discussion
There are few studies that explore the relationship between domestic violence and childhood mortality [5,11,12,14]. The present study reveals that any form (physical/emotional/sexual) of domestic violence has an impact on early childhood mortality.
A case-referent study from Nicaragua [29] concluded that there was an almost three-fold greater risk of premature death (0-11 months) among babies born to mothers subjected to physical or sexual violence compared to mothers who were not exposed. An independent study from, Uttar Pradesh (North India) [5], found both perinatal and neonatal mortality rates were almost double among mothers exposed to domestic violence compared to mothers who did not have any such experience. However, a study on Chinese community reported no association between domestic violence and early childhood mortality rate [30] this might be due to cultural differences prevailing in two different regions. The present study reveals a statistically significant relationship between domestic violence exposures with socio-demographic covariates along with pregnancy-related covariates. Compared to general cast population socially deprived communities (SC/ST or OBC) collectively share significant (72%) chunk of domestic violence exposure. In many studies, higher educational levels of women have been associated with lower levels of violence [31-33] and the present study also had similar findings. An illiterate female has almost four times greater risk of physical violence compared to educated women. This could be because education may confer social empowerment and greater female autonomy, which in turn helps change norms, and improve socioeconomic conditions and reduce the incidence of domestic violence [34]. However, conflicting data has been found on the relationship between education and domestic violence. A study based on VAWS (Violence against women survey) data, Canada (1993) found that women with higher education were at greater risk of being physically and sexually assaulted by their partners [35], while Frieze IH [36] found that domestic violence victims were mostly less educated.
Current study finds that compared to urban women it was observed, that females living in a rural community have higher (Odd’s ratio 1.34) risk of domestic violence exposure. A past study [37] had suggested that in the rural community where violence is considered as a normative indicator of masculinity, their lower literacy level and poverty may affect their critical thinking, resulting in their inability to see ways to communicate other than through violence. The present study finds that poverty, illiteracy, rural-urban difference collaboratively plays a vital role in accelerating domestic violence rate in India.
A study, conducted among women and men in Jalandhar district, Punjab, North India, reveals that about 75% of women of the scheduled caste community are often beaten-up by their husband [22]. Further, a study in an urban slum (Bombay) has a similar observation, where domestic violence in any form is faced by a majority (60%) of respondents even during pregnancy [23]. Results of present study corroborate the findings of these earlier studies. The current study found that unwanted pregnancies and induced abortion rates were higher among women having domestic violence exposure, similar findings had been reported by various other studies. Experiencing domestic violence during pregnancy has indirect consequences on maternal and neonatal health. It may lead to psychological stress/depression, or it may result in adverse pregnancy outcomes [38,39]. A lot of emphases had already been made to reduce under-five mortality scenario in India, but unfortunately, we still are lagging far behind. There is, therefore, a need to study the social perspective looking for more modifiable causes of under five mortality.
Limitation
As in any analysis of large secondary datasets, there is a trade-off between the increased comprehensiveness of subject data under analysis and the deficiencies in terms of coverage and quality of database. With this sense, the missing information identified in the current study constitutes serious limitations, not only in terms of the resulting analysis, but also from the broader perspective of monitoring and policy making. This study has no specific information on the cause of child death. Moreover the mortality outcome of censored subjects was unknown.
Conclusion
The study finds that the probability of survival for a child whose mother is exposed to any form of violence is significantly low compared to children who do not have any such experience. Poverty, illiteracy and rural-urban difference collaboratively play a vital role in accelerating domestic violence. The current study finds that the risk of domestic violence was significantly high, 30-38% among mothers who reported unplanned pregnancies and abortions 36-73% (N=28873). Domestic violence was found to be a significant frailty variable; thus, it should be considered along with already established proximate determinants of childhood mortality while planning for child survival programmes. The study finds that childhood mortality and domestic violence are closely linked and unless and until the in-house violence against women is minimised, it’s difficult to attain acceptable under five mortality rate in India.
*Excluding Infancy period
*p<0.001; ref=Reference
Total number of observation (N)=67,222
Total number of observation (N)=28,873
*p<0.001, **p=0.414; ref=Reference; ANC- Antenatal; Care IFA- Iron-Folic Acid