Diabetes mellitus is a metabolic disorder that is characterized by high blood glucose levels for prolonged period of time, which might be associated with long term damage and failure of many body organs; like eyes, kidneys, heart and nerves [1,2].
Millions of people are affected with diabetes mellitus over world, making it a famous global health problem [3]. There are two well-known types of diabetes mellitus: Type 1 Diabetes Mellitus (T1DM), which occur mostly among children and young people and considered to be an autoimmune disease, while T2DM (T2DM) is a multifactorial disease that is closely related with life style and obesity [2].
Various pathophysiological factors were related to the development of macrovascular and microvascular complications in patients with T2DM, suggesting that T2DM may be the result of an inflammation that reflects innate and acquired immunity responses [4,5]. Circulating inflammatory markers such as C-Reactive Protein (CRP), soluble Vascular Adhesion Molecule-1 (VCAM-1) and Intracellular Adhesion Molecule (ICAM-1) are found in high serum levels in patients with T2DM [6,7] which may support the role of inflammation in the pathogenesis of type 2 diabetes.
VCAM-1 (CD106) is a transmembrane glycoprotein that belongs to the immunoglobulin superfamily; it is expressed by vascular endothelial cells, fibroblasts, tissue macrophages, chondrocytes, dendritic cells, and epithelial cells of the thymus and pericytes of neural tissue [8]. Its main ligand is the integrin a4β1 (very late antigen 4) VLA-4, and it is expressed by endothelial cells as a result of inflammatory stimuli [9]. Interactions between VCAM-1and activated receptors on the leukocytes cause a tight adhesion and transmigration of leukocytes into the basement membrane of the vasculature. Platelets, leukocytes, and endothelial cells that depend on adhesion molecules link the processes of haemostasis, thrombosis, and inflammation [10].
The aim of this study was to examine the genotype of VCAM-1 gene polymorphisms (rs3783605 A>G) and its association with T2DM in Iraqi patients.
Materials and Methods
This retrospective case control study was conducted on 129 Iraqi subjects, 68 patients (42 males and 26 female) that were diagnosed with T2DM, who were periodic patients at the Specialize Center of Endocrinology and Diabetes /Baghdad, from March 2016 to June 2016. The patients had been instructed about the purpose of the study and interested volunteers have been enrolled along with 61 healthy subjects (31 males and 30 female) that were taken as a control group. Diabetic patients were selected according to the World Health Organization 2016 guideline:
Fasting Blood Sugar (FBS) ≥126 mg/dL (7.0 mmol/L), or Glycohemoglobin (HbA1c) ≥ 6.5% (48 mmol/mol) [2]. Diabetic patients younger than 18-year-old, those with less than six months of follow up, or pregnant women were excluded. Also, subjects with the history of Hypertension, Coronary Artery Disease (CAD), Endocrinopathy or those taking any lipid altering medication were excluded from the study, while control group consisted of non-diabetic healthy individuals according to the laboratory finding of FBS value <90 mg/dL.
Venous blood samples (7 mL) were divided into two aliquots; one for biochemical tests and the other for DNA genotyping. Fasting Blood Sugar (FBS), Glycohemoglobin (HbA1c) and Lipid profile {Total cholesterol, Triglyceride (TG), high density lipoprotein (HDL-C), low density lipoprotein (LDL-C), very low density lipoprotein (VLDL-C)} were measured by enzymatic colorimetric methods with commercially available kits (Human, Germany and SPINREACT Company, USA). Body mass index weight/height (kg/m2) and abdominal Circumference (cm) were calculated for both groups.
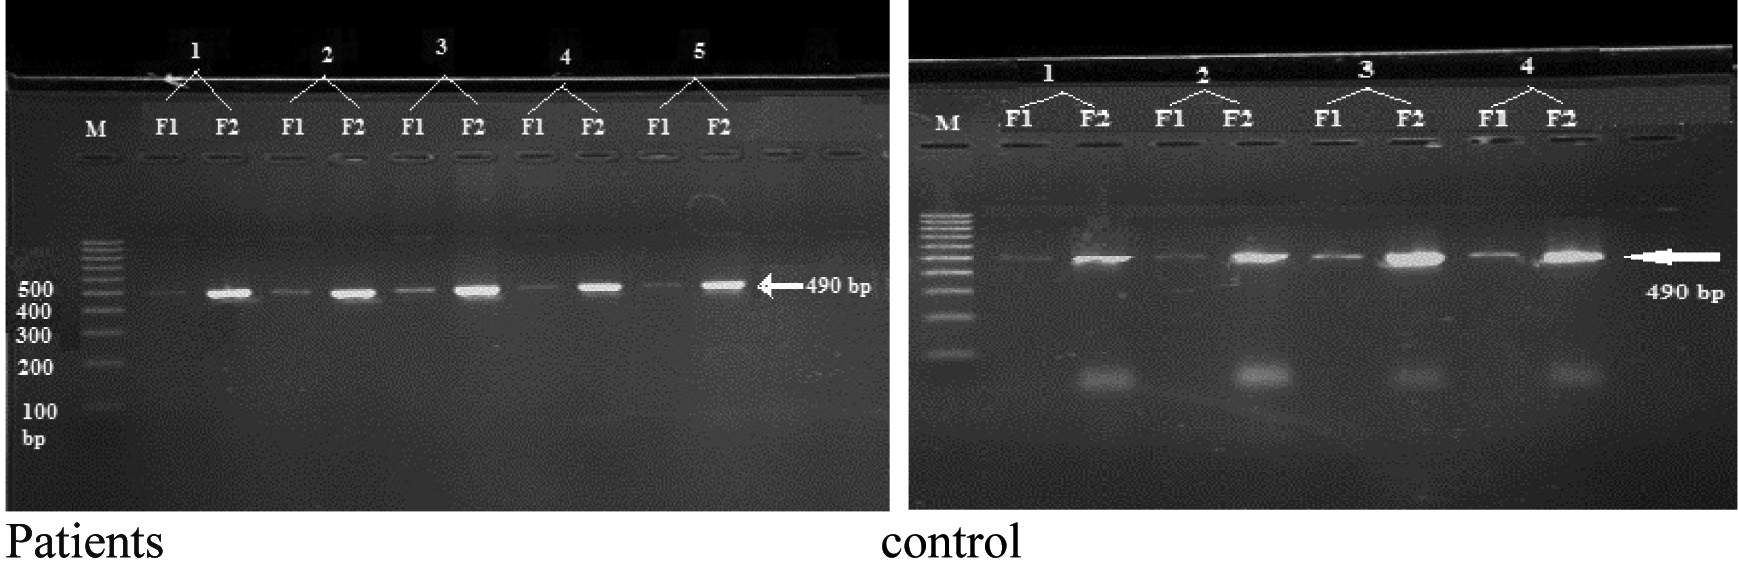
The genotypes were characterized using sequence specific primer (SSP) technique. Genomic DNA was extracted using gSYNC™ DNA Extraction Kit (Geneaid Biotech-Taiwan), the amplification of rs3783605VCAM1SNP was done by designing sequence specific primers using PRIMER3PLUS software, the two forward primers were different only with the targeted allele (forward 1 for c.-540 A allele and forward2 for c.-540G allele) and a common reverse primer was used with both forward primers to obtain a PCR product size of 490 bp [Table/Fig-1].
VCAM-1 promoter region primers.
| Forward primer 1 5’-ATC TCT TTT AGA ATT GCA AAC ATA-3’ |
| Forward primer 2 5’-ATC TCT TTT AGA ATT GCA AAC GTA-3’ |
| Reverse primer 5’-GGA GGG TAT TCA GCT CCT-3’ |
Lyophilized primers were supplied by Alpha DNA (Canada) and were suspended according to the manufacturer’s instructions. PCR reaction was performed using Go Taq® green master mix (2X) of Promega (USA) instructions for a final volume of 50 μL (two tubes for each sample: one for forward primer 1 and the second for forward primer 2, the common reverse primer was added to each tube), as following: 25 μL of 2X Go Taq® green master mix, 1.5 μL of 10M of each primer (forward and reverse), 3 μL of genomic DNA and the volume was completed to 50 μL with nuclease free water, positive and negative controls were made with each run. Reaction was carried out with Gene Amp® PCR System 9700 thermocycler with denaturation for 3 minute at 95°C; followed by 30 cycles of 95°C for 1 minute, 54°C for 1 minute, and 72°C for 1 minute. Final extension was carried out at 72°C for 20 min. The PCR product (490 bp fragment) was visualized by 2% agarose gel electrophoresis (stained by 2.5 μL ethidium bromide).
Statistical Analysis
Statistical analysis was performed using the SPSS software version 20.00 (SPSS Inc., Chicago, USA). A two-tailed p-value < 0.05 was considered statistically significant. Statistical significance of differences between the means for normally distributed variables (FBS, HbA1c-, HDL, LDL, VLDL, TG as well as BMI and the Abdominal Circumference) was assessed using student’s t-test. The Odds Ratio (OR) was used for the frequency distributions of the selected variables. WINPEPI computer programs (version 11.63) was used to calculate the statistical significance of the ODD Ratio (OR) that was assessed by a special χ2 formula, as well as the p-values that was calculated with Fisher’s-exact test [17].
Results
Clinical Features
The tests result for both patients and control group are listed in [Table/Fig-2].
Clinical characteristics of patients and control group.
| Parameter | Control(Mean±SE) | Patient(Mean±SE) |
|---|
| Age (year) | 37.5±1.1 | 48.6±1.2 |
| Gender (male/female) | 31/30 | 42/26 |
| Disease duration (year) | 0 | 8.2 |
| BMI (kg/m2) | 27.8±0.5 | 29.2±0.6* |
| Abdominal Circumference (cm) | 88.2±1.3 | 99.4±2.2* |
| FBS (mg/dL) | 88.5±10.3 | 239.7±1.3* |
| HbA1c (%) | 4.9±0.27 | 9.1±0.03* |
| Cholesterol (mg/dL) | 189.5±5.7 | 222.6±3.3* |
| Triglyceride (mg/dL) | 117.1±13.8 | 201.7±7.6* |
| HDL (mg/dL) | 37.4±0.6 | 40.4±0.5* |
| LDL (mg/dL) | 129.5±5.6 | 150.4±2.8* |
| VLDL (mg/dL) | 23.4±1.5 | 38±1.5* |
*p-value calculated by students t-test comparing the means of the variables for the two groups (p≤ 0.05 is significant)
These results showed significant differences in biochemical tests (FBS- Fasting blood sugar, HbA1c- Glycohemoglobin, HDL- high density lipoproteins, LDL-low density lipoproteins, VLDL- very low density lipoproteins, TG- triglycerides) as well as Body Mass Index (BMI) and the Abdominal Circumference in patients group compared with control group.
DNA Genotyping results
The PCR product of the amplified VCAM-1 (rs3783605) SNP have been presented in [Table/Fig-3].
The electrophoresis of amplified VCAM-1rs3783605 SNP on the 2% agarose gel. M: 100bp DNA ladder. F1: amplified fragment by F1 primer. F2: amplified fragment by F2 primer, (PCR product 490bp).
VCAM-1 polymorphism analysis showed a higher frequency of A/G genotype in control group than patients group {100% vs. 88.2%}, that showed statistical significance (p=0.007), while the analysis of the allele impact, including both genotypes that contain G allele showed no significant association in patient group compared with control (p=0.383). The attributable fraction in exposed subjects was 21.1% and the attributable fraction in population was 11.8% [Table/Fig-4].
Genotypes and alleles frequency of the VCAM1 rs3783605 A>G polymorphism.
| Group Genotypes | Study groups | Comparison | OddsRatio | CI 95% | p-valueFisher –test |
|---|
| Patient | Control |
|---|
| A/A | 0 (0) | 0 (0) | G/G vs. A/G | 1.64 | 1.64 to infinity | 0.007* |
| A/G | 60 (88.2%) | 61(100%) |
| G/G | 8 (11.67%) | 0 (0) |
| Alleles | | | | | | |
| A allele 2n (%) | 60 (44.1%) | 61(50%) | G vs. A | 1.27 | 0.75- 2.13 | 0.383 |
| G allele2n (%) | 76 (55.9%) | 61 (50%) |
p-values calculated with Fisher’s-exact test. p ≤ 0.05 (* for significant)
The [Table/Fig-5] shows significant differences (p≤ 0.05) between the patients and control in all tested clinical features (BMI, FBS, HbA1c, HDL, LDL, VLDL, TG and Abdominal Circumference) according to the genotype results, as well as a significant difference between A/G genotype patients group and the G/G genotype patients group (p≤ 0.05) in all clinical tests results. As noticed from the present data, healthier individuals own just the A/G genotypes.
Comparison of the clinical features according to the genotypes.
| Characters(Mean±SE) | Group | Genotype |
|---|
| A/A | A/G | G/G |
|---|
| BMI (kg/m2) | Patients | 0 | 29±0.5* | 31.1±1.5** |
| Control | 0 | 27.8±0.6 | 0 |
| Abdominal Circumference (cm) | Patients | 0 | 99±2.2* | 102.6±1.3** |
| Control | 0 | 88.2±1.3 | 0 |
| FBS (mg/dL) | Patients | 0 | 293.8±11.2* | 293±26.3** |
| Control | 0 | 88.5±1.2 | 0 |
| HbA1c (%) | Patients | 0 | 9.2±0.3* | 7.6±0.5** |
| Control | 0 | 4.9±0.03 | 0 |
| Cholesterol (mg/dL) | Patients | 0 | 226.5±6.2* | 194.1±12.6** |
| Control | 0 | 190.3±3.3 | 0 |
| Triglyceride (mg/dL) | Patients | 0 | 202.3±11.3* | 197.1±33.2** |
| Control | 0 | 117.2±8 | 0 |
| HDL (mg/dL) | Patients | 0 | 40.5±0.5* | 39.3±2.3** |
| Control | 0 | 37.4±0.5 | 0 |
| LDL (mg/dL) | Patients | 0 | 150.4±5.4* | 117.8±15.2** |
| Control | 0 | 129.5±3 | 0 |
| VLDL (mg/dL) | Patients | 0 | 38.1±1.5* | 36.4±5.01** |
| Control | 0 | 23.5±1.5 | 0 |
-p-value calculated by t-test comparing the means of the variables for the two groups (p≤ 0.05 is significant).
* significant differences between patients and controls;
** significant differences between patient’s genotype groups.
Discussion
T2DM is associated with; first: abnormal carbohydrate, lipid and protein metabolism, second with insulin resistance and impaired insulin secretion [2]. In this case-control study, clinical features of the patients showed elevated levels of fasting blood sugar, HbA1c, total cholesterol, triglyceride, HDL-C and VLDL (with significant differences p<0.05) compared with controls. Previous studies mentioned that both male and female diabetic patients have elevated levels of FBS, HbA1c, and lipid profile [18-21], these studies in addition to the current study results suggest the use of FBS, HbA1c, and lipid profile tests for T2DM diagnosis confirmation and they might be helpful in risk assessment of coronary heart disease in T2DM patients. The HbA1c test was suggested to be useful for screening diabetic patient for risk of cardiovascular complications and for intervention with lipid lowering drugs [22], which is compatible with the results of another study which mentioned that HbA1c can be helpful as a suggested biomarker for predicting dyslipidemia in diabetic patients [23].
The present study showed a significant increase in Body Mass Index (BMI) and the abdominal circumference (p<0.05) in the patient group compared to control group. These results agree with other studies that found a strong and independent association between BMI and the risk of being diagnosed with T2DM [24]. Another study found that people, who have BMI close to 30 kg /m2 or more, are more likely to have diabetes or shorter life time due to diabetes [25]. Furthermore, abdominal circumference provides a good indicator of body fat distribution, which might be used to identify patients with increased risk of obesity-related cardio-metabolic disease [26]. Measurement of the abdominal circumference could be used as a screening method for predicting and assessing T2DM [27]. All the patients in this study were diagnosed by specialist physicians; their elevated tests results indicated that high FBS and HbAIc levels might be the reason for the increase in their lipid profile, this goes with the finding of a previous study [23]. So FBS, HbA1c, BMI and abdominal circumferences could be used as an indicator for complications (including elevated levels of lipid profile) in Iraqi patients with T2DM.
VCAM-1 is expressed by vascular endothelial cells under the influence of inflammatory stimuli [4]. The up-regulation of adhesion molecule expression appears to be involved in both transcriptional and post-transcriptional mechanisms. The promoters of VCAM-1 gene include binding motifs for some transcription factors as ETS2, and many other agents that up-regulate VCAM-1 expression, while the suppression of VCAM-1 expression is caused by many agents that inhibit these transcription factors activity [8], this may explain the influence of the DNA variations in the promoter region of the VCAM-1 gene with the susceptibility of certain diseases.
The present study investigated the genotype of VCAM-1 promoter gene polymorphism (rs3783605 A>G) SNP in a sample of T2DM Iraqi patients. Statistical analysis results showed that the G/G genotype has a significant association with T2DM in the patient group as well as higher frequency of the G allele, while control group had a higher frequency of the A/G genotype regarding the patient group. In addition, there was a significant elevation in the clinical tests results for the A/G patient group (p≤ 0.05) associated with the incidence of T2DM, these results go with the findings of the previous studies which indicated that G allele has more role in the pathogenesis of certain diseases than A allele [13,28]. The rs3783605 A>G SNP the G allele is more frequent even though it is a derived allele compared with the ancestral A allele. This finding agrees with the suggestion that risky alleles are mostly derived, low-frequency (i.e., minor) variants [29,30], At the same time the present finding is consistent with other studies which demonstrated that rare derived alleles have a higher proportion of risk variants compared to ancestral allele [31,32]. In most cases, late-onset diseases are caused by neutral mutations, which may replace ancestral alleles completely, leading to a situation in which the protective allele is the ancestral (rare) one and the risk allele is the derived (common) one [30].
Multiple VCAM-1 gene polymorphisms (including rs3783605 A>G) were studied by Idelman G et al., who found a multiple uncommon variants of the VCAM-1 promoters, prevalent in African Americans that are biologically active and could influence disease progression. The ETS2 transcription factors were found to be bound more significantly at the variant c.-540G allele than the common c.-540A allele, confirming an increased role for ETS2 in the regulation of the (rs3783605 A>G) VCAM-1 promoter variant [28]. These findings were consistent with previous studies and indicated that the VCAM-1 function is implicated in a variety of diseases that have disproportionately higher frequencies of G allele in African Americans, including thromboembolic diseases [33,34].
The effect of rs3783605 A>G SNP on the activity of the VCAM-1promoter in Human Umbilical Vein Endothelial Cells (HUVECs) was investigated by Pakdel FD et al., who found that the HUVECs which were transfected by the G allele showed about 2-fold higher transcriptional activity compared with the A allele, this finding indicates that the rs3783605 A>G may affect the DNA binding of ETS2 separately or DNA binding of ETS2-transcription factors in combinational forms. A synergistic repression or activation of gene expression occurs as well as interaction affinity between these transcription factors, which might affect VCAM-1 gene expression and it has an important role in the pathogenesis of VCAM-1 associated diseases and tumour metastases [13]. These former results agree with our finding that T2DM Iraqi patients have a higher frequency of G allele and significant association with the G/G genotype.
The genetic contribution to T2DM susceptibility is well accepted in previous studies [3,35]. DNA variations can have a major impact on how humans respond to diseases, environmental insults, drugs, and other therapies. This makes SNP analysis of great importance for biomedical research and for developing pharmaceutical industry or medical diagnostics; it can also help identify multiple genes associated with complex diseases such as cancer and diabetes [36]. Many SNPs in different genes were studied and found to be associated with the occurrence and development of T2DM [37-39], which support our finding that VCAM-1 promoter variation might have an effect in increasing the incidence of diabetes.
There are many good points that give strength to this study. To the best of our knowledge this study is the first population based study that investigated the VCAM-1 gene promoter (rs3783605 A>G) SNP in Iraqi patients with T2DM, all the Iraqi participants were from the Arab race and had similar genetic backgrounds, which minimized the potential confounding due to ethnicity.
Limitation
Because of the time limit and the precarious security situation the study was conducted on a small size sample of population, a further limitation of the study is that only one polymorphism was examined, the positive association was found only in group. Also, due to the relatively small sample size, the frequencies of some homozygous variants were low or absent.
Conclusion
It was concluded that G allele at the VCAM-1 gene promoter (rs3783605 A>G) SNP could be considered as risk factors and it has more role in the pathogenesis of T2DM, while the A allele might have a protective effect; also there was an association for the A/G genotype with all clinical parameters in T2DM patients. These results shed a light on the importance of the clinical factors in avoidance of diabetes, which might motivate people to improve their lifestyle into a healthier way leading to reduce their chances in developing diabetes and cardiovascular diseases. Further studies are needed with larger sample size to determine the role of VCAM-1 SNPs in diabetes occurrence and complication; this could be helpful for better understanding of the genetic-environmental interactions and would assist in designing optimal measures for diagnosis, treatment and prevention of this disease.