Introduction
Presence of thalassemias and haemogl-obinopathies are described in some communities especially from Terai belt. However, there are no any population based studies done till date, including other parts of Nepal. So, this study may indicate the presence of haemoglobin disorder in other parts of Nepal as well.
Aim
This study was done to know the presence of Haemoglobin disorder in this part of Nepal. In addition, this study also focuses on the application of electrophoresis and densitometric quantification for easy and accurate determination of Haemoglobin disorder.
Materials and Methods
In this cross-sectional study, a total of 45 blood samples of all age groups with mean corpuscular volume and mean corpuscular Haemoglobin less than 80 femtoliter (fL) and 27 picogram (pg) respectively, were analysed for Haemoglobin pattern and their quantification. The Haemoglobin electrophoresis and quantification of haemoglobin was performed by using automated Haemoglobin electrophoresis system (Genio S, Italy) in an alkaline medium.
Results
Out of total 45 subjects, 42 subjects (93%) showed normal Haemoglobin patterns. Two subjects were suspected to have beta thalassaemia trait based on the Haemoglobin A2 (HbA2) level. One subject showed the heterozygote Haemoglobin E. In addition, automated haemoglobin electrophoresis and direct densitometric quantification is easy and accurate method for determining haemoglobin pattern rather than manual process.
Conclusion
Haemoglobin disorders are also present in other parts of Nepal, like Pokhara. In addition, this quantitative method could be of great diagnostic value rather than classical comparative method.
Electrophoresis, Haemoglobin, Haemoglobin disorder
Introduction
The thalassemias are a group of inherited haematological disorders caused by defects in the synthesis of one or more of the Haemoglobin (Hb) chains. Thalassemia consists of two main classes: alpha and beta in which, the alpha and beta globin genes are involved [1-3]. Haemoglobinopathies are genetic defects that results in abnormal structure of one of the globin chains of the haemoglobin molecule due to alteration in amino acid sequence [1].
The thalassemias are distributed across Africa, the Mediterranean region, the Middle East, the Indian subcontinent, China and throughout Southeast Asia in a line stretching from Southern China down the Malaysian peninsula to the Indonesian islands [2]. Thalassemia and HbE occur with high frequency in various countries of Asia like India, Bangladesh, Pakistan that are much closer to Nepal. Migration of people and intercast marriage has introduced Hb disorders in almost every country of the world [4,5]. Thalassemia and Haemoglobinopathies are also described in various parts of Nepal, especially focused on terai belt. Due to lack of any screening programs we do not have any population based data regarding Haemoglobin disorders [5-7].
The 1975 International Committee for Standardization in Haematology expert group recommended Complete Blood Count (CBC), electrophoresis of the Haemoglobin at alkaline pH, tests for sickling and solubility and quantification of Haemoglobin A2 (HbA2) and Foetal Haemoglobin (Hb F) for the diagnosis of thalassemia [8,9].
There are a variety of approaches worldwide to screen for thalassemia but a relatively common approach has consisted of a CBC to assess the Mean Corpuscular Volume (MCV) and the Mean Corpuscular Haemoglobin (MCH) [2,10,11,12]. The finding of a normal MCV (i.e. 80femtoliter) in combination with a normal MCH (i.e., 27 picogram) would rule out most cases of thalassemia and would require no additional thalassaemia testing [1,10,13]. For individuals with MCV < 80 fL (Femtoliter), the next step is Haemoglobin electrophoresis. Electrophoresis on cellulose acetate at alkaline pH is the simple and cost effective method for the separation of both normal and variant Haemoglobins, especially in low income countries, and is the main tool used for their identification and quantification of Haemoglobin variants like Haemoglobin S, C, D and E, [2,14-17]). Beta thalassaemia trait can also be reliably diagnosed by HbA2 and Hb F quantification. Patients with beta thalassaemia trait have an elevated HbA2, i.e., >3.5% [1,2,10].
The main objective of this research was is to screen the thalassaemia and Haemoglobinopathies, investigate the patterns of Haemoglobin of individual and quantify the abnormal Haemoglobin with low MCV and MCH value.
Materials and Methods
This was a cross-sectional study done for the period of one month in October 2011 in Manipal Teaching Hospital (MTH), a tertiary care hospital with a patient flow rate of about 200-500 per day in all departments. Ethical Clearance for the use of hospital samples was taken from hospital administration. Permission for this study was also obtained from the School of Health and Allied Sciences, Pokhara University.
Sample Collection
The inclusion criteria of subjects were those whose complete blood count data was available and who were the permanent residents of Pokhara. Total 525 blood samples were collected in Ethylene Diamine Tetraacetic acid (EDTA) vacutainer. Complete Blood Cell count CBC was estimated by coulter counter (Sysmex Kx 21, Malaysia), which provided the results of Red Blood Cell (RBC) count, Haemoglobin, MCV, MCH, Packed Cell Volume (PCV), and Mean Cell Haemoglobin Concentration (MCHC) respectively. A total of 45 blood samples showing MCV <80 fL and MCH <27 pg was stored at 4°-8°C in refrigerator, transported via ice pack and Haemoglobin typing was performed.
Sample Preparation
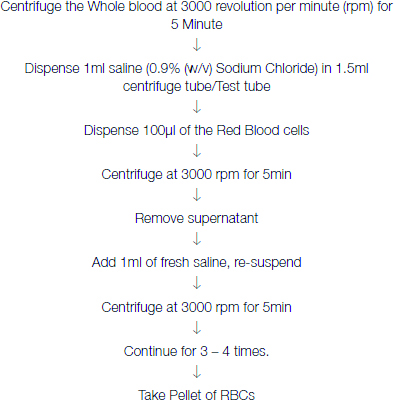
Whole blood was collected in EDTA vacutainer. CBC was performed by aliquoting some amount of blood sample. Then, the sample was proceeded for Hb typing by following the Genio (S) Standard Operating Protocol (SOP) for Hb electrophoresis.
Washing of RBCs were done accordingly.
Lysing of RBC (Haemolysate preparation) was done accordingly;
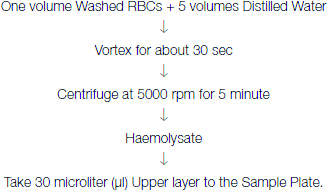
One volume Washed RBCs + 5 volumes Distilled Water
The uniform red and clear liquid in the test tubes was pipetted only from the first half or top of the clear red liquid sample in the test tube.
Haemoglobin Electrophoresis And Densitometric Quantification
The alkaline Haemoglobin electrophoresis was performed by a fully automated electrophoresis system (Genio S, Italy) in Molecular biology laboratory and densitometric quantification was done by the same system. This automated system incorporates both Haemoglobin electrophoresis and densitometric quantification as a single system. Automated process of separation and quantification is more accurate than manual method of separation and visual comparison without quantification. Furthermore, this system has short run time whereas manual method is tedious to perform, time consuming and prone to error.
Statistical Analysis
The haemoglobin electrophoresis and densitometric data was exported and analysed by Interlab Genio S Version 1.6.0. Only descriptive analysis was done using Microsoft Office Excel 2010.
Results
The study of blood samples for thalassemia and Haemogl-obinopathies was performed in 45 subjects of all age groups.
First of all, complete blood cell count (CBC) was performed and the average results of required haematological parameters (Hb, MCV, MCH, RBC count) were below the cut-off level (MCV <80 fl, MCH < 27 pg) of all study subjects as shown in [Table/Fig-1]. The level of HbA2 was more than the cut-off value (3.5% and 10%) in beta thalassaemia trait and Heterozygote HbE respectively as shown in [Table/Fig-2].
The different parameters of the study subjects.
| Characteristics | All Subjects | Normal level |
|---|
| Males (%) | 18 (40) | |
| Females (%) | 27(60) | |
| Total Haemoglobin (gm/dl; mean ± SD) | 11.4 ±1.8 | Male: 13 - 18 |
| | Female: 12 - 16 |
| RBC Count (mean x 106/cu mm ± SD) | 4.89 ±0.6 | Male: 4.5 – 6.5 |
| | Female: 3.5 – 5.5 |
| MCV (fl; mean ± SD) | 74.8 ±4.5 | 76 – 96 |
| MCH (pg; mean ± SD) | 23.5 ±2.4 | 26 - 34 |
MCV = Mean Cell Volume, MCH = Mean Cell Haemoglobin, RBC = Red Blood Cell, fl = Femtoliters, pg = Picograms, SD = Standard Deviation
Note: The gender wise distribution of study subjects and their haematological parameters measured as Hb, RBC count, MCV and MCH. Low levels of Hb, MCV and MCH were seen in all study groups irrespective of age and sex.
Hb pattern and quantification in suspected beta thalassaemia traits and heterozygote HbE case.
| Hb A | HbA2 | Hb F | HbA2/HbE |
|---|
| Subject 1(beta thalassaemia trait) | 93.6% | 6.4% | 0.0 | - |
| Subject 2 (beta thalassaemia trait) | 89.7% | 7.8% | 2.5% | - |
| Subject 3 (Heterozygote HbE) | 64.5% | - | - | 35.5% |
HBA = Haemoglobin A, HBA2 = Haemoglobin A2, HbF = Fetal Haemoglobin, HbE = Haemoglobin E
Note: The quantitative result of abnormal Haemoglobin pattern after densitometric reading in subjects with suspected beta thalassaemia trait and heterozygote HbE. In both cases of beta thalassaemia (subject 1 and 2), HBA2 level was above cut off value (i.e., >3.5%) which is the study criteria of our study for beta thalassaemia trait. In alkaline electrophoresis, HbA2 and HbE co-migrate, but the level of HbA2 rarely exceeds 10%. In our study, the combined value of HbA2 and heterozygote HbE was 35.5% suggestive of presence of heterozygote HbE in subject 3
The normal and abnormal Haemoglobin electrophoresis patterns along with their densitometric quantification results were obtained. The normal Haemoglobin patterns along with their quantity were obtained as shown in [Table/Fig-3]. The Hb band and densitometric quantification as shown in [Table/Fig-4], shows suspected heterozygote HbE. Similarly, the Hb bands and densitometric quantification as shown in [Table/Fig-5,6], shows suspected beta-thalassemia trait.
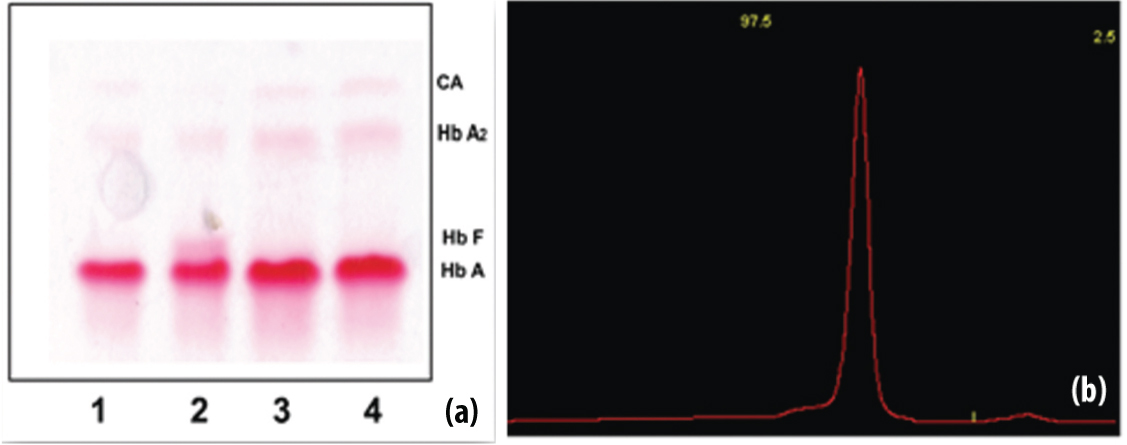
Haemoglobin electrophoresis and densitometric quantification in normal subjects.
(a) The overall representative normal Haemoglobin pattern in Haemoglobin electrophoresis strip. Sample 2 is from two months child and shows HbF just above the HbA (dominant band). Other samples do not show HbF. (b) The representative densitometer graph for normal Hb levels with HbA 1- 97.5% and HbA2 – 2.5% in one of the normal subjects.
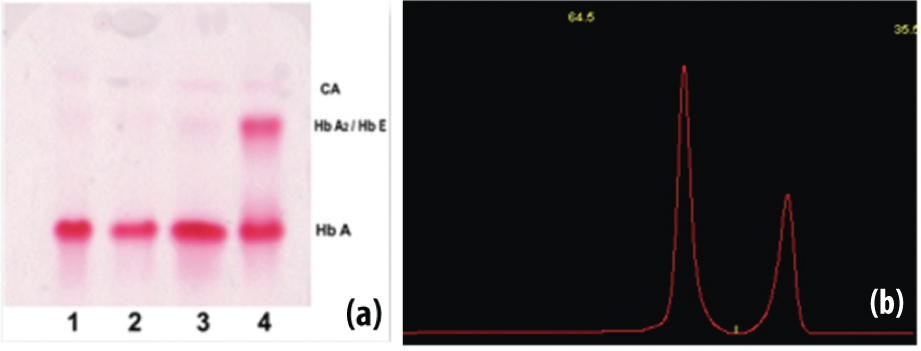
Haemoglobin electrophoresis and densitometric quantification along with suspected Heterozygote HbE.
(a) The three normal Haemoglobin patterns (lane 1, 2 and 3), sample no 4 shows increased intensity at HbA2/HbE portion in Haemoglobin electrophoresis strip, since HbA2 and HbE co-migrates each other. (b) The densitometer graph of suspected heterozygote HbE with HbA1 (64.5%) and HbA2/HbE (35.5%). HbA2 and HbE co-migrate each other but HbA2 level rarely increases above 10%. So, the graph is suggestive of heterozygous HbE.
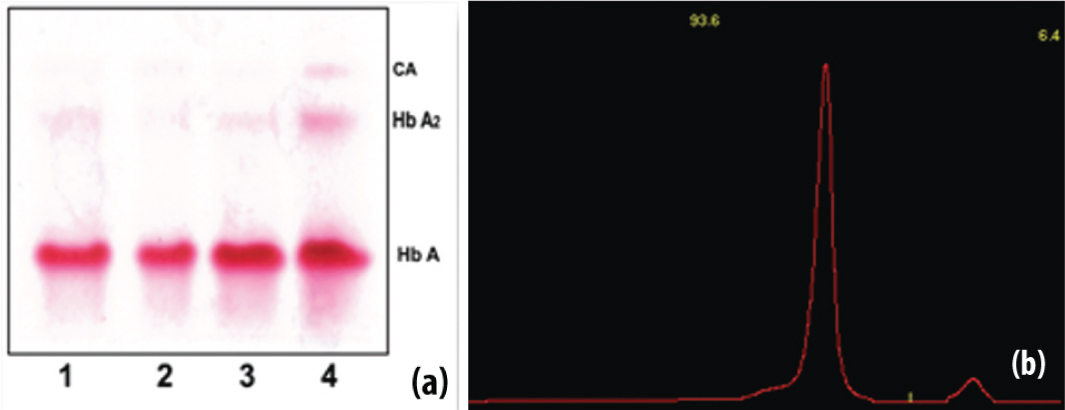
Haemoglobin electrophoresis and densitometric quantification in suspected beta thalassaemia trait (Subject 1).
(a) The three normal bands (lane 1, 2 and 3); Sample no 4 showed increased HbA2 level, indicative of beta thalassaemia trait in Haemoglobin electrophoresis strip (subject 1). (b) The densitometer graphof suspected beta thalassaemia trait in subject 1 with HbA1 93.6% and HbA2 6.4% which is indicative of beta thalassaemia trait as per the cut-off level of HbA2 (>3.5%).
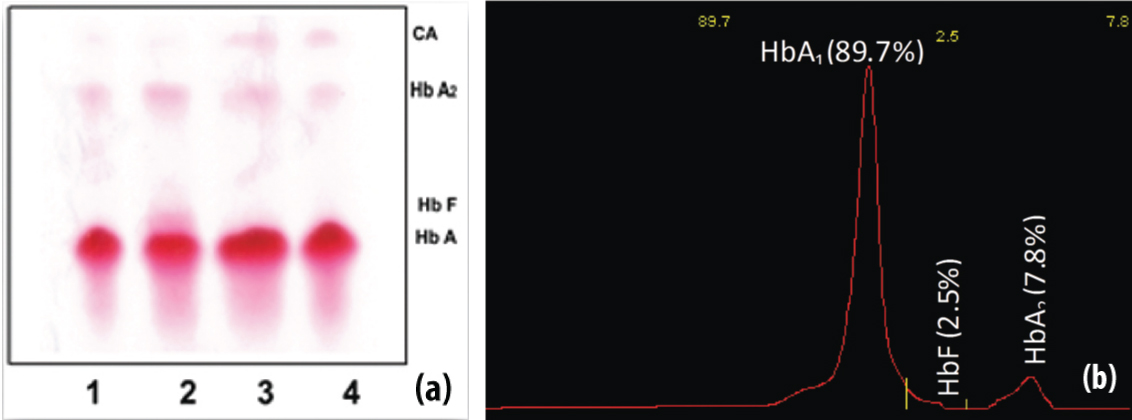
Haemoglobin electrophoresis and densitometric quantification for suspected beta thalassaemia trait (Subject 2).
(a) Three normal bands (lane 1, 3 and 4); sample no 2, shows HbF and increases HbA2 level, indicative of beta thalassaemia trait in the Haemoglobin electrophoresis strip (subject 2). The other three traces do not shows fetal Haemoglobin. (b) The densitometer graph of suspected beta thalassaemia trait in subject 2 with HbA1 (89.7%) and HbA2 (7.8%) with increased HbF (2.5%) which is indicative of beta thalassaemia trait as per the cut-off level of HbA2 (>3.5%) and increase in HbF.
Discussion
Thalassemia and haemoglobinopathies are the most common inherited disorders among humans, and they represent a major public health problem in many areas of the world, including Southeast Asia [12]. Among many diagnostic methods, identification of Haemoglobins by electrophoretic technique on cellulose acetate paper has become vital investigation and plays an important role in routine procedure [6,8,9,14,17].
Although there are no studies on prevalence of haemoglobin disorders in Nepal, but various articles have reported the presence of thalassemia especially in Tharu people in Terai region, the prevalence of 4% was found in these population [4].
One study performed by Sakai Y et al., thalassaemia was observed in two neighbouring populations of Danuwar and Tamang of Nepal. They also found three heterozygote haemoglobin E in Danuwar community [7]. Till date, there are no studies related to haemoglobin disorders in other parts of Nepal and thus, the scenario cannot be described. However, thalassemia and HbE are found in neighbouring countries like India (3-8%), Bangladesh (beta thalassaemia trait prevalence rate of 4.1% and HbE trait 6.1%), Maldives (beta thalassemia prevalence rate of 18.1%) Pakistan, China in varying rates [4,18]. In addition, alpha thalassemia was seen in parbate, tamang like non tharu people [18].
MCV level less than 80fl and MCH level less than 27pg is one of the important indication of thalassemia and haemoglobinopathies [1,10,11,13,14]. Out of the total 45 subjects, we found three abnormal haemoglobin patterns, among which one subject showed HbA1 93.6% and HbA2 6.4%, while other subject showed HbA1 89.7% HbA2 7.8% and HbF 2.5%. Similar to our study, various studies done at different places have used the criteria of HbA2 (3.5-10%) for the screening of beta thalassemia trait [10].
Hb E is also present in Nepal [7]. Among three abnormal haemoglobin patterns, one subject showed two distinct band with HbA1 64.5% and HbA2 35.5%. HbA2 and Hb E co-migrates each other on cellulose acetate medium. So, both haemoglobins lie on the same portion. HbA2 is rarely higher than 10%. HbA2 more than 10% was assumed to be haemoglobin E by Balgir RS in 2005 [10]. So, it was suspected to be heterozygote Hb E.
Our study was based on the red cell indices and haemoglobin electrophoresis. Hb electrophoresis is widely accepted as an important diagnostic tool for the thalassemia and haemoglobinopathies [14].
The strength of this study is that, we have identified the presence of haemoglobin disorder even in non terai region i.e., Pokhara, though the study population is very small. This indicates the need of population based screening program. In addition, the use of automated and standardized methods for measuring blood parameters and quantification of haemoglobin pattern has ensured detection accuracy, although no comparative study was performed.
Conclusion
Findings of our study suggest mass screening of thalassemia and haemoglobinopathies throughout the country, which can be used in lineage study, genetic study, etc., to prevent morbidity and mortality due to haemoglobin disorders.
Limitation
The required sample size may be low due to time constraint, limited resources and strict inclusion criteria. The strength of paper could have been increased if the time duration was more and study sample size was high and if alpha thalassemia cases were also included.
Ethical Clearance
Ethical Clearance for the use of hospital samples was taken from hospital administration. Permission for this study was also obtained from the institution.
Declaration
We declare that all the authors contributed significantly in various steps of this research reporting. We also declare that we have no conflict of interest.
MCV = Mean Cell Volume, MCH = Mean Cell Haemoglobin, RBC = Red Blood Cell, fl = Femtoliters, pg = Picograms, SD = Standard Deviation
Note: The gender wise distribution of study subjects and their haematological parameters measured as Hb, RBC count, MCV and MCH. Low levels of Hb, MCV and MCH were seen in all study groups irrespective of age and sex.
HBA = Haemoglobin A, HBA2 = Haemoglobin A2, HbF = Fetal Haemoglobin, HbE = Haemoglobin E
Note: The quantitative result of abnormal Haemoglobin pattern after densitometric reading in subjects with suspected beta thalassaemia trait and heterozygote HbE. In both cases of beta thalassaemia (subject 1 and 2), HBA2 level was above cut off value (i.e., >3.5%) which is the study criteria of our study for beta thalassaemia trait. In alkaline electrophoresis, HbA2 and HbE co-migrate, but the level of HbA2 rarely exceeds 10%. In our study, the combined value of HbA2 and heterozygote HbE was 35.5% suggestive of presence of heterozygote HbE in subject 3
[1]. Muncie HL. Jr, Campbell J, Alpha and beta thalassaemiaAm Fam Physician 2009 80(4):339-44. [Google Scholar]
[2]. Langlois S, Ford JC, Chitayat D, Desilets VA, Farrell SA, Geraghty M, Carrier screening for thalassaemia and Haemoglobinopathies in CanadaJ Obstet Gynaecol Can 2008 30(10):950-71. [Google Scholar]
[3]. Galanello R, Origa R, Beta-thalassaemiaOrphanet J Rare Dis 2010 5:11 [Google Scholar]
[4]. Jha R, Jha S, Beta thalassaemia-A reviewJournal of Pathology of Nepal 2014 4(8):663-71. [Google Scholar]
[5]. Jha R, Distribution of Haemoglobinopathies in patients presenting for electrophoresis and comparison of result with High performance liquid chromatographyJ Path Nepal 2015 5(10):850-58. [Google Scholar]
[6]. Majhi S, Mishra A, Mehta KD, Baral N, Shrestha P, Detection of beta-thalassaemia (homozygous) by Haemoglobin electrophoresis on agar gel and citrate agar medium: a case reportNepal Med Coll J 2007 9(1):70-71. [Google Scholar]
[7]. Sakai Y, Kobayashi S, Shibata H, Furuumi H, Endo T, Fucharoen S, Molecular analysis of alpha-thalassaemia in Nepal: correlation with malaria endemicityJ Hum Genet 2000 45(3):127-32. [Google Scholar]
[8]. Colah RB, Surve R, Sawant P, D’Souza E, Italia K, Phanasgaonkar S, HPLC studies in HaemoglobinopathiesIndian J Pediatr 2007 74(7):657-62. [Google Scholar]
[9]. Clarke GM, Higgins TN, Laboratory investigation of Haemoglobinopathies and thalassaemias: review and updateClin Chem 2000 46(8 Pt 2):1284-90. [Google Scholar]
[10]. Balgir RS, Spectrum of Haemoglobinopathies in the state of Orissa, India: a ten years cohort studyJ Assoc Physicians India 2005 53:1021-26. [Google Scholar]
[11]. Pranpanus S, Sirichotiyakul S, Srisupundit K, Tongsong T, Sensitivity and specificity of mean corpuscular Haemoglobin (MCH): for screening alpha-thalassaemia-1 trait and beta-thalassaemia traitJ Med Assoc Thai 2009 92(6):739-43. [Google Scholar]
[12]. Fucharoen G, Sanchaisuriya K, Sae-ung N, Dangwibul S, Fucharoen S, A simplified screening strategy for thalassaemia and haemoglobin E in rural communities in south-east AsiaBull World Health Organ 2004 82(5):364-72. [Google Scholar]
[13]. Sanchaisuriya K, Fucharoen S, Fucharoen G, Ratanasiri T, Sanchaisuriya P, Changtrakul Y, A reliable screening protocol for thalassaemia and Haemoglobinopathies in pregnancy: an alternative approach to electronic blood cell countingAm J Clin Pathol 2005 123(1):113-18. [Google Scholar]
[14]. Kim JE, Kim BR, Woo KS, Kim JM, Park JI, Han JY, Comparison of capillary electrophoresis with cellulose acetate electrophoresis for the screening of HaemoglobinopathiesKorean J Lab Med 2011 31(4):238-43. [Google Scholar]
[15]. Kohne E, Haemoglobinopathies: clinical manifestations, diagnosis, and treatmentDtsch Arztebl Int 2011 108(31-32):532-40. [Google Scholar]
[16]. Evans DI, Haemoglobin electrophoresis on cellulose acetate using whole blood samplesJ Clin Pathol 1971 24(9):877-78. [Google Scholar]
[17]. Khosa SM, Usman M, Moinuddin M, Mehmood HO, Qamar K, Comparative analysis of cellulose acetate Haemoglobin electrophoresis and high performance liquid chromatography for quantitative determination of Haemoglobin A2Blood Res 2015 50(1):46-50. [Google Scholar]
[18]. Kumar D, Genomics and Health in the Developing World. First Edition 2012 New YorkOxford University PressCh.19.The management of inherited blood diseases in the Indian subcontinent. Pg 1089-92 [Google Scholar]