Introduction
Diabetes mellitus constitutes a serious public health concern worldwide [1]. It occurs as a result of either insulin deficiency due to the loss of pancreatic beta cells (type 1 diabetes) or insulin insensitivity/resistance (type 2 diabetes) [2]. Hyperglycaemia is the hallmark of both types of diabetes. The common deleterious effects of diabetes are neuropathy, nephropathy, retinopathy and cardiovascular diseases. But it can affect the mineralized skeletal tissue also leading to either bone demineralization or changes in the bone matrix or both resulting in bone fragility. Conversely, there is evidence that secretion of insulin can be affected by bone [3]. Both type 1 (T1DM) and type 2 Diabetes (T2DM) are known to have significant effects on bone health [3].
Quality of the alveolar bone is a key factor in the pathogenesis of Diabetes Mellitus (DM) related oral diseases. Hence, evaluation of mandibular bone density is of utmost importance for diagnosis as well as management strategies like implant placement, grafting in periodontal problems etc., [4]. Unfortunately, studies concerning the relationship between diabetes and the alterations in mandibular Bone Mineral Density (BMD) are few. But due to large number of patients with DM, this condition cannot be neglected in the daily routine of dental clinics. Dual Energy X-Ray Absorptiometry (DEXA) is the widely accepted gold standard method of clinical bone mineral measurement [5].
Even though studies have shown that mandibular BMD measurements by DEXA are comparable with that of lumbar spine, femoral neck and forearm, they are seldom used because of superimposition of opposite side [6-9]. Another limitation of DEXA is that, it is an expensive technique and therefore, a less expensive alternative should be agreed upon, to assess the skeletal density [10]. Panoramic radiographs are one of the routinely taken radiographs in dental practice [11].
Literature search revealed that the thickness of the inferior cortex of the mandible is found to be useful in predicting occurrence of osteoporosis in people [12]. For the quantitative and qualitative assessment of mandibular bone mass and resorption, a number of radiomorphometric indices are available and they are used in studies to evaluate BMD of mandible which show substantial correlation also. Many studies have shown a good correlation between mandibular and skeletal BMD as well [13].
Hence, the aim of the present study was to perform radiomorphometric measurements of the mandibular bone on panoramic radiographs of diabetics and non diabetic individuals so that diabetes induced mandibular bony changes could be assessed. The secondary objectives of the study were to determine: (1) any difference in bone morphology between T1DM and T2DM and also in diabetics on Calcium/vitamin D supplementation; (2) any co-relation between HbA1c values and panoramic radiomorphometric indices.
Materials and Methods
This cross-sectional study was approved by the Ethical Committee at Amrita School of Dentistry, Kochi, Kerala, India, where the study was conducted. A written informed consent was obtained from all participants. This study was done on patients who visited Department of Oral and Maxillofacial Radiology during the period December 2014 to March 2016. Patients with HbA1c level > 6.5% were included in the study. Patients with completely edentulous mandible, parafunctional habits like bruxism, unilateral chewing etc, patients with history of traumatic injuries to mandible, orthognathic surgeries, any jaw bone pathology, radiotherapy to head and neck region and other systemic illnesses affecting bone were excluded from the study.
A total of 100 people were included in this pilot study which consisted of 75 diabetic patients and 25 non diabetic individuals. The study population was divided equally among four subgroups. Group 1 had 25 non-diabetic individuals (Controls), Group 2 had 25 T2DM patients, Group 3 had 25 T2DM patients on Ca/vit D supplements and Group 4 had 25 T1DM patients. A panoramic radiograph was taken for all sample population as advised by their respective clinicians as a part of investigation related to their oral complaints. Images were taken using SIRONA ORTHOPHOS XG5 with following exposure factors ie 74 KVp, 8 mA, 14.1 sec which resulted in an exposure of 15 μSv and a magnification of 19%. Images were saved and viewed in DICOM format. Patient factors including demographic data, diabetes history as well as recent blood sugar level were recorded.
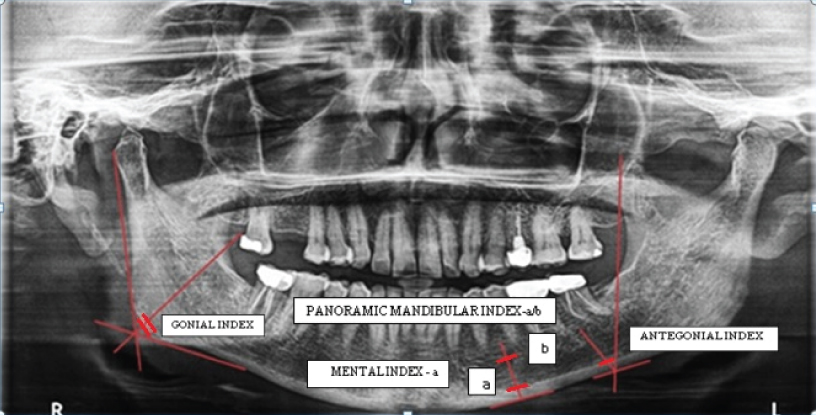
In order to achieve a standard, the radiographs were taken by a single examiner. Patients were positioned in the dental panoramic machine in such a way that the vertical line produced by the machine was aligned with the patient’s sagittal plane and the horizontal line (Frankfort plane) parallel to the floor. After taking DICOM printout, all indices [Table/Fig-1] [14,15] were manually drawn and measurements were taken using a graduated scale and divider [Table/Fig-2].
Description of radiomorphometric indices [14,15].
| Index | Description | Normal Value |
|---|
| Panoramic Mandibular Index (PMI) | Calculated as the ratio of the mandibular cortical thickness measured on the line perpendicular to the bottom of the mandible, at the middle of mental foramen, by the distance between the superior margin of mental foramen and bottom of the mandible. | >0.3 |
| Mental Index (MI) | The measurement of the mandibular cortical thickness on the line perpendicular to the bottom of the mandible at the middle of the mental foramen. | >3.1 mm |
| Antegonial Index (AI) | The measurement of the mandibular cortical thickness measured on the line perpendicular to the mandibular cortex at the intersection with the tangent line to the anterior border of the ramus. | >3.2 mm |
| Gonial Index(GI) | The measurement of the mandibular cortical thickness measured on the bisectrix of the angle between the tangent lines to the posterior border of the ramus of mandible and the bottom of the mandible. | >1.2 mm |
Radiomorphometric indices – Gonial index, Antegonial index, Mental index. (a) Panoramic mandibular index (a/b)
Statistical Analysis
Statistical Analysis was done using IBM SPSS Statistics 20 windows (SPSS Inc., Chicago, USA). Kruskal wallis test was used to compare panoramic indices between groups. Since it was significant, dunn bonferroni test was applied. To obtain the relationship between HbA1c and panoramic indices, Karl pearson correlation method was applied. The p-value of < 0.05 was considered as statistically significant.
Results
The average age of the study population was 50.86±11.54 years. The mean duration of diabetes in the present study population was 8.51±6.98 years. The mean HbA1c value of diabetic patients was 8.12±2.16 %. Among the diabetic population, 40% had family history of diabetes. Insulin users constituted 36% of the diabetic patients where as 53.3% were on multiple oral hypoglycemic drugs. Rest of the diabetics (10.6%) used both controlling measures. We had equal distribution of male and female population in all 4 groups i.e., 25% each.
The results showed that panoramic mandibular index has no appreciable variation between diabetic patients and healthy controls [Table/Fig-3].
Comparison of average PMI between groups.
| Groups | N | Mean±SD (mm) | f-value | p-value |
|---|
| Controls | 25 | 0.21±0.04 | 1.385 | 0.25 (NS) |
| T2DM | 25 | 0.17±0.02 |
| T2DM on Ca/vit D | 25 | 0.28±0.36 |
| T1DM | 25 | 0.22±0.05 |
NS-Non significant; **Test applied-Kruskal wallis test
When the average MI between 4 groups was compared, it was found to be statistically significant (p-value < 0.05) [Table/Fig-4]. Hence it can be inferred that the mean value of mental index of diabetic patients were less than that of healthy controls.
Comparison of average MI between groups.
| Groups | N | Mean±SD (mm) | f-value | p-value |
|---|
| Controls | 25 | 3.14±0.51 | 4.221 | 0.008 (S) |
| T2DM | 25 | 2.82±0.38 |
| T2DM on Ca/vit D | 25 | 2.82±0.47 |
| T1DM | 25 | 2.73±0.38 |
S-Significant; *Test applied-Kruskal wallis test
The result of pairwise comparison of mental index within groups is depicted in [Table/Fig-5]. The comparison of MI between controls and T1DM was found to be statistically significant (p-value <0.05).
Pairwise comparison of MI within groups.
| Parameter | Groups | p-value |
|---|
| MI | Controls | T2DM | 0.072 |
| T2DM on Ca/vit D | 0.067 |
| T1DM | 0.008 (S) |
| T2DM | T2DM on Ca/vit D | 1.000 |
| T1DM | 0.989 |
| T2DM on Ca/vit D | T1DM | 0.345 |
S–Significant; *Test applied - dunn bonferroni
The average AI between four groups when compared was found to be statistically highly significant (p-value <0.001) [Table/Fig-6]. This shows that the mean value of antegonial index in diabetic subjects was significantly less than non diabetic subjects.
Comparison of average AI between groups.
| Groups | N | Mean±SD (mm) | f-value | p-value |
|---|
| Controls | 25 | 3.12±0.33 | 21.246 | < 0.001 (HS) |
| T2DM | 25 | 2.57±0.28 |
| T2DM on Ca/vit D | 25 | 2.49±0.33 |
| T1DM | 25 | 2.69±0.25 |
HS-Highly significant; *Test applied-Kruskal wallis test
The pair wise comparison [Table/Fig-7] revealed that AI between controls and all other groups were found to be highly significant (p-value <0.001). Hence, it can be concluded that AI value of T1DM, T2DM and T2DM on Ca/vit D were significantly lower than non diabetic individuals.
Pairwise comparison of AI within groups.
| Parameter | Groups | p-value |
|---|
| AI | Controls | T2DM | < 0.001 (HS) |
| T2DM on Ca/vit D | < 0.001 (HS) |
| T1DM | < 0.001 (HS) |
| T2DM | T2DM on Ca/vit D | 0.426 |
| T1DM | 0.924 |
| T2DM on Ca/vit D | T1DM | 0.123 |
HS-Highly significant; *Test applied-dunn bonferroni
When the average GI between 4 groups were compared, it was found to be statistically highly significant (p-value <0.001) [Table/Fig-8]. This demonstrated that the mean gonial index of diabetic patients is very less when compared with normal individuals.
Comparison of average GI between groups.
| Groups | N | Mean±Sd (Mm) | f-value | p-value |
|---|
| Controls | 25 | 1.20±0.30 | 21.083 | < 0.001 (HS) |
| T2DM | 25 | 0.74±0.23 |
| T2DM on Ca/vit D | 25 | 0.68±0.23 |
| T1DM | 25 | 0.91±0.23 |
HS-Highly significant; *Test applied-Kruskal wallis test
The pairwise comparison [Table/Fig-9] showed that the GI value was found to be highly significant between controls and T2DM as well as T2DM on Ca/vit D i.e., (p < 0.001). The GI was also found to be significant when compared between controls and diabetic groups as well as between TIDM and T2DM on Ca/vit D (p < 0.05).
Pairwise comparison of GI within groups.
| Parameter | Groups | p-value |
|---|
| GI | Controls | T2DM | < 0.001 (HS) |
| T2DM on Ca/vit D | < 0.001 (HS) |
| T1DM | 0.001(S) |
| T2DM | T2DM on Ca/vit D | 0.9877 |
| T1DM | 0.106 |
| T2DM on Ca/vit D | T1DM | 0.009 (S) |
HS-Highly significant; S-Significant; *Test applied-dunn bonferroni
The correlation between HbA1c values of the study subjects and the radiomorphometric indices was assessed [Table/Fig-10]. The PMI showed a positive correlation with HbA1c value but it was not statistically significant. The MI showed a negative correlation with HbA1c values but again values were not statistically significant. Both AI and GI showed negative correlation with HbA1c values and they were statistically significant (p-value < 0.05). These results indicated that antegonial index and gonial index values increased when the HbA1c values decreased. Hence our study revealed that when HbA1c values are maintained within their normal range, the bone density can be improved.
Correlation between HbA1c values and RMIs.
| Variable | N | HbA1c | p-value |
|---|
| Correlation Coefficient |
|---|
| PMI | 100 | 0.014 | 0.886 |
| MI | 100 | -0.160 | 0.113 |
| AI | 100 | -0.341 | 0.001 (S) |
| GI | 100 | -0.230 | 0.021 (S) |
S-Significant; *Test applied-Karl pearson correlation method
Discussion
Diabetes is the most common non communicable disease globally which requires lifelong care [16]. Bone health is a crucial concern in diabetes. Both type 1 as well as type 2 diabetes have been associated with increased fracture risk through similar but potentially diverse mechanisms [3,17]. The difference between the effects of T1DM and T2DM on bone mass can be attributed to their opposite insulin-secretory pattern ie hypoinsulinemia vs hyperinsulinemia [17,18]. Medical literature review provides evidences for relating diabetes mellitus as a risk factor for osteoporotic fractures [19]. Despite a huge amount of accumulated data on the effect of diabetes on bone, many queries remain unanswered, with various researches producing contradictory results. This may be due to the complicated pathophysiology of diabetes, variations in the skeletal sites examined, difference in techniques employed for bone density assessment as well as due to the differences in the duration, severity and treatment aspects of diabetes in various studies [17].
Panoramic radiography is relatively inexpensive and is regarded as an important screening radiograph of dental diagnostic radiology. In order to assess the signs of resorption and osteoporosis based on bone quality and quantity, multiple qualitative and quantitative indices like the Mandibular Cortical Index (MCI), Panoramic Mandibular Index (PMI), Mental Index (MI) and Antegonial Index (AI) has been developed using panoramic radiographs [20]. Multiple studies have demonstrated a correlation between mandibular cortical analyses of dental panoramic radiographs and lumbar spine & hip BMDs [11,21-23]. Dagistan S et al., Leite A F et al., Taguchi A et al., Ledgerton D, Dutra V et al., Benson BW et al., had validated the efficacy of panoramic radiomorphometric indices in diagnosing low BMD through their studies [11,21,23-26]. As far as we are aware, there are no studies comparing the PMI, MI, AI and GI values in the panoramic radiographs of diabetes mellitus patients with that of normal population.
Family history of a particular disease entity replicates the effects of genetic susceptibility, shared environment and general behaviours [27]. Among our study population, 40% had positive family history. This result is consistent with Marinho NB et al., and Shaikh MA et al., reports which revealed family history of diabetes in 47% patients [28,29]. The current status of mean HbA1c level of diabetic subjects in our study was 8.12%. This is comparable with the results of Yousefzadeh G et al research where the diabetic subjects had mean HbA1c level 8.56% [30]. In Harris SB et al., study done among Canadian population as well as in Mark T et al., study among Australian patients, the average HbA1c values were 7.7% and 7.3% respectively [31,32]. This is less when compared with our Indian population. This difference in diabetic status can be attributed to the interplay of socioeconomic features of the locality as well as to the inappropriate knowledge about disease management.
Our study highlights the significance of measuring the blood sugar level with HbA1c. Many patients take increased amount of antidiabetic medicines or fast before they come to check blood sugar level. This can produce erroneous values if it is Random Blood Sugar (RBS)/Post Prandial Blood Sugar (PPBS). But in case of HbA1c test, such subjective errors will be overrided because it identifies average plasma glucose concentration over a time period rather than on the day of test which can be reflected on bone density as well. According to American Diabetic Association, HbA1c level 7% or less is considered as good glucose control [33]. The outcomes of our study demonstrated that only 37.3% of diabetic patients had acceptable HbA1c value of <7%. The remaining ones had undesirable diabetic status. Psychosocial impacts, inadequate self care regimens, detachment to healthcare amenities and non-compliance to treatment may be the limiting factors for poor glycaemic control in the developing countries including ours [34].
All the radiomorphometric indices except the PMI revealed significant difference between diabetic patients and healthy individuals. This difference demonstrated the quantitative bone changes due to diabetes and also that these indices could demonstrate these changes. The thickness of mandibular cortex below mental foramen should be <3 mm has been stated as an efficient parameter for diagnosis of low bone mineral density in ample number of studies [11,21,23]. Due to lack of related studies of panoramic radiomorphometric indices, involving diabetic patients, we do not have sufficient data with which to compare our results.
The mean value of mental index of diabetic patients in our study was less than that of healthy individuals. Devlin H and Horner K [35] evaluated the validity of various cortical indices and reported that MI contributed significantly to the diagnosis of low mineral density of skeletal bone. Pair wise comparisons of all groups with respect to MI, revealed that T1DM patients had significantly low bone mineral density when compared with healthy controls. Similar findings have been noted by Gunczler P et al., Valerio G et al., and Saha M T et al., in their study population [16,18,36]. Osteoblastic dysfunction rather than osteoclastic overfunction is suggested as the main cause for low bone mineral density in T1DM [37]. Early age at diagnosis leading to decreased bone build up, longer duration, sustained poor glycemic control and high insulin doses are other related causes behind decreased BMD in T1DM [38]. There is relative scarcity of studies regarding low mineral density in T1DM from India. In this regard, our results are consistent with the results of Joshi A et al., study from Western India [22]. Hence, it may be concluded that Indian patients with T1DM are at an increased risk for fracture.
Ledgerton D et al., evaluated AI measurements of 500 panoramic radiographs in terms of age, dentition and social class [24]. From their results, they interpreted AI as a possible indicator of skeletal osteopenia. Bras J et al., recommended that gonial cortical thickness less than 1 mm can be considered as an indicator of metabolic bone loss [39]. Kribbs PJ et al., also supported this by suggesting a correlation between cortical thickness at gonion and BMD of spine and cubitus [20,40]. The mean GI and AI of diabetic patients was very less when compared to non diabetic individuals in our study. Pairwise comparisons between various groups with respect to AI and GI values demonstrated that both T1DM and T2DM patients had significantly low bone mineral density than normal control subjects.
Our findings were similar to the Wang XR et al., and Yaturu S et al., results where decreased BMD was reported in T2DM [41,42]. Even though bone metabolism is influenced by type 2 diabetes mellitus, its relation with bone mineral density remains conflicting across studies [43]. Various studies have shown that BMD in T2DM can either be similar, increased or decreased in comparison with healthy controls. The accurate pathophysiology behind bone density changes in T2DM has not been well clarified. Literature review suggests that BMD in T2DM can be influenced by several pathogenetic factors and multiple acquired conditions pertaining to diabetes. Circulating insulin/insulin growth factors as well as estrogen levels are the key pathogenetic factors [38].
The decreased BMD noted in our T2DM patients is contradictory to the reports of Raj S et al., and Sahin G et al, where increased BMD is observed in T2DM patients when compared with healthy controls [44,45]. Adil C et al., and Ay S et al., demonstrated that bone mineral density does not seem to be affected in T2DM patients which is also incompatible with our results [27,46]. The differences in these results can be attributed to the huge discrepancies in the study design, methods of BMD assessment and variations in the site of BMD analysis, selection of patients and difference in duration of DM and presence or absence of complications [43].
Calcium and vitamin D have long been accepted as valuable and essential nutrients for bone health. The mechanisms behind the effect of vitamin D or calcium on type 2 diabetes are not clear. In both animal and human studies, impaired pancreatic β-cell function has been reported with vitamin D insufficiency [33,47-49] while vitamin D supplementation restores insulin secretion [48,50-54]. In our study, we assessed the influence of calcium/vitamin D supplements on bone health in type 2 diabetes. The results suggested no significant improvement in BMD due to intake of calcium/vitamin D supplements. Former studies with vitamin D supplementation in patients with type 2 diabetes have shown conflicting results according to literature [51,52,54,55]. Lesser number of study population as well as variation in the formulation of vitamin D/ calcium taken by study population may be a reason for inconclusive results in our study. Also, we didn’t take in to consideration the impact of duration of diabetes and antidiabetic therapy as well as duration of Ca/vit D therapy while assessing the influence of calcium/vitamin D on bone health. Hence, randomized controlled trials specifically designed for these outcomes should be carried out to obtain more objective inferences.
Due to improved insights regarding the role of HbA1c in diabetes scenario, HbA1c has become a premier spot of clinical research today. Present study pointed out that when HbA1c values are maintained within their normal range, the bone density can be improved. This is in agreement with Danielson KK et al., who stated that optimal glycemic control may prevent low BMD leading to reduction in fracture risk [34]. The strengths of our study are: 1) Standardized evaluation of the radiographs of the study population; 2) Selection of age and sex matched diabetic patients as well as control population; 3) Equal distribution of men and women in all groups thus enabling a comparison between respective groups; 4) Standardized documentation of all diabetes related parameters thus ensuring a high quality data.
The panoramic radiographs are associated with intrinsic errors and observer variability. So, there will be limitation in the repeatability of panoramic radiographic measurements. Another limitation is the relatively small sample size of diabetic patients with respect to the complex questions addressed in the study. Hence, this study can be considered as an initial work on the same and further studies with large sample size taking in to consideration disease duration as well as treatment period are required to draw solid conclusions.
Conclusion
MI, AI and GI can be used as primary screening tool for evaluating quantitative bone changes due to diabetes. Due to different pathogenesis of type 1 and type 2 diabetes mellitus, the ensuing bone changes also differ. The HbA1c levels are more predictive of diabetic status and the resultant bone changes. Hence its maintenance within normal limits may lead to improved bone density.
NS-Non significant; **Test applied-Kruskal wallis test
S-Significant; *Test applied-Kruskal wallis test
S–Significant; *Test applied - dunn bonferroni
HS-Highly significant; *Test applied-Kruskal wallis test
HS-Highly significant; *Test applied-dunn bonferroni
HS-Highly significant; *Test applied-Kruskal wallis test
HS-Highly significant; S-Significant; *Test applied-dunn bonferroni
S-Significant; *Test applied-Karl pearson correlation method
[1]. IDF Diabetes Atlas, Fifth Edition. The global burden: prevalence and projections [Google Scholar]
[2]. Stang J, Story M, Guidelines for Adolescent nutrition services 2005 :167-82. [Google Scholar]
[3]. McCabe LR, The Diabetes-Bone relationshipJ Diabetes Metab 2012 :S1-001. [Google Scholar]
[4]. Ay S, Gursoy UK, Erselcan T, Murakoglu I, Assessment of mandibular bone density in patients with type 2 DMDentomaxillofac Radiol 2005 34:327-31. [Google Scholar]
[5]. Syed Z, Khan A, Bone densitometry: applications and limitationsJ Obstet Gynaecol Can 2002 24(6):476-84. [Google Scholar]
[6]. Horner K, Devlin H, The relationships between two indices of mandibular bone quality and bone mineral density measured by dual energy X-ray absorptiometryDentomaxillofac Radiol 1998 27:17-21. [Google Scholar]
[7]. Drozdzowska B, Pluskiewicz W, Tarnawska B, Panoramic-based mandibular indices in relation to mandibular bone mineral density and skeletal status assessed by dual energy X-ray absorptiometry and quantitative ultrasoundDentomaxillofac Radiol 2002 31:361-67. [Google Scholar]
[8]. Corten FG, van’t Hof MA, Buijs WC, Hoppenbrouwers P, Kalk W, Corstens FH, Measurement of mandibular bone density ex vivo and in vivo by dual-energy X-ray absorptiometryArch Oral Biol 1993 38:215-19. [Google Scholar]
[9]. Horner K, Devlin H, The relationship between mandibular bone mineral density and panoramic radiographic measurementsJ Dent 1998 26:337-43. [Google Scholar]
[10]. Gaur B, Chaudhary A, Wanjari PV, Sunil MK, Basavaraj P, Evaluation of panoramic Radiographs as a Screening Tool of Osteoporosis in Post Menopausal Women: A Cross Sectional StudyJ Clin Diagn Res 2013 7(9):2051-55. [Google Scholar]
[11]. Dagistan S, Bilge OM, Comparison of antegonial index, mental index, panoramic mandibular index and mandibular cortical index values in the panoramic radiographs of normal males and male patients with osteoporosisDentomaxillofac Radiol 2010 39:290-94. [Google Scholar]
[12]. Govindraju P, Chandra P, Radiomorphometric Indices of the Mandible – An Indicator of OsteoporosisJ Clin Diagn Res 2014 8(3):195-98. [Google Scholar]
[13]. Gulsahi A, Paksoy CS, Ozden S, Kucuk N O, Cebeci ARI, Genc Y, Assessment of bone density in the jaws and its relationship to radiomorphometric indicesDentomaxillofac Radiol 2010 39:284-89. [Google Scholar]
[14]. Asha ML, Bajoria AA, Babshet M, Patil P, Naveen S, Bone mineral density measurement of the jaws– a reviewJ Investigative Dent Sci 2014 1(1):1-8. [Google Scholar]
[15]. Bajoria AA, Asha ML, Kamath G, Babshet M, Patil P, Sukhij P, Evaluation of radiomorphometric indices in panoramic radiograph – a screening toolThe Open Dent J 2015 9:303-10. [Google Scholar]
[16]. Gunczler P, Lanes R, Paz Martinez V, Martinis R, Esaa S, Colmenares V, Decreased lumbar spine bone mass and low bone turnover in children and adolescents with insulin dependent diabetes mellitus followed longitudinallyJ Pediatr Endocrinol Metab 1998 11:413-19. [Google Scholar]
[17]. Brandi ML, Bone health and diabetesMedicographia 2010 32:364-69. [Google Scholar]
[18]. Saha MT, Sievanen H, Salo MK, Tulokas S, Saha HH, Bone mass and structure in adolescents with type 1 diabetes compared to healthy peersOsteoporos Int 2009 20:1401-06. [Google Scholar]
[19]. Hofbauer LC, Brueck CC, Singh SK, Dobnig H, Osteoporosis in patients with diabetes mellitusJ Bone Miner Res 2007 22:1317-28. [Google Scholar]
[20]. Kribbs PJ, Chestnut CH 3rd, Ott SM, Kilcoyne RF, Relationships between mandibular and skeletal bone in an osteoporotic populationJ Prosthet Dent 1989 62:703-07. [Google Scholar]
[21]. Leite AF, Figueiredo PT, Guia CM, Melo NS, de Paula AP, Correlations between seven panoramic radiomorphometric índices and bone mineral density in postmenopausal womenOral Surg Oral Med Oral Pathol Oral Radiol Endod 2010 109(3):449-56. [Google Scholar]
[22]. Joshi A, Varthakavi P, Chadha M, Bhagwat N, A study of bone mineral density and its determinants in type 1 diabetesJ Osteoporos 2013 2013:397814 [Google Scholar]
[23]. Taguchi A, Tsuda M, Ohtsuka M, Kodama I, Sanada M, Nakamoto T, Use of dental panoramic radiographs in identifying younger postmenopausal women with osteoporosisOsteoporos Int 2006 17(3):387-94. [Google Scholar]
[24]. Ledgerton D, Horner K, Devlin H, Worthington H, Radiomorphometric indices of the mandible in a British female populationDentomxillofac Radiol 1999 28(3):173-81. [Google Scholar]
[25]. Dutra V, Devlin H, Susin C, Yang J, Horner K, Fernandes ARC, Mandibular morphological changes in low bone mass edentulous females: evaluation of panoramic radiographsOral Surg Oral Med Oral Pathol Oral Radiol Endod 2006 102:663-68. [Google Scholar]
[26]. Benson BW, Prihoda TJ, Glass BJ, Variations in adult cortical bone mass as measured by a panoramic mandibular indexOral Surg Oral Med Oral Path 1991 71:349-56. [Google Scholar]
[27]. Adil C, Aydin T, Taspinar O, Kiziltan H, Eriş AH, Hocaoglu IT, Bone mineral density evaluation of patients with type 2 diabetes mellitusJ Phy Ther Sci 2015 27(1):179-82. [Google Scholar]
[28]. Marinho NB, Vasconcelos HC, Alencar AM, Almeida PC, Damasceno MM, Risk for type 2 diabetes mellitus and associated factorsAct Paul Enferm 2013 26(6):569-74. [Google Scholar]
[29]. Shaikh MA, Yakta D, Baloch GH, Shaikh D, The age of onset of type 2 diabetes mellitus in adult populationAnn Pak Inst Med Sci 2008 4(2):109-12. [Google Scholar]
[30]. Yousefzadeh G, Shokoohi M, Najafipour H, Inadequate control of diabetes and metabolic indices among diabetic patients: A population based study from the Kerman Coronary Artery Disease Risk Study (KERCADRS)Int J Health Policy Manag 2015 4(5):271-77. [Google Scholar]
[31]. Harris SB, Worrall G, Macaulay A, Norton P, Webster-Bogaert S, Donner A, Diabetes management in Canada: baseline results of the group practice diabetes management studyCan J Diabetes 2006 30:131-37. [Google Scholar]
[32]. Mark T, Andrew J, Merlin C, The management of diabetes in Indigenous Australians from primary careBMC Public Health 2007 7:303 [Google Scholar]
[33]. Scragg R, Sowers M, Bell C, Serum 25-hydroxyvitamin D, diabetes, and ethnicity in the Third National Health and Nutrition Examination SurveyDiabetes Care 2004 27:2813-18. [Google Scholar]
[34]. Danielson KK, Elliott ME, LeCaire T, Binkley N, Palta M, Poor glycaemic control s associated with low BMD detected in Premenopausal Women with Type 1 DiabetesOsteoporos Int 2009 20(6):923-33. [Google Scholar]
[35]. Devlin H, Horner K, Mandibular radiomorphometric indices in the diagnosis of reduced skeletal bone mineral densityOsteoporos Int 2002 13(5):373-78. [Google Scholar]
[36]. Valerio G, del Puente A, Esposito del Puente A, Buono P, Mozzillo E, Franzese A, The lumbar bone mineral density is affected by long-term poor metabolic control in adolescents with type 1 diabetes mellitusHorm Res 2002 58:266-72. [Google Scholar]
[37]. Dhaon P, Shah VN, Type 1 diabetes and osteoporosis: A review of literatureIndian J Endocr Metab 2014 18:159-65. [Google Scholar]
[38]. Kamalanathan S, Nambiar V, Shivane V, Bandgar T, Menon P, Shah N, Bone mineral density and factors influencing it in Asian Indian population with type 2 diabetes mellitusIndian J Endocr Metab 2014 18:831-37. [Google Scholar]
[39]. Bras J, van Ooij CP, Abraham-Inpijn L, Kusen G J, Wilmink JM, Radiographic interpretation of mandibular angular cortex: a diagnostic tool in metabolic and tooth loss. Part I. Normal StateOral Surg Oral Med Oral Path 1982 53:541-45. [Google Scholar]
[40]. Kribbs PJ, Chestnut CH 3rd, Ott SM, Kilcoyne RF, Relationships between mandibular and skeletal bone in a population of normal womenJ Prosthet Dent 1990 63:86-89. [Google Scholar]
[41]. Wang XR, Pei Y, Correlation of bone mineral density with disease duration and body mass in elderly men with type 2 diabetes mellitusJ Clin Rehab Tissue Eng Res 2008 15:2891-94. [Google Scholar]
[42]. Yaturu S, Humphrey S, Landry C, Jain SK, Decreased bone mineral density in men with metabolic syndrome alone and with type 2 diabetesMed Sci Monit 2009 15:5-9. [Google Scholar]
[43]. Ma L, Oci L, Jiang L, Estrade K, Chen H, Wang Z, Association between bone mineral density and type 2 diabetes mellitus: a meta analysis of observational studiesEur J Epidemiol 2012 27:319-32. [Google Scholar]
[44]. Raj S, Baiju SJ, Vijayan R, Rajan GV, Association between bone mineral density and type 2 diabetes mellitus-an original articleBr J Res 2014 ISSN:2394-3718. [Google Scholar]
[45]. Sahin G, Bağis S, Cimen OB, Ozişik S, Güler H, Erdoğan C, Lumbar and femoral bone mineral density in type 2 Turkish diabetic patientsActa Med 2001 44:141-43. [Google Scholar]
[46]. Ay S, Gursoy UK, Erselcan T, Marakoglu I, Assessment of mandibular bone mineral density in patients with type 2 diabetes mellitusDentomaxillofac Radiol 2005 34:327-31. [Google Scholar]
[47]. Chiu KC, Chu A, Go VL, Saad MF, Hypovitaminosis D is associated with insulin resistance and beta cell dysfunctionAm J Clin Nutr 2004 79:820-25. [Google Scholar]
[48]. Norman AW, Frankel JB, Heldt AM, Grodsky GM, Vitamin D deficiency inhibits pancreatic secretion of insulinScience 1980 209:823-25. [Google Scholar]
[49]. Baynes KC, Boucher BJ, Feskens EJ, Kromhout D, Vitamin D, glucose tolerance and insulinaemia in elderly menDiabetologia 1997 40:344-47. [Google Scholar]
[50]. Pittas AG, Start PC, Harris SS, Hughes BD, The effects of calcium and vitamin D supplementation on Blood Glucose and markers of inflammation in Non diabetic adultsDiabetes Care 2007 30:980-86. [Google Scholar]
[51]. Gedik O, Akalin S, Effects of vitamin D deficiency and repletion on insulin and glucagon secretion in manDiabetologia 1986 29:142-45. [Google Scholar]
[52]. Orwoll E, Riddle M, Prince M, Effects of vitamin D on insulin and glucagon secretion in non-insulin-dependent diabetes mellitusAm J Clin Nutr 1994 59:1083-87. [Google Scholar]
[53]. Tanaka Y, Seino Y, Ishida M, Yamaoka K, Yabuuchi H, Ishida H, Effect of vitamin D3 on the pancreatic secretion of insulin and somatostatinActa Endocrinol (Copenh) 1984 105:528-33. [Google Scholar]
[54]. Borissova AM, Tankova T, Kirilov G, Dakovska L, Kovacheva R, The effect of vitamin D3 on insulin secretion and peripheral insulin sensitivity in type 2 diabetic patientsInt J Clin Pract 2003 57:25-61. [Google Scholar]
[55]. Fliser D, Stefanski A, Franek E, Fode P, Gudarzi A, Ritz E, No effect of calcitriol on insulin-mediated glucose uptake in healthy subjectsEur J Clin Invest 1997 27:629-33. [Google Scholar]