According to recent data, roughly 805 million people are estimated to suffer from malnutrition [1]. Furthermore, in developing countries low birth weight and associated diseases (such as coronary heart diseases) usually arise from a poor nutritional intake of the mother (before and during pregnancy and lactation) [2]. Malnutrition remains as a common world health issue and it contributes to impaired childhood growth and mortality [2].
It is known that breastfeeding has an extremely positive effect on the child and mother’s health. Exclusive breastfeeding is recommended on the first six months of the child. Mothers who do not breastfeed have an increase of ovarian cancer risk [3]. Factors such as low maternal age, low educational attainment and low socioeconomic position may influence on the nutritional status of the mother during pregnancy and lactation [4].
Studies have shown that the nutritional status of the mother during gestation and lactation is essential to normal growth and development in humans [5], and in animals [6-10]. Studies regarding the effects of protein-energy restriction during lactation period are scarce, although they showed that there are alterations in thyroid function [9,11,12] and on the skeletal system of Wistar rats [7,13].
Bone tissue is sensitive to protein malnutrition due to the fact that its non-mineral composition is essentially constituted by protein, thus, there is a relation between an adequate protein absorption and osseous metabolism [8]. Furthermore, it is known that pre-natal and neonatal malnourishment will cause disturbances during bone growth [7,8,13,14].
The present study aimed to investigate the effects caused by protein and energy restriction during lactation period on cortical dimensions of the femur in the adult offspring of Wistar rats.
Materials and Methods
The present study was approved by the Animal Care and Use Committee of the State University of Rio de Janeiro, and is in accordance with the American Physiological Society guidelines [15]. The study was conducted between January 2015 and January 2017. The present study was also performed in compliance with the general guidelines of the Brazilian College for Animal Experimentation (COBEA). Furthermore, the same protocols and design were used in previous studies by the same research group [7,8,13].
Animals
Six three-month-old female virgin Wistar rats were obtained from the Biomedical Center of the State University of Rio de Janeiro and were housed at 25±1°C and on a 12 h light/dark cycle (lights on from 07:00 a.m. to 07:00 p.m.) throughout the experiment. The rats were house with one male at a proportion of 2:1. After mating, each female was placed in an individual cage with free access to water and food until delivery. Afterwards the pregnant rats were divided into three different groups. Each female gave birth to six pups, totaling 12 per group. All pups showed good health condition. There was no statistical significant difference in body weight or linear growth.
Experimental Procedures and Diets
The pregnant Wistar rats were separated at delivery into three groups: 1) control group (C) – with free access to a standard laboratory diet (in grams per 100g) containing 23% protein, 68% carbohydrate, 5% lipid, 4% salts and 0.4% vitamins, and a total of 17,038.7 (kJ/kg) energy; 2) Protein-Energy-Restricted group (PER) – with free access to an isoenergetic, protein-restricted diet containing 8% protein, and; 3) Energy-Restricted group (ER) – fed with a standard laboratory diet in restricted quantities (calculated based on average ingestion of the PER group).
The protein-restricted diet had cornstarch instead of the full protein content of the C group diet [Table/Fig-1]. Vitamin and mineral mixtures [Table/Fig-2,3] were formulated to equal those found in the control diet and to meet the American Institute of Nutrition AIN- 93G recommendation for rodent diets [16]. The protein-energy restriction started at birth (immediately postpartum), which was defined as day 0 of lactation, and ended at weaning (d21= 21 days postpartum).
Composition of the normal and hypoproteic diets.
| Diet* |
|---|
| Nutrient | Normal | Hypoproteic |
|---|
| Kg/diet |
|---|
| Total energy – kcal | 4070.4 | 4070.4 |
| Protein % | 23.0 | 8.0 |
| Carbohydrates % | 66.0 | 81.0 |
| Lipids % | 11.0 | 11.0 |
| Protein g | 230.0 | 80.0 |
| Carbohydrates g | 676.0 | 826.0 |
| Lipids g | 50.0 | 50.0 |
| Vitamin mix g | 4.0 | 4.0 |
| Mineral mix g | 40.0 | 40.0 |
*According to recommendations from the American Institute of Nutrition Rodents Diets, AIN-93G [16]
| Vitamins* | g/kg of mix |
|---|
| Nicotinic acid | 3.000 |
| Ca Panthotenate | 1.600 |
| Pyridoxine (B6) | 0.700 |
| Thiamin (B1) | 0.600 |
| Riboflavin | 0.600 |
| Folic Acid | 0.200 |
| Biotin | 0.020 |
| Cyanocobalamin (B12) | 2.500 |
| Vitamin E (500 UI/g) | 15.00 |
| Vitamin A (500.000 UI/g) | 0.800 |
| Vitamin D (400.000 UI/g) | 0.250 |
| Vitamin K | 0.075 |
*According to recommendations from the American Institute of Nutrition Rodents Diets, AIN-93G [16].
| Minerals* | g/kg of mix |
|---|
| Calcium carbonate, 40.04% Ca | 357.00 |
| Potassium phosphate, 22.76% P; 28,73% K | 196.00 |
| Potassium citrate, 36.16% K | 70.78 |
| Sodium chloride, 39.34% Na; 60,66% Cl | 74.00 |
| Potassium sulfate, 44.87% K; 18,39% S | 46.60 |
| Magnesium oxide, 60.32% Mg | 24.00 |
| Ferric citrate, 16.5% Fé | 6.06 |
| Zinc carbonate, 52.14% Zn | 1.65 |
| Manganous carbonate, 47.79% Mn | 0.63 |
| Cupric carbonate, 57.47% Cu | 0.30 |
| Potassium iodate, 59.3% I | 0.01 |
| Sodium selenate, 41.79% Se | 0.010 |
| Ammonium paramolybdate, 54.34% Mo | 0.008 |
*According the recommendations from the American Institute of Nutrition Rodents Diets, AIN-93G [16].
To evaluate the nutritional state, the body weight of the pups was monitored during the 21 days throughout the experiment. After weaning (d22–d180), male pups of the same group were housed in packs of three animals per cage and given unlimited access to food and water until adult period (day 180). Then, the pups were anaesthetized with lethal thiopental anaesthesia (0.15 mL/100 g/body weight) and fixed with a 10% formalin solution (perfused through the left ventricle with buffered saline). The right femurs of the specimens were excised, dissected, weighted and analysed.
Then, the bones were fixed in a 10% formaldehyde solution for 24 hours. After that the bones were decalcified with Ethylenediaminetetraacetic acid. Histological processing was done as routinely to embed the samples in paraffin blocks. Then, 10 μm thick transversal sections were performed at the middle third of the femur diaphysis and stained with Haematoxylin/Eosin. Microscopic analysis was made through the Scion-image® software.
Morphometric Parameters
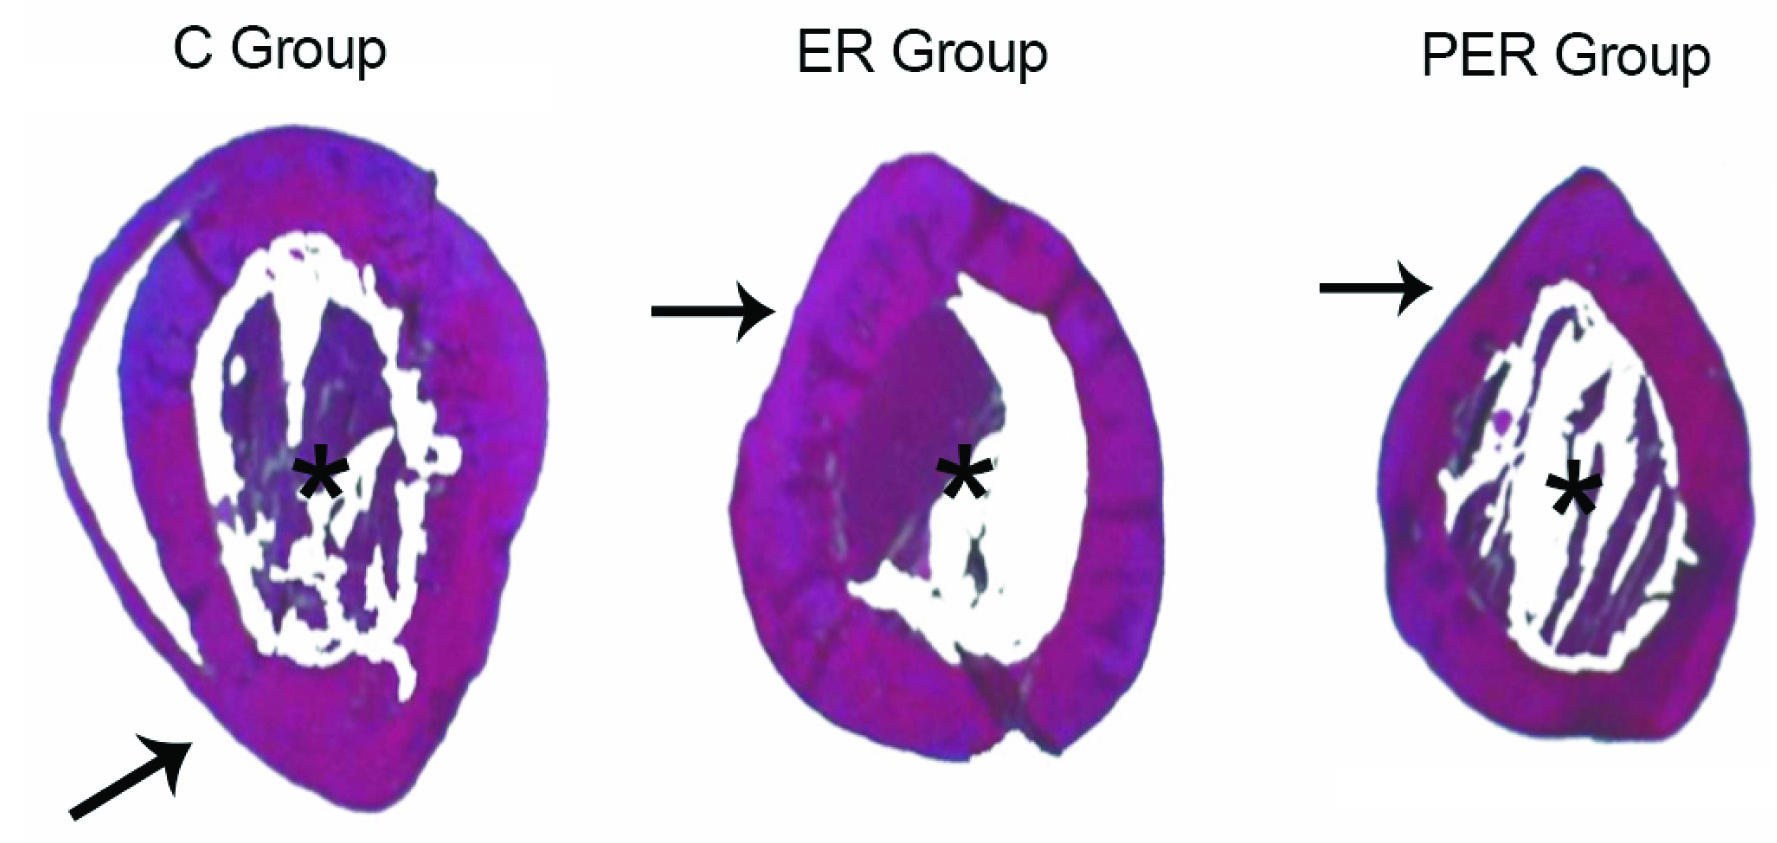
Measurements of the circumference of the femur’s external surface and the internal surface of the medullary cavity were taken with the results presented in micrometers (μm) [Table/Fig-4]. Afterwards, the software calculated the cortical bone mass through the previously measured structures.
*Haematoxylin and eosin stain of the measured parameters.
Black arrow = Medular area;*= Cortical area. The total area of the femur is the sum of both areas
Statistical Analysis
Data was reported as mean±Standard Deviation (SD). Statistical significance of experimental observations was determined by the ANOVA one-way analysis of variance, followed by Newman-Keuls test to compare the three experimental groups. The level of significance was set at p<0.05. All statistical analysis was done using GraphPad Prism six software (GraphPad Inc., CA, USA).
Results
ER and PER groups presented a significant reduction of cortical mass, weight and length when compared to the control group (p < 0.05 was considered significant). Histomorphometric results of the cortical area from the C, ER, and PER groups were, respectively: 6.54±0.23 μm; 5.51±0.29 μm and 6.18±0.19 μm, while the measures from the medullary cavity were: 3.65±0.16 μm; 4.1±0.20 μm and 3.53±0.12 μm, respectively [Table/Fig-5].
Histomorphometric results of 10 femurs (180 days) from the three groups. Values are presented as mean±SD.
| Parameter | C | ER | PER |
|---|
| TA (μm) | 10.19± | 9.61± (**) | 9.71± (*) |
| CA (μm) | 6.54±0.23 | 5.51±0.29 (**) | 6.18±0.19 (*) |
| MA (μm) | 3.65±0.16 | 4.1±0.20 (**) | 3.53±0.12 (*) |
* = C vs ER (p≤0.01) **= C vs PER (p≤0.01) ns= no statistical sigfinicance
*Legend: TA= Total area body weight; CA= cortical area; MA= medullary area.
Discussion
Bones and joints are subject to an ample variety of forces that gives origin to tensions, compressions, shears, torsions and angulations. Those forces result in internal and compressive loads in bone tissue [17].
Bone strength is determined by architectural variables like geometry, porosity, cortical thickness and trabecular structure. Furthermore, it is also determined by the intrinsic properties of the bone tissue [17,18]. The bones are vital tissues and are susceptible to a great number of congenital defects, malnourishment, hormonal and metabolic imbalances, inflammatory and degenerative diseases, as well as pathological or traumatic fractures [17,19].
Bony tissue is critically affected by protein-energy malnutrition [7,13,20-24]. Malnutrition brings biochemical and morphological alterations that leads to an insufficient growth [25]. A study reported that restricted growth during foetal period and insufficient development during childhood are associated with bone mass reduction and higher fracture risks. Moreover, bone consolidation, wound healing, infection recoveries and muscle mass gain are also in risk [23].
Many studies have examined the effects of nutritional deficiencies on bone growth of offsprings in different periods, such as gestation [26], lactation [7,8,13,27,28], and during the post-weaning phase [29]. The growth delay varies in accordance to the gravity and duration of the nutritional deficiency, which may be associated with body size and composition abnormalities in adult age, as well as the bone length and mineral content [21,29-31].
Different forms of disrupted growth have been reported in the literature, and it seems that each form is dependent of the type, duration and intensity of the malnutrition, with special regards to the period that it was performed. Furthermore, femur growth in rats can be influenced by sex, animal species and nutritional state [25-30].
In the present study, the femur was significantly affected by malnutrition during lactation period, and the morphological effects remained until adult life of the animals, even after receiving unlimited amounts of a diet with protein and energy after weaning. An under development of the femur was observed in adult aged offspring (180 days) whose mothers belonged to the ER and PER group during lactation. These morphological alterations were accompanied by significant differences regarding body weight gain of its pups during lactation (21 days).
Body weight alterations can be partly explained by a reduction of ingestion from the PER group dams, as observed in our experimental model. It is thus possible that PER diet may induce behavioural changes, such as humor of the breastfeeding mother. Moreover, it was observed that the dams from both restriction groups ingested smaller amounts of food, and this pattern was repeated throughout the experiment. We believe that this biological phenomenon could lead to a diminished ingestion of magnesium and other minerals essential to the behavior [32,33].
Body weight reduction of the ER and PER groups as well as their osseous mass during adult life may be related to quantitative and qualitative changes of milk composition, as a study showed a reduction of milk components (protein, lipids) available to its offspring [9].
Microscopic analysis showed reduced growth of femoral dimensions on the ER and PER groups. In a previous study [13], we observed that the femur was proportionally underdeveloped and displayed alterations of the anatomical and mechanical axis, as well as the angle between them. Furthermore, the study also presented significant alterations of the head and anatomical neck diameters, together with alterations of the cervico-diaphyseal angle in rats from ER and PER groups, in comparison to the control group.
Geometrical alterations of the femur’s diameter and cortical thickness (as presented in this study) may affect the regular bipedal stance, thus, its torsion and heavier loads resistances are reduced [17,34,35]. There is also a reduction of energy absorption capacity, which leads to fractures [17,36] and a deficit in bone consolidation [17,37,38].
Malnourished rats develop an imbalance, in which bone resorption is increased and bone absorption is decreased. This fact led us to believe that our experiment simulated osteoporosis type II, which could not be reversed with nutritional reposition. The observed alterations may increase the risk of pathological fractures [23].
The first week of life is a critical period regarding the nutritional state, and malnutrition during this interval can cause metabolic incapacity of bone recover up to 100 days in rats [20], and until six months of life in humans [39], or yet, it can influence the metabolism through the rest of the life [5,16,25].
According to the results of this study, catch-up growth is not possible after puberty in malnourished rats dams, in accordance with other studies [13,20,24]. Although, there are other studies that had opposite results [21,22,29]. There was no catch-up growth in rats even after free access to a protein-energy diet even after adult age (180 days). Thus, the importance of a protein-energy adequate diet to the breastfeeding mother during gestational and lactation period is highlighted.
The small number of studied animals, the lack of more detailed morphometric parameters and a less refined measurement instrument limited the study from the methodological point of view.
Conclusion
A poor ingestion of proteins and calories during lactations provokes irreversible morphological changes on the cortical area of the femur in rat’s offspring, which resulted in an incomplete growth during adult life even after regular protein diet ingestion. Diet regulation did not reversed the effects caused in bone mass by maternal malnutrition, thus, proving the “metabolical imprinting theory”.
Further studies are needed in order to quantify the alterations and enlighten the mechanisms through which they occur in association with the morphology of these structures. Moreover, more studies should focus on chronic effects of maternal malnutrition in their offspring, so that one may study more effective methods to deal with potential complications that affect patients.
* = C vs ER (p≤0.01) **= C vs PER (p≤0.01) ns= no statistical sigfinicance
*Legend: TA= Total area body weight; CA= cortical area; MA= medullary area.