The adolescent population in India (243 million) is highest in the world followed closely by China (207 million) [1]. During the lifecycle of an individual, especially from childhood to adolescent, he/she underwent physical as well as mental changes that also dictate his/her lifestyle and physical activity into adulthood [2,3]. Promoting a healthy lifestyle during adolescence can have long-lasting benefits. Instead of playing indoor games, youth of the past were involved in outdoor games which led to development of both physical health and improved school performance [4].
Metabolic syndrome is one of the fastest growing non-communicable diseases crippling India. It is commonly associated with other conditions like hypertension, diabetes, abnormalities in lipid metabolism, resistance to insulin and obesity [5]. The sedentary life style makes the population more prone to hypertension, diabetes, asthma, hyperlipidaemia, depression and adverse orthopaedic conditions [6]. Few decades back, obesity and physical inactivity in India was limited to adult population only but now it has extended to younger age groups as well [7]. A study from Ahmedabad showed high prevalence of overweight (14.3% in boys, 9.2% in girls) but comparatively low prevalence of obesity (2.9% in boys, 1.5% in girls) [8].
The prevalence of overweight was estimated to be 12.64% (95% CI 8.48-16.80%) and that of obesity to be 3.39% (95% CI 2.58-4.21%) in a recently carried out meta-analysis in India [9]. The western populations show a decline in PA levels during adolescent years [10]. There were few attempts to measure physical activity in adolescents in South India, Bengal, North India and Gujarat albeit with varied tools [11-15]. The PA levels in adolescents of Gujarat have not been adequately studied. Identifying patterns of PA behaviour in adolescent population will help to improve interventions for youth to become and stay active into adulthood. The study was conducted to assess the current status of PA in adolescents in the Anand district of Gujarat.
Materials and Methods
We conducted this cross-sectional survey among students of 10-19 years of age (class 7-12) attending nine English medium schools representing all socioeconomic classes in the Anand district of Gujarat. All students in these classes were eligible except those with physical handicap. The data collection was done from November 2013 to March 2014. The selection of schools was based on purposive sampling to include all socioeconomic strata of students. We used a questionnaire viz. Physical Activity Questionnaire for Adolescents (PAQ-A) developed by Kowalski KC et al., with consistently high validity and moderate reliability [16,17]. It was a self-reported questionnaire using total of 10 items and takes approximately 20 minutes to complete. In the first question, it requests responses for the last seven days by asking participants to check a list of activities for frequency of participation on a scale from ‘never’, one to two times per week, three to four per week, five to six per week, to seven times or more per week. This questionnaire had originally 23 different physical activities in first question. As many of them were not relevant in Indian settings, the questionnaire was modified and finally 13 relevant activities were kept in final questionnaire. In subsequent items, i.e., in second to ninth, questions are also asked about PA performed in Physical Education (PE) lessons, recess, at lunch time, right after school and evenings, as well as ‘the last weekend’ along with daily PA in free time. A measure of frequency of participation was requested for each day, ranging from ‘none’ to ‘very often’. Composite score of nine items (out of 10) was taken and PA of each participant was rated by taking mean of those nine items’ score which would range from one to five. A score of one indicates low PA, and a score of five indicates high PA. Thus, with the scores we could classify participants as active or sedentary. Active individuals were those who had a score of ≥3 while sedentary are those with the scores <3 [18]. We pre-tested the questionnaire in a pilot sample of 25 students who were not included in the study. Based on their responses, we modified the questionnaire as described above. The activities in question one were modified based on the responses of the participants. The rest of the questionnaire was not changed.
Question/item 10 enquires whether students participated in any PA during the previous week or not. If the answer is “no” then it further enquires as why the student did not participate in any PA. This question was not used to score the PA level but used to present reasons for not participating in PA.
Anthropometric measurements, weight (kg) and height (cm) were self-reported by the participant in the given questionnaire. The schools have regular school health camps and students were aware of their weight and heights.
The age was calculated from the date of birth and the date of filling up the questionnaire. The BMI was calculated using the formula: BMI (kg/m2) = weight / height2. Affluent class was empirically determined by annual school fees cut-off 25000 INR for the study purpose. The demographic variables were captured as an addendum to the modified PAQ-A questionnaire.
Statistical Analysis
The analyses were performed using STATA (14.2). Descriptive statistics {mean (SD), Frequency (%)} were used to depict the characteristics of the study population and PA levels. Using age and sex-specific WHO growth charts for BMI, we determined the prevalence of overweight (z≥+2 SD), obesity (z≥+3 SD) and undernutrition (z≤-2 SD) in our study population.
Age and BMI were correlated with PA score using Pearson’s correlation coefficient. Differences in PA level (males vs females, affluent vs non-affluent classes and weekday vs weekends) were analysed using t-test. Students involvement in PE classes conducted in schools and its influence on their overall pattern was also analysed using t-tests for their overall PA scores and score in question four.
Human research ethics committee of HM Patel centre for medical care and education approved the study.
Results
Participants Characteristics
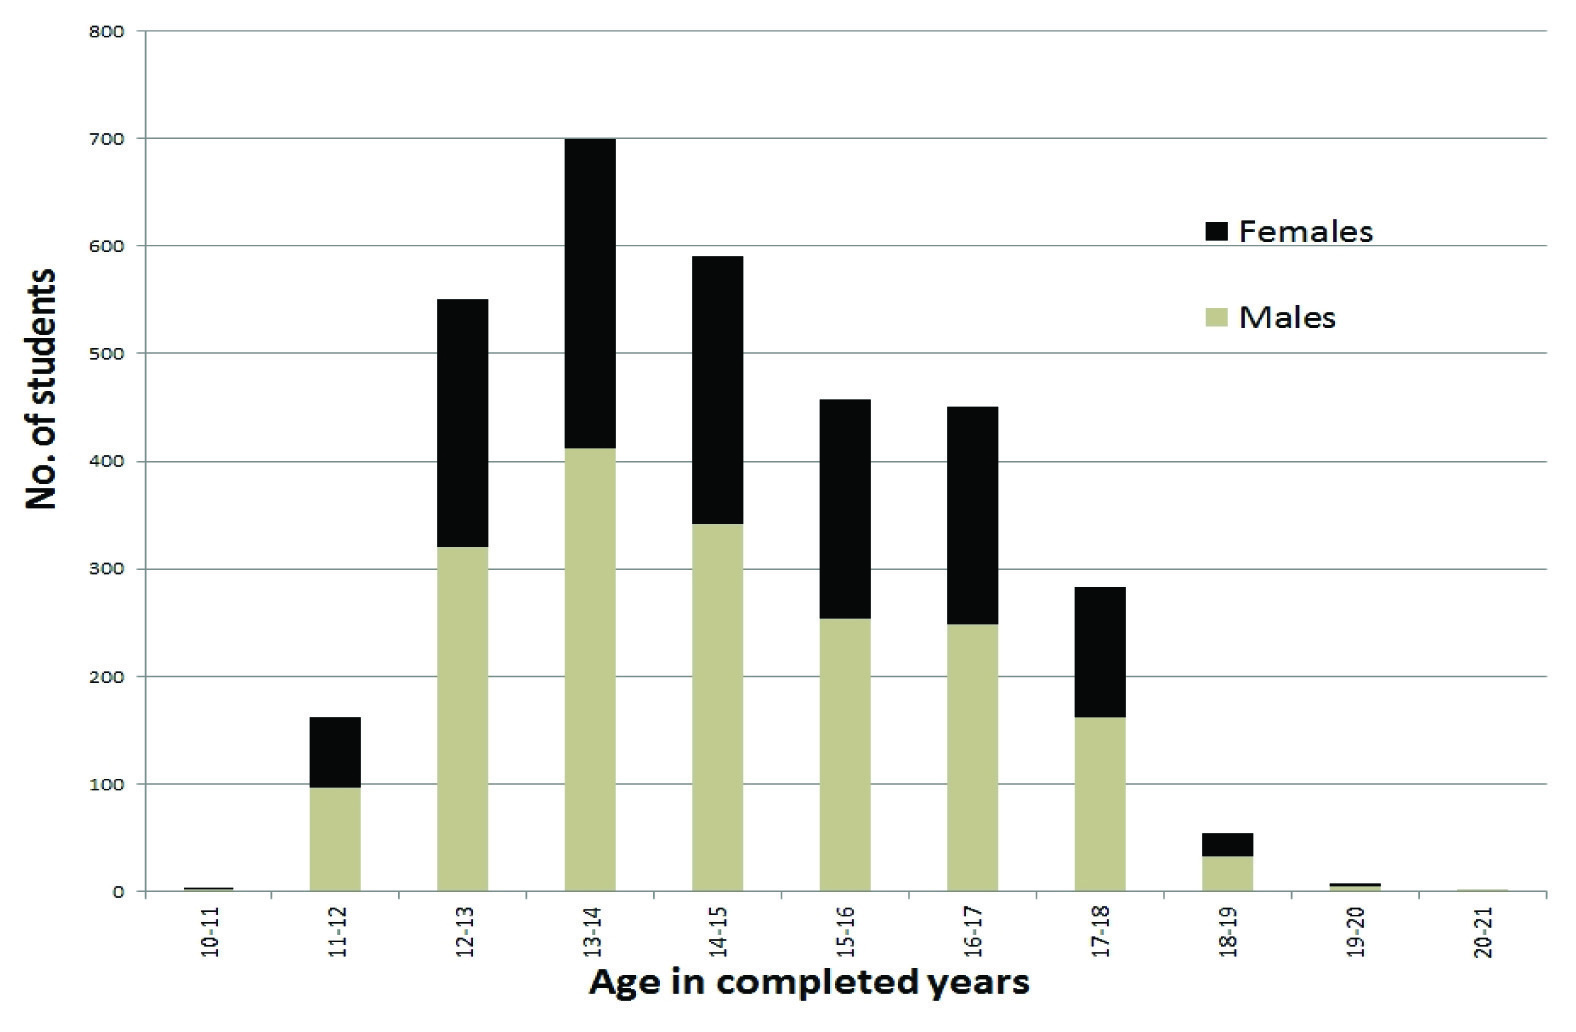
All the 3337 students who were approached participated in the study, out of which 1410 (42.25%) were females and 1927 (57.75%) were males. Mean (SD) age was 14.57 (2.50) years.
The age and gender distribution of study population is depicted in [Table/Fig-1].
Age-Gender distribution of study participants.
Note: The upper class limits are open limits meaning they are included in the next class. (for example age 12 is included in the class 12-13).
Anthropometric data was not reported by 709 students. They were included to calculate age, gender and school-wise mean PA scores. Overall (n=2628), 143 (5.4%) were obese {103 (6.7%) males and 40 (3.7%) females} and 556 (21.2%) were overweight {369 (24.0%) males and 187 (17.1%) females}. Affluent and non-affluent schools had similar overweight and obesity levels. But undernutrition (Z score<-2) was significantly high among non-affluent schools than affluent {287 (16.3%) vs 87 (10%), p<0.001}. Overweight and obesity levels were higher among males.
Physical Activity Levels
Mean (SD) PA score was 2.62 (0.72) and 2312 (69.3%) of students who fell in low PA group.
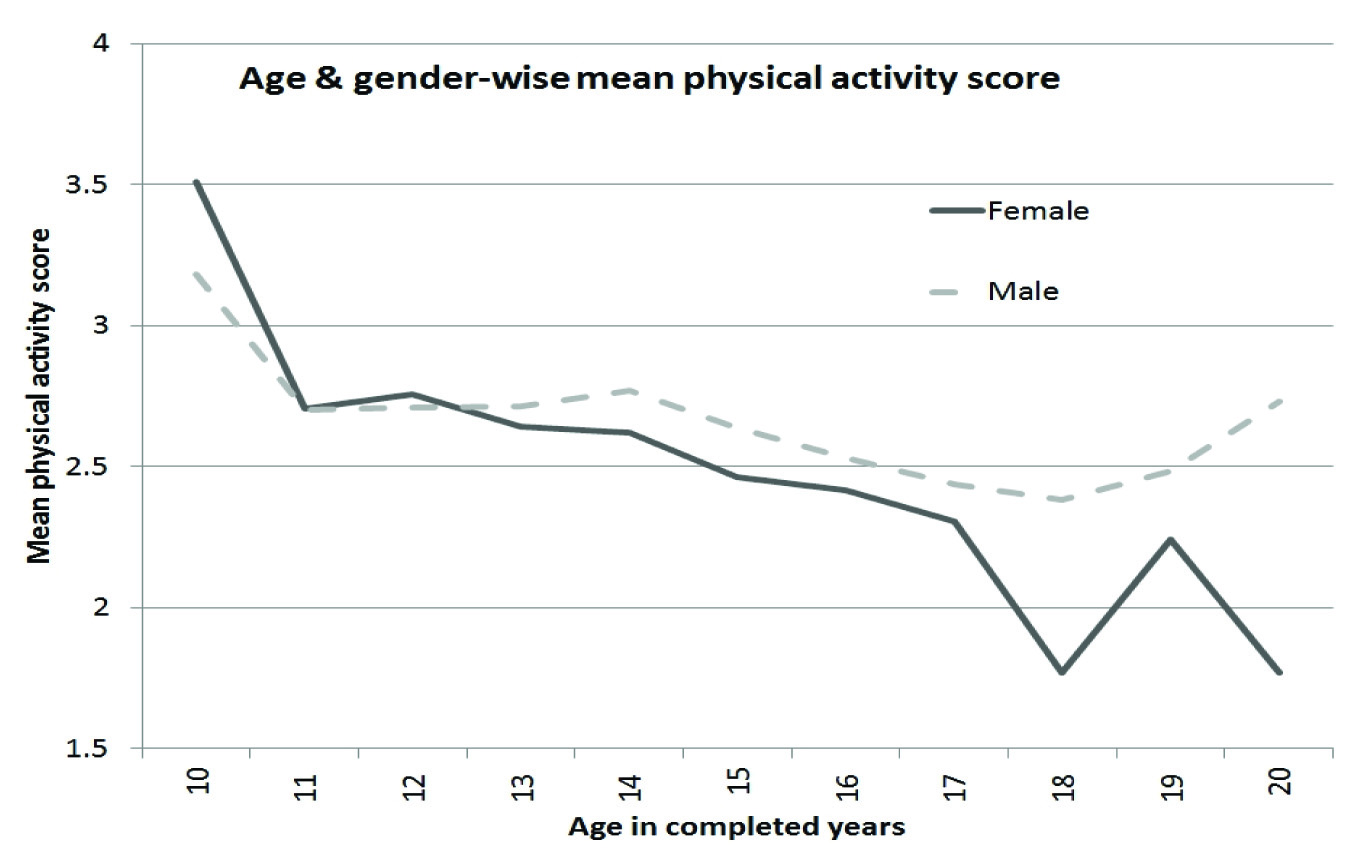
PA score in girls (2.56, SD=0.71) was significantly lower than in males (2.66, SD=0.73). (p<0.001) [Table/Fig-2].
Age-gender wise mean physical activity score.
Correlation of Physical Activity Levels
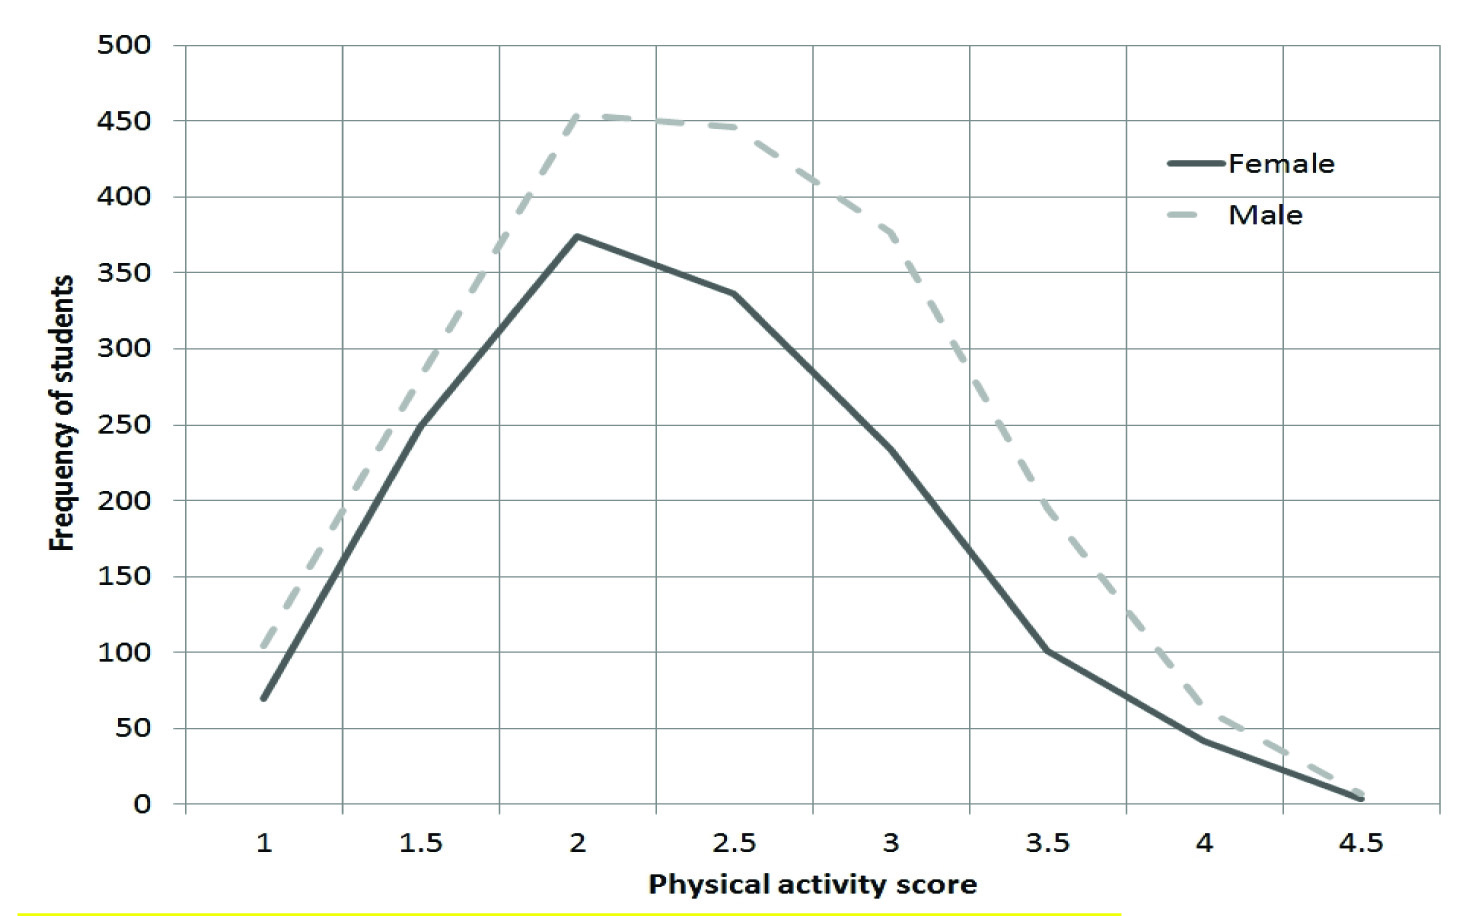
Age and Gender-wise distribution of PA level of the studied population is shown in [Table/Fig-3]. It was noted in the graph that PA declined with increasing age with correlation coefficient of -0.125.
Physical activity levels across gender.
There was no significant correlation found between PA and z scores of BMI. (0.09 in males, 0.07 in females). However, in an affluent school (A), low PA level was moderately correlated with higher BMI levels (r=0.314).
Overall, the most common PA among both the sex {729 (51.7%) in females and 1077 (55.9%) in males)} is bicycling. PA level of students in PE classes influences their overall PA level and it showed a Pearson correlation coefficient of 0.60 (all students) while being higher for males (0.610) as compared to females (0.588). PA level for weekends (saturday, sunday) 3.23 (SD 1.26) was significantly higher than weekdays (monday-friday): 2.66 (SD 1.01) (p<0.001).
PA score of affluent schools (2.52, SD 0.70) was significantly less than that of non-affluent schools (2.66, SD 0.73) with p-value < 0.001 (independent sample t-test) [Table/Fig-4].
School wise distribution of students and mean PA score.
| School Type | School Name | No. of students | Mean (SD) | p-value |
|---|
| Affluent schools(Annual fees > 25,000 INR) | A | 328 | 2.67 (0.73) | |
| B | 340 | 2.64 (0.59) |
| C | 231 | 1.93 (0.52) |
| D | 215 | 2.74 (0.62) |
| Affluent schools (Overall) | | 1114 | 2.52 (0.70) | <0.001 |
| Non-affluent schools (Overall) | | 2223 | 2.66 (0.73) |
| Non-affluent schools | E | 391 | 2.69 (0.73) | |
| F | 894 | 2.68 (0.75) |
| G | 598 | 2.59 (0.74) |
| H | 179 | 2.65 (0.65) |
| I | 161 | 2.83 (0.65) |
Out of 3337, 237 students answered question 10 that they did not participate in any PA during the previous week with 226 students citing reasons as shown in [Table/Fig-5]. Apart from acute illness, academic stress (15 females, 18 males) represented major reason.
Reasons for avoiding physical activity.
| Reasons | No. of students (%) |
|---|
| Acute illness | 149 (65.9) |
| Academic stress | 33 (14.6) |
| Minor accidents | 15 (6.6) |
| Social reasons | 12 (5.3) |
| Chronic illness (asthma) | 9 (4) |
| Others | 8 (3.5) |
Discussion
PA level of adolescents in current study was low. Mean PA score is 2.62 (SD=0.72) and 2312 (69.3%) adolescents fall in low PA group. This finding is consistent with other similar international and national studies described subsequently. Other studies using different methodology describe similar findings of decline in PA level in adolescents [18,19]. In the Czech Republic, the authors describe a longitudinal study where there was a decrease in PA over time. Using pedometers they found that PA reduced from 68% to 55% in boys while in girls it remained steady over time but with only about 75% of them achieving required PA [18]. In an Australian setting, only about 15% students were engaging in adequate PA across 238 secondary schools in the age group of 12-17 years (Morley B et al.,) [19]. In India, though studies available regarding PA level are less, they also support our finding [11-14]. In the Chennai study using the International Physical Activity Questionnaire, there were almost about 59% students who were minimally or not active [11]. In Aligarh, decreased physical activity was seen to be associated with obesity [12]. In West Bengal, more physical activity was associated with younger age as seen by us [13]. In Bangalore, there was more physical activity in younger children and there was no association with socioeconomic status [14]. A study from Nigeria revealed that boys have higher PA levels than girls and also indicated that the younger children (12-14 years) have higher PA than older ones (15- 18 years) [20].
Females are particularly prone for low PA. Lytle LA et al., and several other studies have described similar findings of less active adolescent females [21]. The factors responsible for that could be school environment, availability and accessibility of playgrounds to girls, preference of girls to indoor games, social responsibility as a home maker during teenage years in developing countries, social stigma of female sports activities in Indian villages, self-perception of girls of feeling less compatible to PA as compared to males. An assessment of school environments to promote PA was done in Delhi revealed that most schools did not have supporting environment despite playground equipment, etc., [22]. Similar assessments need to be performed across various regions to guide improvements in PA. Achievement of puberty at earlier age also makes females physically less active due to social inhibition in Indian culture [23].
Decline in PA seen with increasing age, as shown in our study (Correlation -0.125) is consistent with other studies [10,14,18]. Our participants were adolescents and it is likely that they were introduced to other avenues which take their time away from physical activity. Forming peer groups and more freedom to engage in non-PA activity may be the reason. Also, academic pressures do increase during this time.
Physical inactivity is associated with obesity and insulin resistance which contribute to the metabolic syndrome [24]. Although, low PA level was not associated with obesity or overweight in our study, the role of low PA can be a significant risk for future development of obesity and/or non-communicable diseases in adulthood. Moreover, obese population do possess risk of having obese children and risk of hypertension in adolescence itself. Our finding of higher WHO z scores for BMI in an affluent school (A) and its significant correlation of 0.314 to physical inactivity indicate this fact. Goyal JP et al., conducted obesity related study in a two affluent schools of Gujarat, India and is in agreement with our results [15]. They reported high levels of obesity in almost 21% adolescents not exercising and only 41.9% playing some games. They also reported high incidence of eating junk food and watching Television amongst the participants. Although, affluent students may have better access to playground facilities, gymnasiums, swimming pools etc., it does not translate to a better PA level as compared to non-affluent population; because familial attitudes and their awareness about importance of PA may influence their children’s PA practices [25] and Peer pressures also do play a significant role [26]. The poor correlation between low PA and high BMI suggests that in adolescence age, PA level does not influence obesity level, although it makes differences in the older population.
We questioned the participants whether if any problems exist which makes them physically less active. A significant proportion of the reasons described for less PA was due to academic stress (14.6%). Students of one school (C) were appearing for board examination and as a result they reported significantly less PA level overall i.e., 1.93 (SD=0.52) compared to students in other schools [Table/Fig-4].
Significantly lower level of PA over weekdays versus weekends in this population may indicate that the burden of school, tuition, homework, exam preparations etc. may limit the time available for PA during weekdays. School polices to preserve their time for physical activities must be in place to prevent declines in PA levels in youth [27]. Whether PE class can help in improving PA needs to be explored. It might occur if conducted by the teachers who have an understanding of the importance of PA. PE should be modified such that each student spends minimum 50% of the time in moderate to vigorous PA [28]. Specific sports trainings and celebration of sports day can serve a major role to enhance future PA level in students [29]. Children may be allowed to play in the break time which can also positively influence their PA level [30].
Consensus statement has been developed regarding PA guidelines for Asian Indians by Mishra A et al., [31]. The solution to the problem may lie in bundled approach such as school based interventions with home and community component. School based interventions may include written PA policies, monitored participation in PA programs, training of teachers on role of PA in health, and organization of extracurricular PA activities [32]. A recent detailed review identified five broad intervention guidelines. However, most of the literature review was done in developed countries and none were conducted in India [33]. A good intervention study model has been proposed and is being researched using social cognitive and social-ecological theories and will be implemented using the World Health Organisation’s (WHO) Health Promoting Schools framework [34]. Similar studies need to be modelled in India to bring about change.
Limitation
The current study gives an important information about PA levels. However, there are inherent limitations, which can be overcome the in future studies. A major limitation of this study is self-reported anthropometric reports. The participants tend to over-report their height and may under-report weight so detection of any association of these parameters would be difficult. Another limitation is that, since it is a cross-sectional study we are unable to track students over a period of time.
Conclusion
PA depends upon the socio-cultural milieu and interventional studies that need to be pursued to address this problem in the Indian context. Creating awareness in the society regarding importance of PA, development of appropriate national policies, political commitment to improve PA level in youth, development of required infrastructure, improvement of physical education in schools, encouraging girl child to participate in sports, need to be explored in future studies so that we would have a positive impact on the health of future generations.
Note: The copy of the modified questionnaire can be requested from the author and/or the editorial.