Liver is a vital organ with a wide range of functions including detoxification, protein synthesis and production of enzymes necessary for digestion. It is also prone to many diseases such as viral hepatitis, alcohol damage, non fatty liver disease, cirrhosis, cancer, drug damage [1].
Fatty liver or steatosis is caused due to the abnormal accumulation of lipids, particularly triglycerides within the hepatocytes. This steatosis can lead to fibrosis and cirrhosis [2].
Activation of Hepatic Stellate Cells (HSC) is one of the key events in the development of liver fibrosis [3]. All types of chronic liver diseases lead to cirrhosis, which is the end stage of liver fibrosis characterized by architectural disruption, aberrant hepatocyte regeneration, nodule formation and vascular changes [4].
Various invasive and non invasive techniques have evolved over years for the assesement of liver fibrosis. Traditionally, Liver Biopsy (LB) has been the gold standard for liver fibrosis staging. However, it may not be an effective method to screen suspicious cases or to monitor the treatment progression. This invasive procedure has its own potential complications and the possibility of a repeat examination is therefore limited. In addition, LF affects the liver non-homogeneously, and thus, biopsy specimens may not represent the histology of the whole hepatic parenchyma leading to inter observer variation in histological assessment [5,6].
Several blood tests using serum markers are also used for predicting and diagnosing hepatic fibrosis {e.g., APRI score (AST/platelets ratio index) and the Aspartate Transaminase/Alanine Transaminase (AST/ALT) ratio, hyaluronic acid, platelet count, prothrombin index}. However, they are ineffective independently and are not helpful for predicting earlier stages of hepatic fibrosis [7].
B-mode ultrasound imaging can be a screening tool for liver fibrosis due to ease of availability. Under the ultrasound image, fibrosis and cirrhosis is recognised by a coarse echo pattern and presence of regeneration nodules causing irregular outline on the liver surface. It however, suffers from low sensitivity and specificity. Since B-mode ultrasound imaging is able to provide a 2D grey scale images only, it also requires the operators or physicians to be well trained and experienced in scanning and interpreting images. This operator-dependent technique limits its repeatability and accuracy. The image quality, furthermore, depends on the frequency of ultrasound transducer [8,9].
Few non-invasive methods for measuring Liver Stiffness (LS), including Transient Elastography (TE) and PSWE have been developed recently. TE gives a quantitative one dimensional (i.e., a line) image of tissue stiffness. It is able to measure the liver stiffness non invasively. In addition, the stiffness obtained had significant correlation with fibrosis grading according to the METAVIR scoring system in LF. Nevertheless, it has its limitations. The most important restrain is that it does not have sufficient visual guidance to properly locate the Region Of Interest (ROI). Without the help of B-mode ultrasound to locate the ROI, it is easy to include blood vessels and bile duct, especially those large in size, leading to inaccurate estimation of the fibrosis stage. TE is not applicable to the patients having ascites [10,11].
PSWE is a reproducible and reliable method for assessing liver stiffness, and is comparable with the TE (current standard to evaluate liver fibrosis non-invasively). PSWE measures tissue elasticity simultaneously during B-mode ultrasound examination and elasticity values can be measured on the basis of anatomical information. It can be used even in patients with ascites. As a result, PSWE provides more accurate information about LF staging than TE. However, narrow intercoastal space and inability to hold one’s breath limits the application of this technique [12].
Successfully detecting and managing LF at an early phase can significantly improve the prognosis of patients in clinical practice; therefore, accurately assessing the degree of fibrosis when the disease is at an early stage is extremely important. PSWE is a novel technique which helps in an early detection and monitoring progression of liver fibrosis, non invasively and quickly with good inter and intra operator correlation. It has wider patient selection and can be repeated in patients multiple times without any complications. The normal range of LS on PSWE is not well established in healthy subjects [13].
Keeping this thing in mind, the present study was undertaken with an aim to quantitatively evaluate and establish normal reference range for sonoelastographic values of liver stiffness in healthy subjects. In addition, the authors also assessed the effect of age, gender, fatty liver and Body Mass Index (BMI) on liver stiffness.
Materials and Methods
A hospital based observational prospective cross-sectional study was conducted in the Department of Radiodiagnosis in a tertiary care hospital in Uttarakhand region. The study was conducted between November 2014 and January 2017. The study was conducted after the approval from the Institutional Ethical Committee and informed written consent was obtained from all participants after explaining them the complete procedure in their native language.
Subjects referred to our department for indications other than liver disease and apparently healthy volunteers who came for screening and without any known hepatic pathology formed a part of the study. Subjects with frank cirrhosis, liver disease/viral hepatitis, enlarged spleen, focal liver disease and uncooperative patients were excluded.
A total of 207 subjects were evaluated, including subjects with a normal liver and subjects with incidentally detected fatty liver. Elastography was performed on Philips iU22 and Affiniti 70 ultrasound machines (Philips Healthcare, Best, The Netherlands) equipped with ElastPQ feature both using C5-1 probe. BMI was derived using predefined criteria. The test was performed with the patient in left lateral decubitus position with right arm in maximum abducted position. The tip of probe was placed on skin smoothly between the rib bones at the level of right lobe of liver without compressing the tissue.
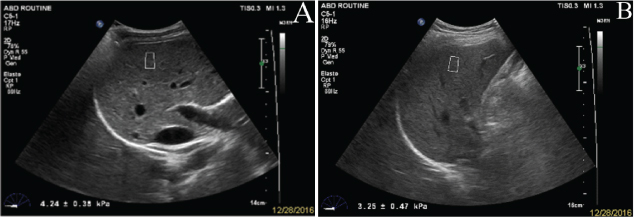
The subjects were required to hold their breath for 3-5 seconds during the elastographic examination. During the measurement, intra-hepatic vessels, boundary with other organs and the gallbladder were avoided. The quantitative sampling frame was initiated to measure the elastic modulus of the liver in the ROI. The examinations were performed in the right lobe of the liver through right inter-costal spaces. Using a real-time B-mode image, a vessel-free area was selected, at least 1.5 cm below Glisson’s capsule and <7 cm away from the surface, where a fixed ROI of 1.5×0.5 cm was placed by moving a trackball [Table/Fig-1]. The shear wave velocity was displayed in meters per second (m/s) or in kPa through Young’s modulus. The evaluations were repeated ten times and the mean values of the elastic modulus was recorded for the statistical analysis. Measurements were classified as failed when little or no signal was obtained in the quantification box for all the acquisitions.
a) Liver stiffness evaluation by sonoelastography in normal; b) fatty liver.
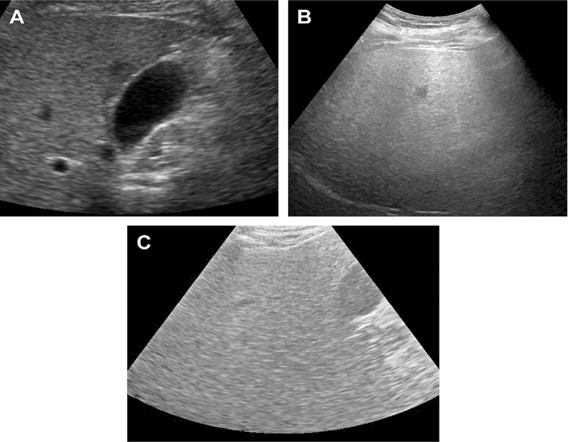
Fatty liver was graded sonographically on visual analysis of intensity of echogenecities [Table/Fig-2]. Grade I-when echogenecity was mildly increased, Grade II-when the echogenic liver obscured the echogenic walls of portal vein branches, Grade III-when echogenic liver obscured the diaphragmatic outline [9,14].
Different grades of fatty liver on B-mode USG: a) grade I fatty liver; b) grade II fatty liver; c) grade III fatty liver.
BMI was classified according to predefined criterias as follows: less than 18.5 kg/m2- underweight; 18.5–23 kg/m2 - normal; 23–27.5 kg/m2 - pre-obese; and 27.5 kg/m2 or higher - overweight [15].
Statistical Analysis
Data were expressed as percentage, Mean±SD and percentile. Kolmogorove-Smirnove analysis was performed for checking linearity of the data. The normality of the mean liver elasticity in the reference population was tested by using the Shapiro-Wilk test and the Q-Q plot. The lower and upper limits of the reference range were estimated at the 2.5 and 97.5 percentiles, respectively, of the distribution of the mean liver elasticity values in the reference population, encompassing the middle 95% of subjects in the reference population. Results were evaluated using SPSS© for windows™ Vs 23 (IBM™ Corp NY) and Microsoft excel™ 2007 (Microsoft® Inc USA). Student’s t-test was used to check the significance of difference between two parameters. ANOVA followed by Tukey’s HSD test was used to test the significance of difference between more than two parameters in parametric data.
Results
In our study, we evaluated 207 apparently healthy subjects {148 non-fatty liver (111 Males, 37 Females) and 59 fatty liver (30 Males, 29 Females)} using Elast PQ technique for liver stiffness.
Reference range of liver stiffness evaluated in total study population (n= 207) was 4.48±0.78 kPa. Study population was divided into different age groups 0-20, 21-30, 31-40, 41-50, 50-60 and > 60 years with liver stiffness values 4.46±0.85, 4.62±0.68, 4.47±0.87, 4.33±0.70, 4.48±0.63, 4.47±0.92 and 4.48±0.78 kPa. No statistically significant difference in liver stiffness was noted in different age groups [Table/Fig-3].
Comparison of liver elasticity (stiffness) among various age groups in study subjects.
| Age groups | n | Mean | (±)SD | p-value |
|---|
| ≤ 20 | 33 | 4.46 | 0.85 | 0.8 |
| 21-30 | 48 | 4.62 | 0.68 |
| 31-40 | 38 | 4.47 | 0.87 |
| 41-50 | 32 | 4.33 | 0.70 |
| 51-60 | 26 | 4.48 | 0.63 |
| >60 | 30 | 4.47 | 0.92 |
| Total | 207 | 4.48 | 0.78 |
Of the 207 subjects, 66 were female with male to female ratio of nearly 2:1. Liver stiffness in males was 4.56±0.76 kPa and in females was 4.32±0.80 kPa. Males have statistically significant higher liver elasticity as compared to females (p-value=0.04) [Table/Fig-4].
Comparison of liver elasticity (stiffness) in males and females.
| Gender | N | Mean | (±)SD | Std. Error Mean | t | p-value |
|---|
| Liver elasticity (kPa) | Female | 66 | 4.32 | 0.80 | 0.09 | -2.1 | 0.04 |
| Male | 141 | 4.56 | 0.75 | 0.06 |
Comparison was also made between fatty liver and non-fatty liver. Of the 207 subjects, 59 subjects had fatty liver. Reference range of liver stiffness for fatty liver was 4.59±0.84 kPa and for healthy liver was 4.47±0.75 show no statistical significant difference (p-value=0.79) [Table/Fig-5].
Comparison of liver elasticity (stiffness) in subjects with fatty liver and those without fatty liver.
| Fatty liver | N | Mean | (±)SD | Std. Error Mean | t | p-value |
|---|
| Liver elasticity (kPa) | Absent | 148 | 4.47 | 0.75 | 0.06 | -0.25 | 0.79 |
| Present | 59 | 4.59 | 0.84 | 0.10 |
Liver stiffness was also calculated in the study population in different BMI categories. Liver stiffness was 4.84±0.80 kPa, 4.44±0.65 kPa, 4.32±0.86 kPa and 4.51±0.72 kPa in underweight, normal, preobese and overweight [Table/Fig-6].
Comparison of liver elasticity (stiffness) in various BMI categories in study subjects.
| Variables | BMI | N | Mean | (±)SD | Min. | Max. | p-value |
|---|
| Underweight | < 18.5 | 35 | 4.84 | 0.80 | 3.25 | 6.77 | p > 0.05 |
| Normal | 18.5 – 22.9 | 78 | 4.44 | 0.65 | 3.14 | 6.33 |
| Preobese | 23 - 27.5 | 69 | 4.32 | 0.86 | 2.75 | 6.36 |
| Overweight | > 27.5 | 25 | 4.51 | 0.72 | 2.94 | 6.20 |
Discussion
In our study, we assessed the range of point shear wave elastography (ElastPQ) values of liver stiffness in 207 healthy subjects with no known hepatic pathology in the Uttarakhand region. A normal reference range for ElastPQ of the liver in this population may be helpful for improved diagnosis of hepatic fibrosis in this particular region. In addition, we also assessed the effect of fatty liver and BMI on liver stiffness.
Elastographic Values of Liver Stiffness In Healthy Subjects
We determined the reference range for various age groups in our study subjects. Overall, the mean of liver elasticity for the population under study was found to be 4.48±0.78 kPa (2.96-6.01 kPa). The upper limit of the range, 6.01 kPa, could be used as the cut-off for the diagnosis of mild fibrosis.
In a study done in Indian population by Varshney S et al., the mean of liver elasticity by ElastPQ in a small group of healthy volunteers (n = 20) was 3.1 kPa (2.1-5.5 kPa) [16]. In a study by Ling W et al., in a population of 175 subjects (50 Males, 125 Females) liver stiffness by ElastPQ was found to be 3.6±0.5 kPa (range, 2.4-6.2 kPa) [17].
Liver stiffness was lower in the study by Varshney S et al., in the Indian population as compared to our study [16], but the sample size of study population (n=20) was very small to truly represent general population. Slightly higher values of liver stiffness in our study compared to other studies could be attributed to higher percentage of male subjects in our study (Male:Female, 141:66), as males have higher value of liver stiffness as compared to females.
Liver Stiffness In Various Age Groups
In our study, the study population was divided into various age groups as ≤ 20, 21-30, 31-40, 40-50, 51-60 and > 60 years of age and the values of liver stiffness were 4.46±0.85, 4.62±0.68, 4.47±0.87, 4.33±0.7, 4.48±0.63 and 4.47±0.92 kPa respectively. However, no statistically significant difference was noted in individuals of various age groups (p-value=0.8). No study has compared the effect of age on liver stiffness in Indian population till date. Similar results were noted in the studies by Ling W et al., Cha SW et al., and Conti F et al., where age showed no effect on liver stiffness [17-19].
Liver Stiffness In Males And Females
Further in our study the effect of gender on reference ranges of liver stiffness was estimated (Males 141, Females 66). Liver elasticity was found to be statistically higher in males compared to females (4.56±0.7 versus 4.32±0.8 kPa).
Similar results were shown in the studies done by Corpechot C et al., and Ziol M et al., where LS values were significantly higher in men than women (5.2±0.7 vs. 4.5±1.0 kPa, p <0.01). They attributed these differences in liver stiffness to the fibro-suppressive effect of female oestrogen [20,21].
However, Jain V et al., in their study noted no significant difference in liver stiffness in males and females [22]. No significant difference wasseen in Acoustic Radiation Force Impulse (ARFI) values amongst healthy males and healthyfemales (1.124±0.19 versus 1.107±0.25; p=0.693). This may be attributed to very small sample size and male:female ratio of 3:1. Similarly nogender specific significant difference was noted in liver stiffness in study done by Conti F et al., [19].
So, results of our study were in accordance with various other studies [20,21] analysing the effect of gender on value of liver stiffness and males seems to have a higher values of liver stiffness as compared to females.
Liver Stiffness In Fatty Liver Subjects
In our study, all the subjects included were without any known liver pathology, yet liver steatosis was incidentally detected in 59 subjects. Other 148 (71.5%) were non-steatotic. No significant difference was noted between subjects with fatty liver and normal liver (normal=4.47±0.75 kPa and fatty liver=4.59±0.84 kPa, p=0.798).
In a study by Suh CH et al., 196 normal subjects were included, 123 subjects with normal liver and 73 subjects with hepatic steatosis. No significant difference in liver elasticity was noted between normal and steatotic liver (4.4±0.9 versus 4.3±0.9 kPa, p-value=0.694) [23].
Colombo S et al., in their study of 144 fatty liver subjects calculated median liver stiffness in three groups as mild (n=118), moderate (n=21) and severe (n=5) and the values of liver stiffness were 5.3, 5.4 and 5.8 kPa respectively. Liver stiffness in normal subjects (4.4 kPa) was significantly lower than in those with fatty liver (5.3 kPa, p-value <0.001) [24].
So, the results of our study are in partial concordance with other studies. Lower values of liver stiffness in our population could be attributed to small number of subjects with Grade II fatty liver and no subject with Grade III fatty liver.
Liver Stiffness In Various BMI Groups
To study the effects of confounding factors, subjects were also classified for BMI. Liver stiffness was 4.84±0.80 kPa, 4.44±0.65 kPa, 4.32±0.86 kPa and 4.51±0.72 kPa in underweight, normal, pre-obese and overweight. However, no significant correlation was noted between different BMI groups in our study.
In a study by Roulot D et al., in a population of 429 apparently healthy subjects, liver stiffness was calculated in various BMI categories (>25, 25-30 and > 30) [25]. Liver stiffness was significantly higher in only subjects with BMI ≥ 30 [25].
No significant correlation between LS values and different BMI groups was found in studies by Suh CH et al and Colombo S et al., [23,24].
The results of our study are in accordance with the studies of Suh CH et al., and Colombo S et al., and no significant correlation was noted between BMI and liver stiffness [23,24]. Individuals with BMI ≥ 30 were not present in our study, so its significance could not be determined.
Limitation
Subjects included in our study were selected on the basis of history alone and no biochemical tests were performed thus, these apparently healthy subjects included in our study may not represent true normal population.
Conclusion
Normal reference range of liver stiffness in healthy individuals in Uttarakhand region was 4.48±0.78 kPa. Males have significantly higher liver elasticity as compared to females. Other confounding factors i.e., age, hepatic steatosis and BMI seems to have no significant effect on liver elasticity. We believe that the results of our study will be helpful in improving early diagnosis of hepatic fibrosis in this particular region.