Value of r2 in Statistical Analysis by Pearson Correlation Coefficient
Shaikat Mondal1, Himel Mondal2
1 Postgraduate Student, Department of Physiology, Medical College and Hospital, Kolkata, West Bengal, India.
2 Postgraduate Student, Department of Physiology, Maharaja Krishna Chandra Gajapati Medical College, Ganjam, Odisha, India.
NAME, ADDRESS, E-MAIL ID OF THE CORRESPONDING AUTHOR: Dr. Shaikat Mondal, Postgraduate Student, Department of Physiology, Medical College and Hospital, 88, College Street, Kolkata - 700073, West Bengal, India.
E-mail: drshaikat@gmail.com
Correlation study, Proportion of variance, R square
Dear editor,
We read a research article contributed by Usha Shenoy and Jagadamba in April 2017 issue of your journal [1]. After reading the abstract, we were attracted to the article to know more about increment of lung age along with increased degree of central obesity. However, as we proceeded further in results section of the study, we found some uncommon interpretation of correlation coefficient in the article. Hence, we intended to share our views about the interpretation of Pearson correlation coefficient with journal readers.
In the result section of the study, authors stated that there was a “weak positive” correlation between Conicity Index (CI) and lung age in obese subjects. In presented data ([Table/Fig-1] in said article), the correlation coefficient between CI and lung age was r=0.098. In addition, researchers found a “negative weak” correlation between CI and lung age in non-obese subjects. In that case, correlation coefficient was r=-0.023. Furthermore, authors stated r=0.020 as “weak positive” and r=0.141 as “significant positive” correlation. Authors could be more cautious during interpretation of correlation coefficient as any correlation coefficient (r) <0.20 is commonly considered “very weak” or often “negligible” [2].
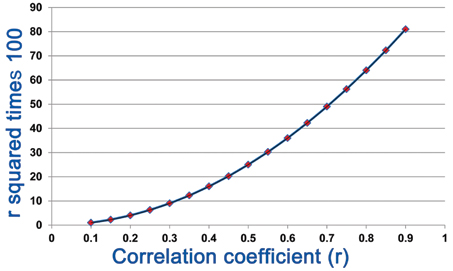
Change in r2 values expressed in percentage with change in r values.
During interpretation of correlation coefficient, we should consider the coefficient of determination (r2) value along with r and p values. The r2 indicates proportion of spread or variance [3-5]. From an analysis, if we get an r=0.3, then, r is multiplied with r, thus we get r2 = 0.09 (0.3 x 0.3) or 9% [6]. This indicates that, in the study sample, 9% of variation in one variable (e.g., CI) is accounted for by the variation in other variable (e.g., lung age) [4]. That is why a correlation coefficient of even r=0.3 may indicate significance when a large sample (e.g., 9% of a sample of 5000=450) is studied. In contrast, it is not that much significant in studies with small sample (e.g., 9% of a sample of 200=18). Hence, the value of r2 is important in interpretation of correlation coefficient.
From the study of discussion, if we take correlation between CI and lung age in obese (r=0.098), stated as “weak positive”, it gives a value of r2=0.0096. Hence, proportion of spread was only 0.96%. Thus, author’s interpretation of a negligible correlation coefficient as “weak positive” was obscure to us. Furthermore, if we calculate r2 from the correlation of CI and lung age in non-obese (r=-0.023), it factually indicate 0% total variation, however, authors stated it as “weak negative” correlation.
In [Table/Fig-1], we presented range of r values in X-axis and r2 values expressed in percentage (i.e., r2 times 100) in Y-axis. It shows how the change in r changes proportion of spread in study population. From this visual presentation, it is clear that why a correlation coefficient (r) <0.2 is commonly considered insignificant. Hope this correspondence would help authors and readers to interpret values of r precisely for their future studies.
[1]. Shenoy U, Jagadamba Influence of central obesity assessed by conicity index on lung age in young adultsJ Clin Diagn Research 2017 11:CC09-CC12. [Google Scholar]
[2]. Heiman GW, Correlation CoefficientsIn: Basic Statistics for the Behavioral Sciences 2011 6th edUSAWadsworth Cengage Learning:135-60. [Google Scholar]
[3]. Browner WS, Newman TB, Hulley SB, Estimating sample size and power: Applications and exampleIn: Designing Clinical Research 2001 3rd edPhiladelphia, PALippincott Williams & Wilkins:65-93. [Google Scholar]
[4]. Aggarwal R, Ranganathan P, Common pitfalls in statistical analysis: The use of correlation techniquesPerspectives in Clinical Research 2016 7(4):187-90. [Google Scholar]
[5]. Walpole RE, Myers RH, Myers SL, Ye K, Simple Linear Regression and CorrelationIn: Probability & Statistics for Engineers & Scientists 2012 9th edBostonPearson Education, Inc:430-433. [Google Scholar]
[6]. Bansal G. What is the difference between coefficient of determination, and coefficient of correlation? Green Bay, Wisconsin: University of Wisconsin–Green Bay. Available from: http://blog.uwgb.edu/bansalg/statistics-data-analytics/linear-regression/what-is-the-difference-between-coefficient-of-determination-and-coefficient-of-correlation/ [Last accessed on 2017 Aug 9] [Google Scholar]