Rapid urbanization, economic growth and change in dietary habits have led to an epidemic of diabetes amongst young Asian Indians with relatively low BMI [1]. Asians are less overweight and obese than their Western counterparts, using conventional definitions BMI ≥25 for overweight and ≥30 for obesity). Despite lower BMI, some Asian countries have similar or even higher prevalence of Diabetes Mellitus (DM) than Western countries [2]. In India, the T1DM and FCPD are the two major contributors to the cohort of low BMI diabetes subjects.
T1DM is one of the most common metabolic disorders of childhood and accounts for 5% to 10% of all diagnosed diabetes cases [3]. T1DM occurs due to the autoimmune destruction of insulin-producing islet beta cells predisposed by genetic and precipitated by environmental and inflammatory factors [4]. The diabetes atlas (2015) has reported that in the South-East Asia Region, the Indian population has the largest prevalence of T1DM [5]. Kalra S et al., have reported a prevalence of 18.3/100,000 in the 0 to 14 years age group in northern India [6].
FCPD is a unique form of diabetes secondary to chronic recurrent pancreatitis, exclusively seen in developing countries of the tropical world [7]. In the Indian continent, the highest prevalence of calcific pancreatitis, (1 in 1020 patients) was reported by Geevarghese (1968) from Kerala [8]. A study from Chennai, in southern India revealed a frequency of FCPD to be 1:5200 in the general population. More recent studies from southern India have shown a drop in the prevalence of FCPD from 1.2% (1991-1995) to 0.2% in the early part of this century (2006-2010) [9].
Both T1DM and FCPD patients have primarily beta cell secretion defects with low body weight and early onset diabetes requiring insulin for glycaemic control. Both groups have a potential for significant fluctuation in glycaemic control.
There is very little literature available on the nutritional intake of the FCPD and T1DM patients from India. The nutritional requirements of these diabetes patients have not been postulated. Studies using nutritional biomarkers like retinol binding proteins, total proteins, prealbumin, albumin, transferrin and ferritin levels amongst various types of diabetes patients revealed that low levels were seen in T1DM and FCPD compared to patients with non insulin DM [10]. Hence, the aim of the study was to assess and compare the differences in the nutrient intake pattern in low BMI Indian male patients with T1DM and FCPD.
Materials and Methods
This is a cross-sectional observational study of T1DM and FCPD patients being managed in the outpatient clinic of the Department of Endocrinology, CMC Vellore which is a Tertiary Care Hospital in Southern India. The main objective was to study the difference in nutrient intake patterns of low BMI male subjects comprising of T1DM (n=40) and FCPD (n=20) patients over a period of six months from December 2015 to May 2016.
Data was obtained, over a period of six months, from male patients aged between 18-45 years with T1DM or FCPD for a duration of at least one year. The dietary data obtained in this study is part of a larger study assessing glucose, insulin and lipid dynamics in low BMI male patients with T1DM and FCPD utilizing complex physiological techniques. The nutrient intake in the two groups of T1DM and FCPD were compared considering the similarity amongst them with respect to beta cell secretion, lean phenotype and glycaemic status.
The FCPD patients were not on pancreatic enzyme supplements at time of inclusion in the study. Patients with known psychiatric illnesses, malignancies, congenital diseases and prevailing syndromes were excluded from the study. Since there was no data on the nutritional profile of FCPD patients, the sample size was calculated based on our previous nutritional study of T1DM patients (for a standard deviation of 444 kcal, mean difference of 465, alpha error of 1.15 and 80% power) and sample size was computed as n=12 for each group [11]. The study consisted of 40 T1DM and 20 FCPD patients who met the inclusion criteria and provided informed consent.
The study protocol conformed to the ethical guidelines of the 1975 Declaration of Helsinki (and revised in 2013) and was approved by the Institutional Review Board of Christian Medical College and Hospital, Vellore, India (IRB Min. No. 9547 dated 22.07.2015).
T1DM was diagnosed on the basis of diabetes in young person with low levels of fasting and stimulated plasma C-peptide levels (<1.0 ng/ml) and presence of one or more of the autoimmune markers- autoantibodies to Glutamic Acid Decarboxlyase (GAD 65) and Islet Antigen 2 (IA-2) {Quantitative Sandwich Immunoassay method (RSR Limited, Cardiff, UK)}. FCPD was diagnosed according to the criteria proposed by Mohan V et al., “diabetes in a patient from tropical country with evidence of chronic pancreatitis: pancreatic calculi on X-ray or at least three of the following: a) abnormal pancreatic morphology by sonography; b) chronic abdominal pain since childhood; c) steatorrhea; d) abnormal pancreatic function test and absence of other causes of chronic pancreatitis i.e., alcoholism, hepatobiliary disease or primary hyperparathyroidism etc” [12].
Clinical parameters were recorded from the electronic medical records. The BMI was interpreted according to Asia-Pacific guidelines [13]. Haemoglobin A1C (HbA1C) was measured using high performance liquid chromatography and stool elastase was detected using ELISA (Bioserv Diagnostics, Germany) with two monoclonal antibodies highly specific for human pancreatic elastase. Nutritional data of the patients was elicited by the dietitian (MJ) using the one day 24 hour recall method along with the weekly food intake entries in their food diaries. The nutrient composition of diet was computed from the book- Nutritive Value of Indian Foods [14]. Patients were provided with individualized advice on diet modification for optimal nutrient intake and better glycaemic control.
Statistical Analysis
The data was statistically analysed using Statistical Package for Social Sciences (SPSS) version 19.0. Percentage analysis was done to represent the data. The Independent sample t-test was used to compare the HbA1C levels, nutrient intake and anthropometric measures of patients. Pearson’s correlation coefficient was done to study the relationship between nutrient, anthropometric and clinical parameters. The p-values <0.05 were considered significant.
Results
Demographic and Biochemical characteristics: A total of 40 T1DM and 20 FCPD male patients who had similar BMI were studied. Their demographic details and biochemical parameters are presented in [Table/Fig-1]. The T1DM patients were significantly younger than the FCPD patients and had diabetes for a longer duration of time with a higher HbA1C levels compared to the FCPD patients, though it was not statistically significant. The haemoglobin, triglycerides, low density lipoproteins, creatinine, albumin and calcium were similar between the groups. However, the FCPD patients had a significantly lower Vitamin D status compared to the T1DM group (p<0.05).
Demographic and biochemical characteristics of patients with T1DM (n=40) and Fibrocalcific pancreatic diabetes (n=20).
| Variables | T1DM (n=40)Mean±SD | FCPD (n=20)Mean±SD | p-value (T1DM V/s FCPD) |
|---|
| Age (years) | 25.15±7.4 | 36.35±9.3 | <0.001 |
| BMI (kg/m2) | 20.7±2.6 | 20.3±3.2 | 0.60 |
| Duration of diabetes (years)a | 7 (1-26) | 5 (1-20) | 0.179 |
| HbA1C (%) | 8.74±2.21 | 8.5±1.95 | 0.635 |
| Hb (g %) | 14.36±2.03 | 13.8±1.74 | 0.37 |
| Triglycerides (mg %)a | 75.5 (27- 689) | 149.5 (37-431) | 0.166 |
| LDL (mg %) | 90.20±24.69 | 90.28±41.36 | 0.993 |
| Creatinine (mg %) | 0.88±0.29 | 0.84±0.19 | 0.673 |
| Stool elastase (μg) | NA | 14.54±10.6 | - |
| Albumin (g %) | 4.38±0.41 | 4.68±0.33 | 0.074 |
| Calcium (mg %) | 9.14 ± 0.56 | 9.51±0.45 | 0.066 |
| Vitamin D (ng/ml) | 16.85±6.89 | 10.56±4.44 | 0.035 |
aReported in Median (Range)
[Table/Fig-2] highlights the nutrient intake of the T1DM and FCPD patients along with the Recommended Dietary Allowances (RDA). There was a deficit in the intake of energy, proteins and carbohydrates in the diet of both groups of patients. The FCPD patients consumed significantly higher amount of fat than the RDA. The intake of fibre was below the RDA in both the groups. There was a significant deficit in the intake of calcium only in the T1DM group. The intake of phosphorous, folic acid and vitamin C was adequate in both the groups. With respect to all other micronutrients like carotene, riboflavin and niacin, there was a gross deficit in their daily intake in both the groups when compared to the RDA. The thiamine intake was adequate in the T1DM group but was deficient in the FCPD group. The calorie contribution from carbohydrates was in line with the RDA (60%-65%) in the T1DM patients (64%) and FCPD patients (60.1%). However, the percentage of protein intake was below the RDA of 15% in both the T1DM (11.3%) and FCPD (12%) patients. The contribution of calorie from fats was more than the RDA (20%-25%) in the FCPD group.
Nutritional data of Type 1 Diabetes mellitus patients (n=40) and Fibrocalcific pancreatic diabetes (n=20),
| Nutrients | Recommended Daily Allowances (RDA) [14] | T1DM (n=40)Mean±SD | FCPD (n= 20)Mean±SD | p-value (T1DM V/s FCPD) |
|---|
| Energy (kcal) | 2320 | 1664.6 ± 311.6 | 1787.1 ± 460.4 | 0.228 |
| Proteins (g) | 87 | 47.1±10.5 | 53.6 ± 20.4 | 0.110 |
| Fat (g) | 52 | 44.9±13.2 | 54.0 ± 20.1 | 0.039 |
| Carbohydrates (g) | 348 | 267.1±46.6 | 270.8±68.9 | 0.804 |
| Fibre (g) | 40 | 7.8±4.6 | 14.5±8.3 | <0.001 |
| Calcium (mg) | 600 | 557.1±215.1 | 689.9±280.5 | 0.047 |
| Phosphorousa (mg) | 600 | 1911 (874-3291) | 2462 (1037-19593) | 0.035 |
| Carotenea (mcg) | 4800 | 2555 (282-10894) | 4300 (432-9141) | 0.154 |
| Thiamine (mg) | 1.3 | 1.3±0.4 | 1.1±0.4 | 0.047 |
| Riboflavina (mg) | 1.5 | 0.86 (0.02-1.6) | 0.79 (0.2-1.99) | 0.216 |
| Niacin (mg) | 17 | 8.4±2.7 | 11.8±4.8 | 0.001 |
| Folic acid (mg) | 200 | 205.8±70.9 | 235.2±108 | 0.210 |
| Vitamin Ca (mg) | 40 | 41 (5-323) | 53.1 (12-345) | 0.337 |
| Iron (mg) | 17 | 13.1 (5.8-28.1) | 16 (7.3-31.5) | 0.157 |
aReported in Median (Range)
Comparing the nutrient intake between the FCPD and T1DM groups, the Independent sample t-test showed that FCPD patients had a statistically significant higher intake of fat, fibre, calcium, phosphorous, and niacin while the T1DM group had a significantly higher intake of thiamine. The percentage of calories from carbohydrates was significantly higher in the T1DM patients and calories from fats were significantly higher in the FCPD group.
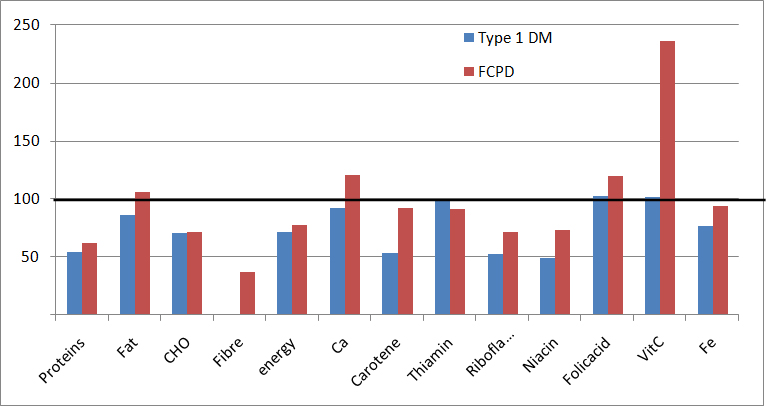
[Table/Fig-3] depicts the intake of macronutrients and micronutrients as percentages of the RDA. The daily intake of macronutrients (proteins, carbohydrates), micronutrients (carotene, riboflavin, niacin, iron), fibre and energy were below the RDA in both the groups of patients. Pearson Correlation was done between the biochemical parameters and the nutrient intake. In the T1DM patients, it was found that a high calorie intake from carbohydrates was associated with increased HbA1C (p=0,009, r=0.411) and in the FCPD group, a high fat intake correlated with a higher stool elastase (p=0.036, r=0.699).
Comparison of nutrient intake of Type 1 Diabetes mellitus patients (n=40) and Fibrocalcific pancreatic disease patients (n=20) as percentages of Recommended Daily Allowance (RDA).
Discussion
Nutrition is an important arm in the management of diabetes [15]. Appropriate medical nutrition therapy is conducive for attaining and achieving glycaemic control. Since both these groups have predominant insulin secretion defects, lean body mass and propensity for fluctuation in the glycaemic control, this study aimed at comparing and contrasting their nutritional profile and to identify potential areas for dietary intervention.
The fear of hypoglycaemia or hyperglycaemia increases their risk of developing eating disorders [16]. Our T1DM patients were younger with a longer duration of diabetes. Biochemical review showed that they had acceptable lipid profile with no evidence of renal involvement. The serum vitamin D levels were found to be low among them which could explain the low normal levels of serum calcium suggesting decreased absorption. Analysing the nutrition data, the energy intake was found to be very low in this group with major contribution from carbohydrates and fats. Protein intake was very low as against the RDA. Their diet was also deficient in micronutrients like calcium, carotene, riboflavin, niacin, and iron and fibre. The intake of phosphorous, folic acid, and vitamin C was adequate.
Two major factors contribute to malnourishment in patients with FCPD: (i) inadequate intake due to fear of pain and malabsorption (exocrine insufficiency); and (ii) increased metabolic activity, contributing to their lean body mass [17]. Indirect calorimetric studies showed that FCPD patients have significantly higher resting energy expenditure as compared to normal adults after adjustment for body mass index and fat free mass [18]. Our groups of FCPD patients were in the third and fourth decade, which is concordant with the natural history of the disease. Biochemical profile showed high triglycerides and low vitamin D levels. Nutrient profile showed deficits in the energy, carbohydrates, protein, fibre, thiamine, riboflavin, niacin and carotene. The fat intake was more than the RDA.
Calorie Intake and the Body Mass Index: According to the RDA for Indians, prescribed by the Indian Council of Medical Research (2010) [14], an adult sedentary man requires 2320 kcal/day. Chronic calorie deficiency leads to underweight. Upto 18% of T1DM and 39% of FCPD patients in our study were found to be underweight which can be explained by the low calorie intake of only 75% of the total requirement in these patients. Studies from Korea and India had reported similar findings [18,19].
Carbohydrate content: Carbohydrates are the major energy source in the diet and must contribute not more than 60 to 65% of the total daily calories. The overall carbohydrate intake (grams) in both of our groups was low. Qualitative analysis found that the major source of carbohydrates was the polished rice in the southern Indian population.
Protein content: A total of 15% to 20% of calories should be contributed from protein, except in people with advanced chronic kidney disease. Both of our study groups had a protein deficient diet pattern. Protein plays a significant role in insulin secretion in patients with preserved beta-cell function as evidenced by studies by Linn T et al., [20]. This phenomenon is possibly due to decreased insulin demand on the beta cells and/or reduced hepatic glucose production favouring enhanced insulin sensitivity. Joseph M et al., in a South Indian study had found that low protein intake was associated with poor glycaemic control in T1DM patients [11]. Pulses are the major source of protein in the Indian diet. Fleshy foods, fish, milk and milk products are expensive sources of protein. One of the major reasons for low protein intake in our group could be the relatively higher cost of protein rich diets.
Fat content: American Diabetes Association recommends that less than 25% to 35% of calories per day should be from fat and less than 7% of calories per day should be from saturated fat [21]. The percentage of calories from fat was higher than RDA in our T1DM (122%) and FCPD (138%) patients. Significantly higher fat consumption in the FCPD group as compared to T1DM was worsening the malabsorption. Cooking oil (sunflower oil, groundnut oil, etc.,) was the major source of fat in the diet of our patient population [11].
Vitamin D: Both our T1DM and FCPD group of patients were deficient in vitamin D. Deficiency of vitamin D as sequelae of fat malabsorption leads to low bone mineral densities resulting in osteopenia and osteoporosis. It predisposes to insulin resistance and metabolic syndrome by affecting beta cell function [22].
Thiamine: Dietary thiamine deficiency was found to be low in both our groups. Thornalley PJ et al., have reported thiamine deficiency in Type 1 and Type 2 diabetes patients and it has been linked to increased microvascular complications [23]. Vindedzis SA et al., found that increasing dietary thiamine intake above the recommended dietary intake of 1-1.4 mg/day did not normalize red cell thiamine levels, suggesting a need for higher than normal thiamine intake in patients with diabetes compared with normal individuals [24].
Riboflavin and Niacin: Riboflavin plays an essential role in the oxidation of free radicals generated due to poor glycaemic control while nicotinamide successfully delayed the onset of T1DM in some small studies [25,26]. Both riboflavin and niacin were deficient in the diet of our study groups.
Fibre: It is recommended that a daily meal plan should contain 30-40 gm of fibre per day. The fibre intake was significantly low in both our study groups. Low fibre diet is associated with poor glycaemic control in T1DM patients [27]. Inclusion of whole gram pulses and legumes, whole grain cereals and millets, fruits and vegetables in the daily meal plan will improve the glycaemic status of the patients.
Overall our study showed that both the groups had similar dietary pattern with deficiency of calories, carbohydrates, proteins, fibre and micronutrients. However, the FCPD patients had a higher dietary fat intake contributing to malabsorption and subsequent poor glycaemic control. This imbalance in the diet composition was in fact detrimental in achieving glycaemic control. Given the significant role of frequent hypoglycaemia in both the groups, a balanced diet consisting of adequate calories, proteins, fats, carbohydrates and micronutrients may enable them to achieve better glycaemic control.
To the best of our knowledge, this is the first study among Asian Indians, with low BMI DM, which has looked at their demographic, clinical and nutritional profile. However, further use of more objective measures of dietary intake along with 24 hour diet recall method and food diaries (used in our study) may enhance our knowledge of the nutritional profile of these patients.
Limitation
Our study was conducted at a single tertiary care centre of Southern India and hence, the number of patients was small while larger, multicentre studies may add further insights into the nutritional needs of this unique population. Further, our study has relied on 24-hour recall methods and food diary to obtain the nutritional data. Use of more objective measures for nutritional assessment may enhance the understanding of the dietary requirement of these subjects.
Conclusion
Our study points out to the significant lacunae in the nutrient intake in a group of insulin requiring low BMI diabetes patients from India. Given the propensity of both T1DM and FCPD subjects to have frequent glycaemic excursions, an individualized and appropriate nutritional recommendation is key to adequate glycaemic control.
aReported in Median (Range)
aReported in Median (Range)