Assessment of age post death remains a major challenge in forensic sciences. Ascertaining the age plays a significant role in forensic medicine, not only in identification of the deceased, but also in connection with crimes [1]. When the external characteristics of an individual yield no information regarding subjects due to post-mortem changes, the teeth are often the only means of proof of identity. The resistance to decay has made teeth an advantageous tool for assessment of age at death of an individual [2].
There are many anthropological techniques for age assessment at death in children and adults. However, these methods require population specific references and are less precise for adults [3]. Therefore, new methods like amino acid racemization are being developed [4].
Structural alterations which occur gradually in teeth throughout life are the basis for age estimation. The enamel, dentin and cementum are the major component of teeth and have been used for estimating age of an individual [1]. Various methods are used for determination of age from dentition. They may be categorized as clinical, radiographic, histological, physical and chemical analysis [5].
Recently, Raman spectroscopy has gained attention in biomedical fields. This is owing to the fact that there is presence of significant amount of water in biological soft and hard tissues. Also, water causes minimal interference in Raman spectra. In Raman spectroscopy, spectral analysis is carried out in reflection mode and therefore tissues can be investigated in their natural state with or without any nominal preparation of sample [6]. Raman spectroscopy is simple, quick, sensitive enough, non destructive and non-invasive method that provides vital data about the structure, molecular composition and interactions within a sample [7].
Raman spectrum can reveal chemical composition of any mineral, including human teeth, making it an efficient selective technique for investigating molecular species [8,9]. For dental research, Raman spectroscopy has been used for analysing dental tissue composition and investigating adhesive-dentin/enamel interface [10]. Therefore, Raman spectrometry was the choice of technique for this study.
Materials and Methods
It is a prospective study conducted in MS Ramaiah Dental College Karnatka, India, during March 2016 to May 2016.
Specimen Preparation
The sample size of 40 was calculated based on the prospective study conducted with 95% confidence interval and 5% error. The sound permanent extracted tooth specimens were collected from Faculty of Dental Sciences, MS Ramaiah University of Applied Sciences, Bangaluru, Karnataka, India. Teeth indicated for extraction (orthodontic and prosthetic purpose and periodontally compromised teeth) were included in present study with Institutional Ethical Committee approval. Characteristics of the samples are collated in [Table/Fig-1]. The 40 teeth samples comprised of 22 women (mean age 34 years) and 18 men (mean age 36 years). Immediate to extraction, teeth were washed with water and immersed in 2% sodium hydroxide solution for 24 hours. After that teeth were stored in saline solution at 6°C until their evaluation by Raman spectroscopy [11]. Later each tooth was sectioned into two parts perpendicular to the occlusal surface using a high speed dental hand piece and diamond bur.
Showing characteristics of samples used in the present study.
| Specimen | Sex | Tooth Number (FDI system)* | Age(in years) |
|---|
| 1 | Male | 21 | 52 |
| 2 | Female | 14 | 12 |
| 3 | Female | 12 | 41 |
| 4 | Male | 34 | 19 |
| 5 | Male | 26 | 38 |
| 6 | Male | 31 | 44 |
| 7 | Female | 13 | 41 |
| 8 | Male | 25 | 38 |
| 9 | Female | 16 | 41 |
| 10 | Male | 32 | 44 |
| 11 | Male | 24 | 19 |
| 12 | Male | 24 | 38 |
| 13 | Female | 14 | 27 |
| 14 | Male | 15 | 19 |
| 15 | Female | 35 | 19 |
| 16 | Female | 44 | 12 |
| 17 | Female | 14 | 26 |
| 18 | Male | 37 | 53 |
| 19 | Male | 14 | 14 |
| 20 | Male | 34 | 21 |
| 21 | Female | 44 | 26 |
| 22 | Female | 45 | 22 |
| 23 | Female | 42 | 50 |
| 24 | Female | 27 | 50 |
| 25 | Female | 45 | 27 |
| 26 | Female | 24 | 19 |
| 27 | Female | 25 | 48 |
| 28 | Female | 14 | 74 |
| 29 | Female | 14 | 22 |
| 30 | Female | 15 | 74 |
| 31 | Female | 24 | 15 |
| 32 | Female | 15 | 17 |
| 33 | Male | 16 | 42 |
| 34 | Male | 37 | 62 |
| 35 | Female | 16 | 29 |
| 36 | Male | 37 | 32 |
| 37 | Male | 15 | 38 |
| 38 | Male | 35 | 18 |
| 39 | Male | 17 | 55 |
| 40 | Female | 36 | 58 |
Raman Microspectroscopy Analysis
Raman microspectrometry analysis was performed using ‘Spectrum Five Labrum’ spectrometer, attached to an ‘Olympus BX 50’ microscope. The excitation source was 785 nm monochromatic radiation emitted by diode lasers. The resolution of spectrum was nearly 0.4 cm and power of the laser was 30 mW. Measurements were taken with the same spectrum acquisition setting and under the same conditions. Silicon was used as a standard for wave number calibration of the instrument.
To investigate the chemical and histological variations in dentin and cementum, three dentinal areas and one cemental area was defined for each tooth. Measurements were performed twice per area and statistically averaged by LabSpec 5 software, thus implying four measures for each sample. Each measurement corresponded to a characteristic spectrum of the analysed dentinal and cemental location. The frequency spread ranged from 750 cm-1 to 3200 cm-1, allowing a characterization of inorganic and organic component of the dentin and cementum. Observed stretch bands were identified [9-12], and used for statistical analysis {Phosphate grouping - 960 cm-1; carbonate (CO32-) band - 1070 cm-1; amides III - 1265 cm-1; amides II - 1450 cm-1; amides I - 1668 cm-1 and CH grouping - 2940 cm-1}.
Since, there is a direct proportionality between band intensities and number of molecules being probed [8,9], area under the curve for each spectrum was calculated using LabSpec 5.0 software. Ratios were constructed from the curve parameters and using them a quantitative analysis was performed for the chemical composition of the specimens. Raman spectra of dentin are shown in [Table/Fig-2].
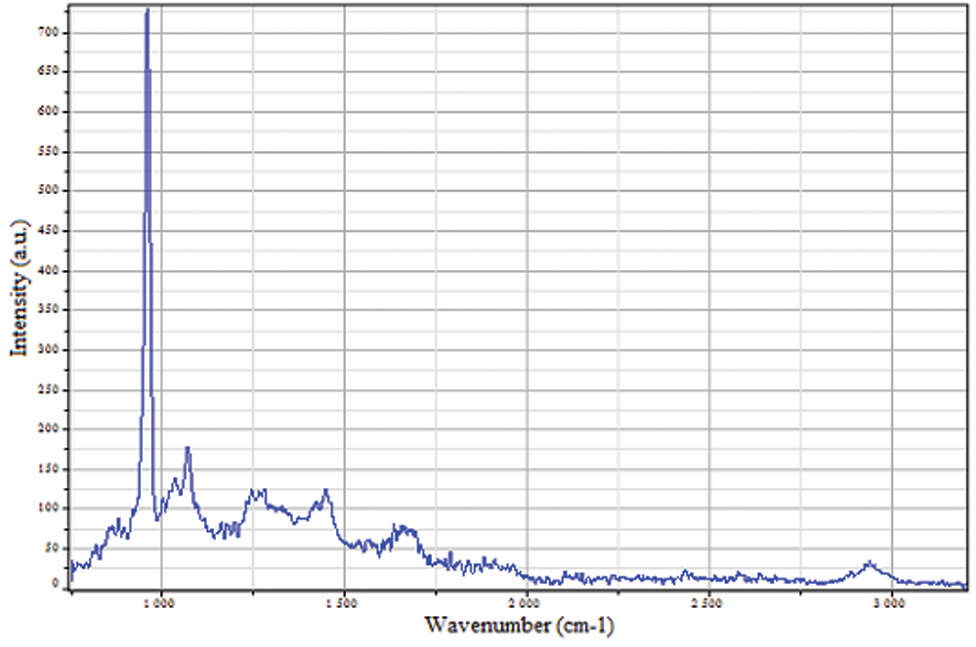
After plotting the readings graphically, it was observed that band 5 and band 6 (i.e., amides I and CH grouping) peaks were not consistent for all the samples to be considered in the ratios. So, only first 4 bands {phosphate grouping at 960 cm-1, amides III at 1265 cm-1, amides II at 1450 cm-1 and carbonate (CO32-) band at 1070 cm-1} were considered for further analysis.
Ratios were constructed from the curve parameters both for dentin and cementum. Constructing ratios enabled ‘feature scaling’, which is required for efficient algorithmic computations in multivariate linear regression.
The ratios for dentin areas were as follows:
1 Area-Under-the-curve Ratios (Sn) for n-band;
2 Maximum Intensity Ratios (In) for n-band;
3 Full Width at Half Maximum Ratios (Ln) for n-band [9].
A total of 59 ratios were constructed to quantify variations on different bands. The ratios with higher Pearson’s correlation coefficients were selected and total of 27 ratios which acted as best predictors in the model were used further for statistical regression analysis [Table/Fig-3].
Correlation coefficients for dentinal area ratios
| X_[ACR]_[Ratio] | Formula | r Coefficient X_A_R | r Coefficient X_C_R | r Coefficient X_R_R |
|---|
| R1 | {I1/(I1+I2+I3+I4)} | 0.27 | -0.03 | -0.21 |
| R2 | {I2/(I1+I2+I3+I4)} | 0.18 | 0.14 | 0.19 |
| R3 | {I3/(I1+I2+I3+I4)} | -0.49 | -0.32 | 0.14 |
| R4 | {I4/(I1+I2+I3+I4)} | -0.21 | 0.21 | 0.16 |
| R5 | {I1/I4} | 0.25 | 0.09 | -0.21 |
| R6 | {I2/I4} | 0.20 | 0.13 | 0.04 |
| R7 | {I3/I4} | -0.35 | -0.22 | -0.05 |
| R8 | {I2/I3} | 0.51 | 0.27 | 0.06 |
| R9 | {I1/I2} | -0.09 | -0.03 | -0.18 |
| R10 | {I1/L1} | -0.51 | -0.26 | -0.48 |
| R11 | {I2/L2} | -0.37 | -0.06 | -0.42 |
| R12 | {I3/L3} | -0.69 | -0.09 | 0.31 |
| R13 | {I4/L4} | -0.39 | 0.10 | -0.09 |
| R14 | {I1/(L1+L2+L3+L4)} | -0.52 | 0.06 | -0.26 |
| R15 | {I2/(L1+L2+L3+L4)} | -0.55 | 0.11 | -0.20 |
| R16 | {I3/(L1+L2+L3+L4)} | -0.77 | -0.21 | -0.19 |
| R17 | {I4/(L1+L2+L3+L4)} | -0.62 | 0.15 | -0.20 |
| R18 | {S1/(S1+S2+S3+S4)} | 0.22 | 0.76 | 0.43 |
| R19 | {S2/(S1+S2+S3+S4)} | -0.02 | -0.50 | -0.12 |
| R20 | {S3/(S1+S2+S3+S4)} | -0.11 | -0.45 | -0.46 |
| R21 | {S4/(S1+S2+S3+S4)} | -0.13 | -0.32 | -0.08 |
| R22 | {S1/I1} | -0.03 | 0.70 | 0.15 |
| R23 | {S2/I2} | -0.22 | -0.45 | -0.35 |
| R24 | {S3/I3} | 0.08 | -0.30 | -0.54 |
| R25 | {S4/I4} | 0.01 | -0.08 | -0.28 |
| R26 | {S2/S1} | -0.09 | -0.65 | -0.25 |
| R27 | {S3/S1} | -0.19 | -0.57 | -0.36 |
| R28 | {S4/S1} | -0.22 | -0.58 | -0.12 |
| R29 | {S2/S3} | 0.06 | 0.18 | 0.43 |
| R30 | {S2/S4} | -0.02 | -0.08 | 0.08 |
| R31 | {S3/S4} | -0.15 | -0.12 | -0.35 |
| R32 | {S1/L1} | -0.43 | 0.12 | -0.38 |
| R33 | {S2/L2} | -0.46 | -0.28 | -0.54 |
| R34 | {S3/L3} | -0.55 | -0.19 | -0.39 |
| R35 | {S4/L4} | -0.33 | -0.21 | -0.35 |
| R36 | {L1/(L1+L2+L3+L4)} | 0.16 | 0.47 | 0.32 |
| R37 | {L2/(L1+L2+L3+L4)} | -0.07 | -0.01 | 0.50 |
| R38 | {L3/(L1+L2+L3+L4)} | 0.31 | -0.24 | -0.47 |
| R39 | {L4/(L1+L2+L3+L4)} | -0.28 | -0.02 | -0.12 |
| R40 | {L1/L4} | 0.17 | 0.27 | 0.00 |
| R41 | {L2/L4} | 0.10 | -0.07 | 0.14 |
| R42 | {L3/L4} | 0.20 | -0.24 | -0.28 |
| R43 | {L2/L3} | -0.23 | -0.10 | 0.56 |
| R44 | {I1*L1/S1} | -0.22 | -0.67 | -0.19 |
| R45 | {I2*L2/S2} | -0.10 | -0.13 | 0.49 |
| R46 | {I3*L3/S3} | -0.22 | -0.26 | -0.05 |
| R47 | {I4*L4/S4} | -0.28 | -0.15 | -0.08 |
| R48 | {I1*L1/(S1+S2+S3+S4)} | -0.07 | -0.21 | 0.08 |
| R49 | {I2*L2/(S1+S2+S3+S4)} | -0.10 | -0.25 | 0.39 |
| R50 | {I3*L3/(S1+S2+S3+S4)} | -0.22 | -0.50 | -0.31 |
| R51 | {I4*L4/(S1+S2+S3+S4)} | -0.35 | -0.30 | -0.09 |
| R52 | {S1/(L1+L2+L3+L4)} | -0.48 | 0.45 | -0.18 |
| R53 | {S2/(L1+L2+L3+L4)} | -0.43 | -0.28 | -0.43 |
| R54 | {S3/(L1+L2+L3+L4)} | -0.52 | -0.34 | -0.65 |
| R55 | {S4/(L1+L2+L3+L4)} | -0.57 | -0.19 | -0.50 |
| R56 | {S1/(I1+I2+I3+I4)} | 0.12 | 0.73 | 0.08 |
| R57 | {S2/(I1+I2+I3+I4)} | -0.08 | -0.36 | -0.21 |
| R58 | {S3/(I1+I2+I3+I4)} | -0.16 | -0.38 | -0.35 |
| R59 | {S4/(I1+I2+I3+I4)} | -0.14 | -0.26 | -0.13 |
These ratios have been named as follows:
(X_A_Ri): i denotes ratio number, A denotes – Apical dentin area. So, Ratio (X_A_R3) indicates the R3 ratio for Apical dentin.
(X_C_Ri): C denotes – Coronal dentin area. So, Ratio (X_C_R30) indicates the R30 ratio for Coronal dentin.
(X_R_Ri): R denotes – Root dentin area. So, Ratio (X_R_R30) indicates the R30 ratio for Root dentin.
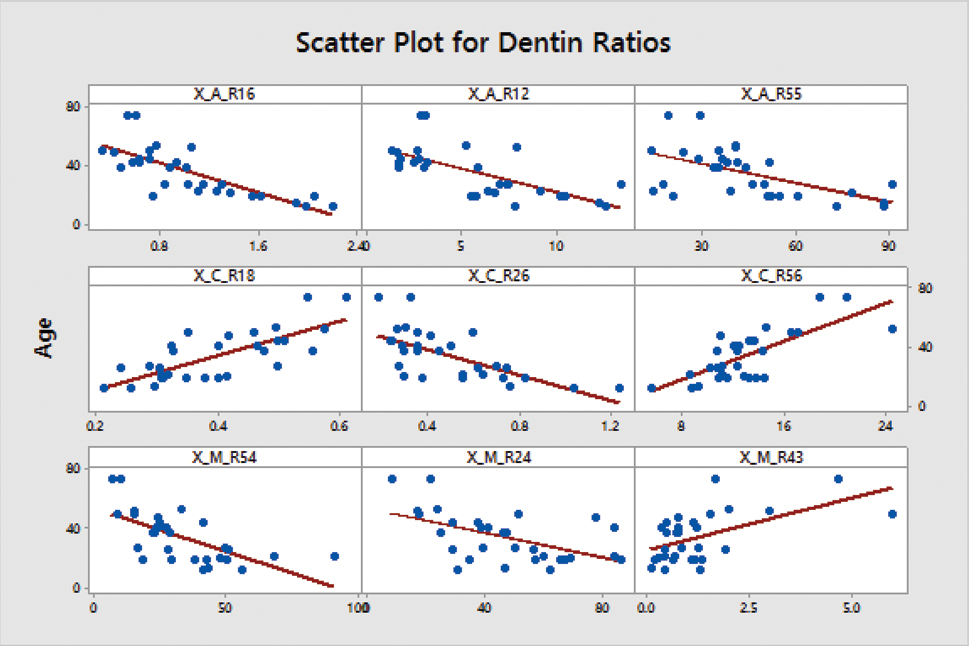
For some of the selected ratios, correlation is depicted in the form of scatter plot [Table/Fig-4]. A significant coefficient (r) threshold of value 0.40 was considered to shortlist the predictor ratios. This ensured that only the best predictor ratios were included in the multivariate linear regression model.
Scatter plot for dentin ratios.
Ratios for Apical Cementum
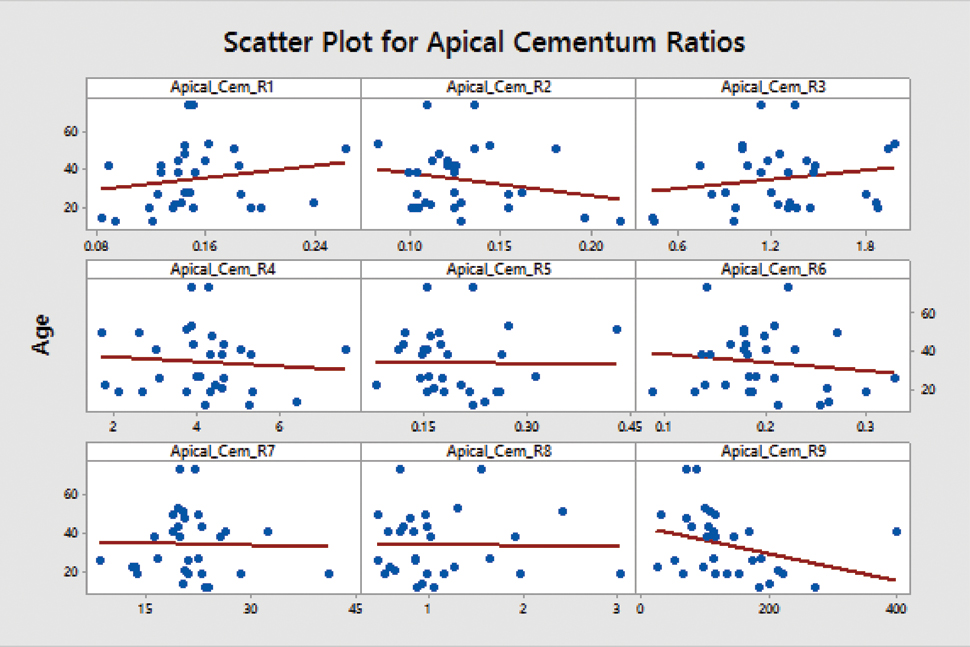
Three main bands same as that of dentin were considered for constructing ratios and the fourth band i.e., carbonate (CO32-) band at 1070 cm-1 was not significant enough to be measured using filters. For each ratio, the Pearson’s correlation coefficient was computed. It was observed that the correlations coefficients were comparatively much lower for cementum ratios [Table/Fig-5]. A significant variation was observed in the cementum ratios, which was not uniform with age.
Correlation coefficients of apical cementum ratios.
| Apical_Cementum_Ratio | Formula | r Coefficient |
|---|
| R1 | {I1/(I1+I2+I3)} | 0.272867556 |
| R2 | {I2/(I1+I2+I3)} | 0.179246146 |
| R3 | {I3/(I1+I2+I3)} | -0.294698584 |
| R8 | {I2/I3} | 0.350918503 |
| R9 | {I1/I2} | -0.0899543 |
| R10 | {I1/L1} | -0.250820201 |
| R11 | {I2/L2} | -0.373328177 |
| R12 | {I3/L3} | -0.26935405 |
| R14 | {I1/(L1+L2+L3)} | -0.15150742 |
| R15 | {I2/(L1+L2+L3)} | -0.153929943 |
| R16 | {I3/(L1+L2+L3)} | -0.167454291 |
| R18 | {S1/(S1+S2+S3)} | 0.224221374 |
| R19 | {S2/(S1+S2+S3)} | -0.024343329 |
| R20 | {S3/(S1+S2+S3)} | -0.113174512 |
| R22 | {S1/I1} | -0.030021825 |
| R23 | {S2/I2} | -0.216174068 |
| R24 | {S3/I3} | 0.076697058 |
| R26 | {S2/S1} | -0.09204952 |
| R27 | {S3/S1} | -0.190201538 |
| R29 | {S2/S3} | 0.060532635 |
| R32 | {S1/L1} | -0.343441822 |
| R33 | {S2/L2} | -0.345528695 |
| R34 | {S3/L3} | -0.35530342 |
| R43 | {L2/L3} | -0.231022893 |
| R44 | {I1*L1/S1} | -0.218483795 |
| R45 | {I2*L2/S2} | -0.097420939 |
| R46 | {I3*L3/S3} | -0.218188791 |
Correlation coefficient greater than 0.40 in magnitude was not observed. The R-Squared value for cementum ratios were much lesser than 0.30 and hence, apical cementum ratios for further model construction were not used [Table/Fig-6].
Scatter plot for cementum ratios.
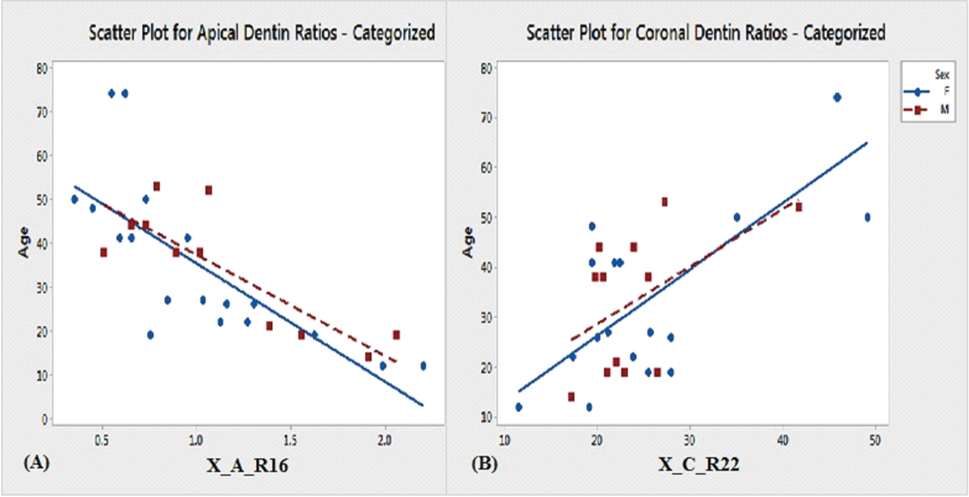
After short listing the predictor ratios, further scatter plot analysis was done to observe if there were significant differences in the correlation ratios, based on the gender. The results are depicted in [Table/Fig-7] for some of the predictor ratios.
Scatter plot for apical and coronal dentin ratios (male vs female).
Statistical Analysis
In the present study, there were comparatively limited observations from which numerous predictive variables were measured, with only dependent variable i.e., age. After shortlisting selected predictors from the dentin area ratios, Partial Least Squares (PLS) regression method was employed on training set of 30 teeth for constructing the model using Minitab Statistical Software version 17.0 (Minitab Inc, State College, Pennsylvania, USA). PLS regression is mainly useful and effective when the predictor variables are strongly correlated or even collinear [13].
Results
Training Set
PLS linear regression method was applied for a training set of 30 teeth, and a significantly good fit for this model was obtained.
After keeping the 27 most significant predictors, we obtained a PLS regression formula, which is as follows:
Age = -140.498*X_A_R3 - 18.671*X_A_R8 + 0.587*X_A_R10 - 0.348*X_A_R12 - 4.943*X_A_R14 - 6.907*X_A_R15 - 8.223*X_A_R16 + 12.124*X_A_R17 - 0.025*X_A_R34 + 0.112*X_A_R54 - 0.111*X_A_R55 + 102.205*X_C_R18 - 17.981*X_C_R19 + 0.654*X_C_R22 + 14.783*X_C_R26 + 4.578*X_C_R27 + 5.679*X_C_R28 - 11.675*X_C_R44 + 11.634*X_C_R50 - 0.355*X_C_R56 + 0.098*X_R_R24 - 0.018*X_R_R33 + 82.967*X_R_R37 - 3.638*X_R_R43 - 2.219*X_R_R45 - 0.147*X_R_R54 + 0.116*X_R_R55.
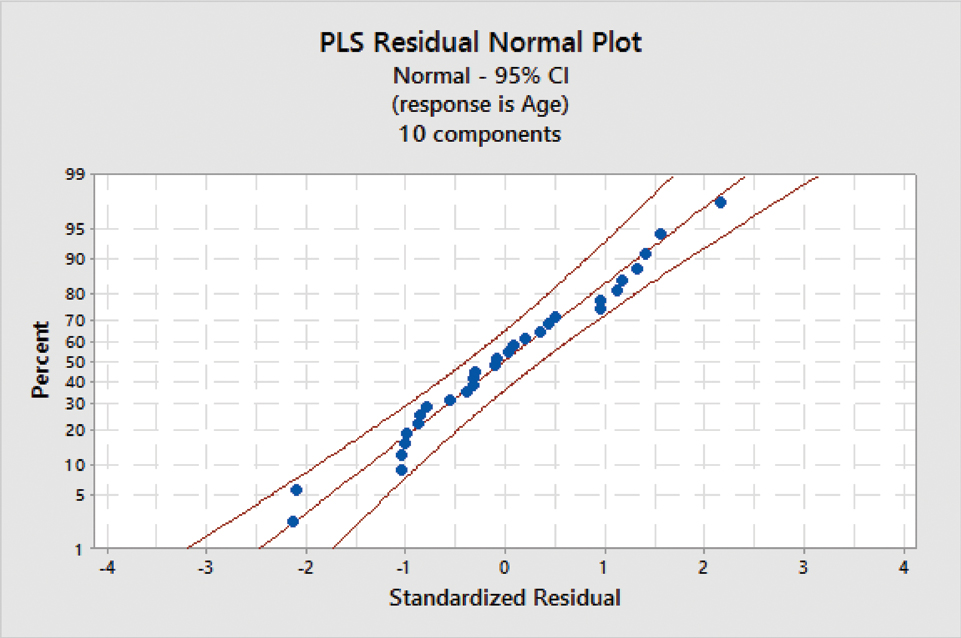
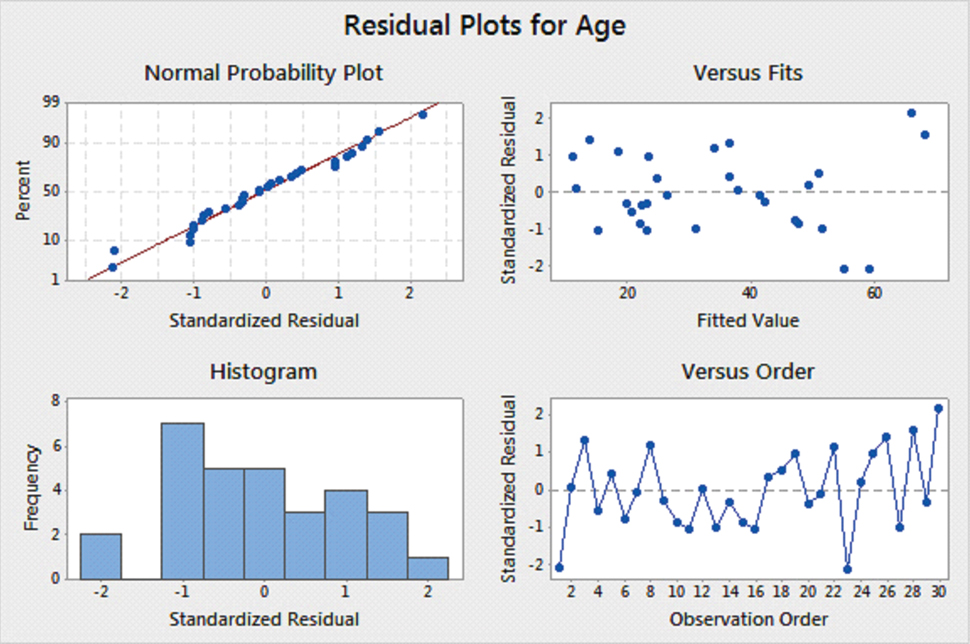
PLS regression results have been graphically summarized in [Table/Fig-8] depicting PLS residual normal plot and [Table/Fig-9] depicting residual plots for age. The statistical fit parameters obtained were: R-squared: 0.94 and R-squared (adjusted): 0.91.
PLS residual normal plot.
After applying the above formula for the samples, the correct age was estimated, with a mean error of greater or less than ±3 years [Table/Fig-10].
Result of prediction for PLS regression for training set.
| Specimen | Age(In years) | Predicted age(In years) | Residuals |
|---|
| 1 | 52 | 59.0501 | -7.05008 |
| 2 | 12 | 11.7687 | 0.23127 |
| 3 | 41 | 36.424 | 4.57598 |
| 4 | 19 | 20.5534 | -1.5534 |
| 5 | 38 | 36.4095 | 1.59046 |
| 6 | 44 | 47.1447 | -3.14468 |
| 7 | 41 | 41.3058 | -0.30578 |
| 8 | 38 | 34.0046 | 3.99543 |
| 9 | 41 | 42.1764 | -1.17642 |
| 10 | 44 | 47.5925 | -3.59245 |
| 11 | 19 | 23.002 | -4.002 |
| 12 | 38 | 37.8749 | 0.12512 |
| 13 | 27 | 31.1004 | -4.10044 |
| 14 | 19 | 19.8119 | -0.81189 |
| 15 | 19 | 22.1797 | -3.17966 |
| 16 | 12 | 15.2187 | -3.2187 |
| 17 | 26 | 24.6734 | 1.32662 |
| 18 | 53 | 51.061 | 1.93903 |
| 19 | 14 | 11.0161 | 2.98385 |
| 20 | 21 | 22.3194 | -1.31939 |
| 21 | 26 | 26.2927 | -0.29274 |
| 22 | 22 | 18.4942 | 3.50581 |
| 23 | 50 | 54.9557 | -4.9557 |
| 24 | 50 | 49.2326 | 0.76742 |
| 25 | 27 | 23.4836 | 3.51641 |
| 26 | 19 | 13.7731 | 5.22691 |
| 27 | 48 | 51.5993 | -3.5993 |
| 28 | 74 | 68.2847 | 5.71534 |
| 29 | 22 | 23.1936 | -1.19362 |
| 30 | 74 | 66.0034 | 7.99661 |
Test Set
For validating the model, 10 teeth were considered from the original set of 40 teeth. Raman spectra data were computed as was done for initial set of 30 teeth. The ratios which were used in the model equation were then computed for each sample.
Using these values, the predicted age was computed. The computed age was converted to an integer value [Table/Fig-11].
Model validation results.
| Sl.No | Validation sample specimen | Actual Age(In years) | Predicted Age(In years) |
|---|
| 1 | 31 | 15 | 17 |
| 2 | 32 | 17 | 20 |
| 3 | 33 | 42 | 39 |
| 4 | 34 | 62 | 55 |
| 5 | 35 | 29 | 33 |
| 6 | 36 | 32 | 35 |
| 7 | 37 | 38 | 41 |
| 8 | 38 | 18 | 20 |
| 9 | 39 | 55 | 51 |
| 10 | 40 | 58 | 52 |
The correct age was estimated, with a mean error of ±3.5 years.
Discussion
Chemical analysis of the tissue both in vivo and ex vivo can be done using Raman spectroscopy [14]. Raman microspectrometry, enables the collection of spectra from <1um 3 volumes, allowing the analysis of microscale features of biological samples [15]. A major advantage of Raman microspectrometry for the analysis of biological materials is that there is no requirement for chemical or mechanical pre treatment and specimens can be explored in their natural hydration state. Specimens prepared for optical microscopy and protected using slide covered slips can also be studied [16]. Hard tissues like bone or teeth can be examined directly without being fixed, dehydrated or embedded although embedded tissues can also be examined. Also, thin and thick, as well as hydrated specimens can be probed. The only prerequisite is that the tissue should be blood free, as the haem groups in the blood fluorescence under the Near-Infrared Laser (NIR) laser [15].
The use of mathematical and statistical methods to develop the understanding of chemical information is called chemometrics. It helps in correlating physical properties to analytical instrument data. There are many chemometric analyses for spectroscopy’s data for example; Partial Least Square regression (PLS), pattern recognition, Principle Component Analysis (PCA), and clustering [15]. PLS regression method allows many predictive variables to be included, even when the number of observations is less. It is an iterative method for construction of Latent Variables (LV) and determines the LVs which are highly correlated to age [9].
The enamel and dentin hydroxyapatite crystals have been studied by Raman spectroscopy [6]. A change in intensity of the phosphate (PO43-) band has been linked to the type of dentin, its anatomical location and to the subject’s age [17].
Although there are many studies for age estimation using teeth, the spectroscopic analysis of dentin and cementum for age estimation has not been explored to a great extent [1,2,5,9]. In the present study, analysis of dentin and cementum using Raman microspectrometry showed correlation between stages of evolution of dentin with progressing age and variability on Raman spectra. These results are consistent with results of Tramini P et al., for dentin and it was found that cementum spectra specifically from incremental lines of cementum did not act as good predictor of age estimation [9]. The reasons could be as follows:
Intensity ratios exhibit the same behaviour between dark and light line of the cementum of the same sample.
The incremental lines in the acellular extrinsic fibre cementum, the mineral crystallites and collagen fibrils align in the same fashion.
Incremental lines are not due to the orientation of the mineral crystallites and the collagen fibrils [18].
Aziz O et al., established a correlation between Raman spectra imaging of human teeth and ageing [19]. They analysed human extracted molars by Raman spectroscopy and recorded 3 points on each tooth: first on enamel, second on tooth neck and third on tooth apex. At the tooth apex, the difference between predicted and measured age was of 6.8 years. In present study, all the three points in dentinal areas gave same results with an error of 3 years between predicted and measured age.
Scatter plot for apical and coronal dentin ratios (male vs female) are depicted in [Table/Fig-7]. In present study, younger age group specimens (12 to 30 years age) seemed to be predicted more accurately, when compared with 30-74-year-old age group, which is in contrast with results of Tramini P et al., [9]
The amide bands, mainly amides II and III, are thought to be good indicators of protein conformation because amide moiety has a role in cross linking and bonding. The present data showed that both the height and location of the resonance enhanced amide II and amide III band vary with age.
Based on the results of the present study, the authors would like to emphasize the relative accuracy of Raman microspectrometry in estimating the age based on a non destructive analysis of different dentinal and cemental areas of the human tooth.
Limitation
The study did not assess the efficiency of Raman’s spectroscopy in determining the age of severely decayed, restored, damaged tooth specimens. Further, most of the examined tooth were freshly extracted, thus, further studies with Raman’s spectroscopy determining the age of preserved tooth for varying periods of time could be highly informative. Although Raman’s spectroscopy mediated age estimation has shown relatively good accuracy in determining the age of the tooth specimen, at present its availability is restricted to large scale research laboratories, thus restricting its use in day today forensic analysis. In the current study, the time elapsed between examination of teeth and extraction was less, so verification of chemical composition stability and changes in components after death remains unexplored.
Conclusion
Using Raman microspectrometry, the histological tissue type and identification of even small quantity of dentin and cementum could be done. Raman’s spectroscopy measures the age of the tooth based on its compositional information of inorganic (PO43-) and organic (mainly collagen) constituents of tooth. Thus, unlike conventional means of age estimation, the structural integrity of the teeth would not greatly affect the Raman spectroscopy mediated age estimation process. The data provided by this technique and use of effective statistical method helped in predicting the chronological age quite accurately. Therefore, could be considered as an adjunctive to the conventional methods of age estimation for any race, without any population specific standards and contribute to the identification of unknown individuals in forensic sciences. Though Raman microspectrometry is extremely reliable method, but still there is lack of popularity of this method. The possible reasons could be as specimen has to be blood free, limited availability of Raman spectroscopy technique, cost effectivity, technique sensitivity.