Standing height is most important parameter to assess and track longitudinal growth and nutritional status in children and adolescents [1]. Measurement of height is essential for calculation of body mass index. Hence, it is one of the common anthropometric measurements for estimation of body fatness [2]. Measurement of height is also required to calculate body surface area, energy requirement, and to adjust drug dosage [3,4]. Height is also important for identification of person in medicolegal cases. However, measurement of accurate height may be difficult in individual who cannot stand or have deformity like contracture, kyphosis, scoliosis, spasticity, and deformed or amputated limb [5].
Several previous studies were conducted to establish regression equation for estimation of height of adult population from arm span in India [6-10]. Though several studies were carried out abroad on children to establish regression equation [11-13], little literature is available for Indian children. Dorjee B and Sen J conducted a study on 3-11 years old children in West Bengal [14], and Yousafzai AK et al., on 2-6 years children in Mumbai [5]. No published literature is available about similar study carried out in the age group of 6-11 years in the state of Odisha, India.
With this background, the present study was designed to establish a regression equation to estimate height from arm span data in 6-11 years children in state of Odisha, India and to compare the applicability of this equation with HAR for estimation of height.
Materials and Methods
After designing the study protocol, permission from Institutional Ethics Committee was obtained. A cross-sectional study was carried out in Berhampur, a municipal area in district of Ganjam in Odisha state, India from October 2016 to February 2017.
Sampling technique: After reviewing previous similar published studies [5,6,14], sample size was calculated according to the formula N= ((Zα+Zβ)2*S2)/E2 where Zα= the standard normal deviate for α, Zβ= the standard normal deviate for β, S=Standard Deviation of outcome variable, E=Expected effect size [15]. For this study, expected effect size was E=2; expected standard deviation of outcome variable was S=12. Two tailed α=0.05 and β=0.2 was set. With these data, calculated minimum sample size was n=1130. We aimed to include sample more than this figure according to available resource and manpower. A convenience sample was taken from nearby government and private schools in Berhampur municipal area. Boys and girls in the age range 6-11 years were included for the study. Exclusion criteria were children with any anatomical deformities like chest and extremity deformity, amputated limb or children who cannot maintain erect posture. Final sample (n=1465) comprised of 774 boys and 691 girls. Sample was subdivided into six groups according to the age of the children. Consent was obtained from the respective school authority.
Anthropometric measurement: Standing height was measured using stadiometer to nearest 0.1 cm. The stadiometer was equipped with a fixed scale and a sliding head piece. Reading of height was directly recorded from the scale. Children stepped on the stadiometer with legs straight, knees together, arms at the side, shoulder relaxed and their back touching the metallic scale so that the head, buttock and heels touch the scale. The feet were positioned on the stadiometer so that the heels touch together and toes pointed outward with 60° angle. Head was aligned in Frankfurt’s plane (i.e., horizontal line from upper margin of ear canal to the lower border of the orbit is parallel to the floor and perpendicular to the measuring scale). Then, the head piece was lowered on the head of the subject. The firm placement was confirmed with sufficient pressure to compress the hair. Children were instructed to take a deep breath and measurement was taken [16]. For arm span measurement, a hard board was attached to the wall of the room. Children stood barefoot with their back on the wall. Both arms and fingers were maximally outstretched in a horizontal plane and both ends of tip of the middle finger (i.e., longest finger of respective hand) were marked. Then, the child stepped out from the position and the distance between marked points was measured by a fiberglass measuring tape to nearest 0.1 cm. Lowest interobserver variation was reported in measurement of height amongst all body composition measurements [17]. It was assumed that arm span measurement would have same level of interobserver variation as both are simple length measurement. Hence, interobserver variation was not taken into consideration for this study.
Statistical Analysis
Height, arm span and height-to-arm span ratio (HAR) were categorized according to sex and subdivided into six groups according to age of the subjects. Mean and standard deviation of these anthropometric data were compared amongst boys and girls statistically by unpaired t-test. Pearson correlation coefficient and regression analysis were carried out between height and arm span in different age groups, sexes and in total subjects. Estimated height was calculated from the obtained regression equation and from HAR. Estimated height was subtracted from the observed height for using it in residual analysis. Statistical analyses were carried out in Microsoft Excel® [18] and in GraphPad Prism version 6.01 (GraphPad Software, Inc., Chicago, USA). For all the statistical analysis, α (two tail) was set at 0.05. Hence, a p-value <0.05 was considered statistically significant.
Results
Among study subjects (n=1465), 774 (52.83%) were boys and 691(47.17%) were girls. Among total subjects, number of subjects in 6 years age group was 163 (11.13%), 7 years was 258 (17.61%), 8 years was 220 (15.02%), 9 years was 272 (18.57%), 10 years was 264 (18.02%), and 11 years was 288 (19.66%). Height and arm span in boys (124.16±8.74 cm and 125.57±10.43 cm respectively) was significantly (p<0.001) more than girls (121.18±10.37 cm and 121.50±11.68 cm respectively). Anthropometric parameters in boys and girls are shown in [Table/Fig-1].
Anthropometric parameters in boys and girls expressed in mean±standard deviation.
| Boys (n=774) | Girls (n=691) | t-test p |
|---|
| Height (cm) | 124.16±8.74 | 121.18±10.37 | <0.001* |
| Arm span (cm) | 125.57±10.43 | 121.50±11.68 | <0.001* |
| HAR | 0.990±0.028 | 0.999±0.027 | <0.001* |
*Two tail p value of unpaired t-test <0.05 was considered statistically significant
HAR: Height-to-arm span ratio
Height was equal to arm span in 189 (12.9%) children. Height was more than arm span in 538 (36.72%) children. Height was less than arm span in majority of subjects 738 (50.38%). HAR of boys and girls according to age of the subjects are shown in [Table/Fig-2].
Age wise height-to-arm span ratio in boys and girls.
| Age group in years | Boys (n=774) | Girls (n=691) | |
|---|
| Subject number | HAR (Mean±SD) | Subject number | HAR (Mean±SD) | t-test p |
|---|
| 6 | 88 | 1.0106±0.0189 | 75 | 1.0198±0.0218 | 0.004* |
| 7 | 146 | 0.9971±0.0213 | 112 | 1.0114±0.0205 | <0.001* |
| 8 | 116 | 0.9897±0.0236 | 104 | 0.9940±0.0227 | 0.17 |
| 9 | 144 | 1.0021±0.0207 | 128 | 1.0065±0.0221 | 0.09 |
| 10 | 136 | 0.9739±0.0241 | 128 | 0.9856±0.0217 | <0.001* |
| 11 | 144 | 0.9741±0.0339 | 144 | 0.9859±0.0320 | 0.002* |
*Two tail p value of unpaired t-test <0.05 was considered statistically significant
HAR: Height-to-arm span ratio; SD: standard deviation
Overall mean HAR was 0.9942±0.0279. This ratio was used to calculate expected height from the arm span data for residual analysis.
When group wise data was tested by Pearson correlation (r), all the groups showed statistically significant positive correlation between height (cm) and arm span (cm). Age group wise correlation coefficients between height and arm span is shown in [Table/Fig-3].
Pearson correlation coefficient between height (cm) and arm span (cm).
| Boys (n=774) | Girls (n=691) |
|---|
| Age (years) | Subject number | r | p | Subject number | r | p |
|---|
| 6 | 88 | 0.94 | <0.001* | 75 | 0.91 | <0.001* |
| 7 | 146 | 0.94 | <0.001* | 112 | 0.47 | <0.001* |
| 8 | 116 | 0.90 | <0.001* | 104 | 0.88 | <0.001* |
| 9 | 144 | 0.92 | <0.001* | 128 | 0.95 | <0.001* |
| 10 | 136 | 0.90 | <0.001* | 128 | 0.94 | <0.001* |
| 11 | 144 | 0.71 | <0.001* | 144 | 0.79 | <0.001* |
*Two tail p value <0.05 was considered statistically significant
r: Pearson correlation coefficient (shown up to two decimal number)
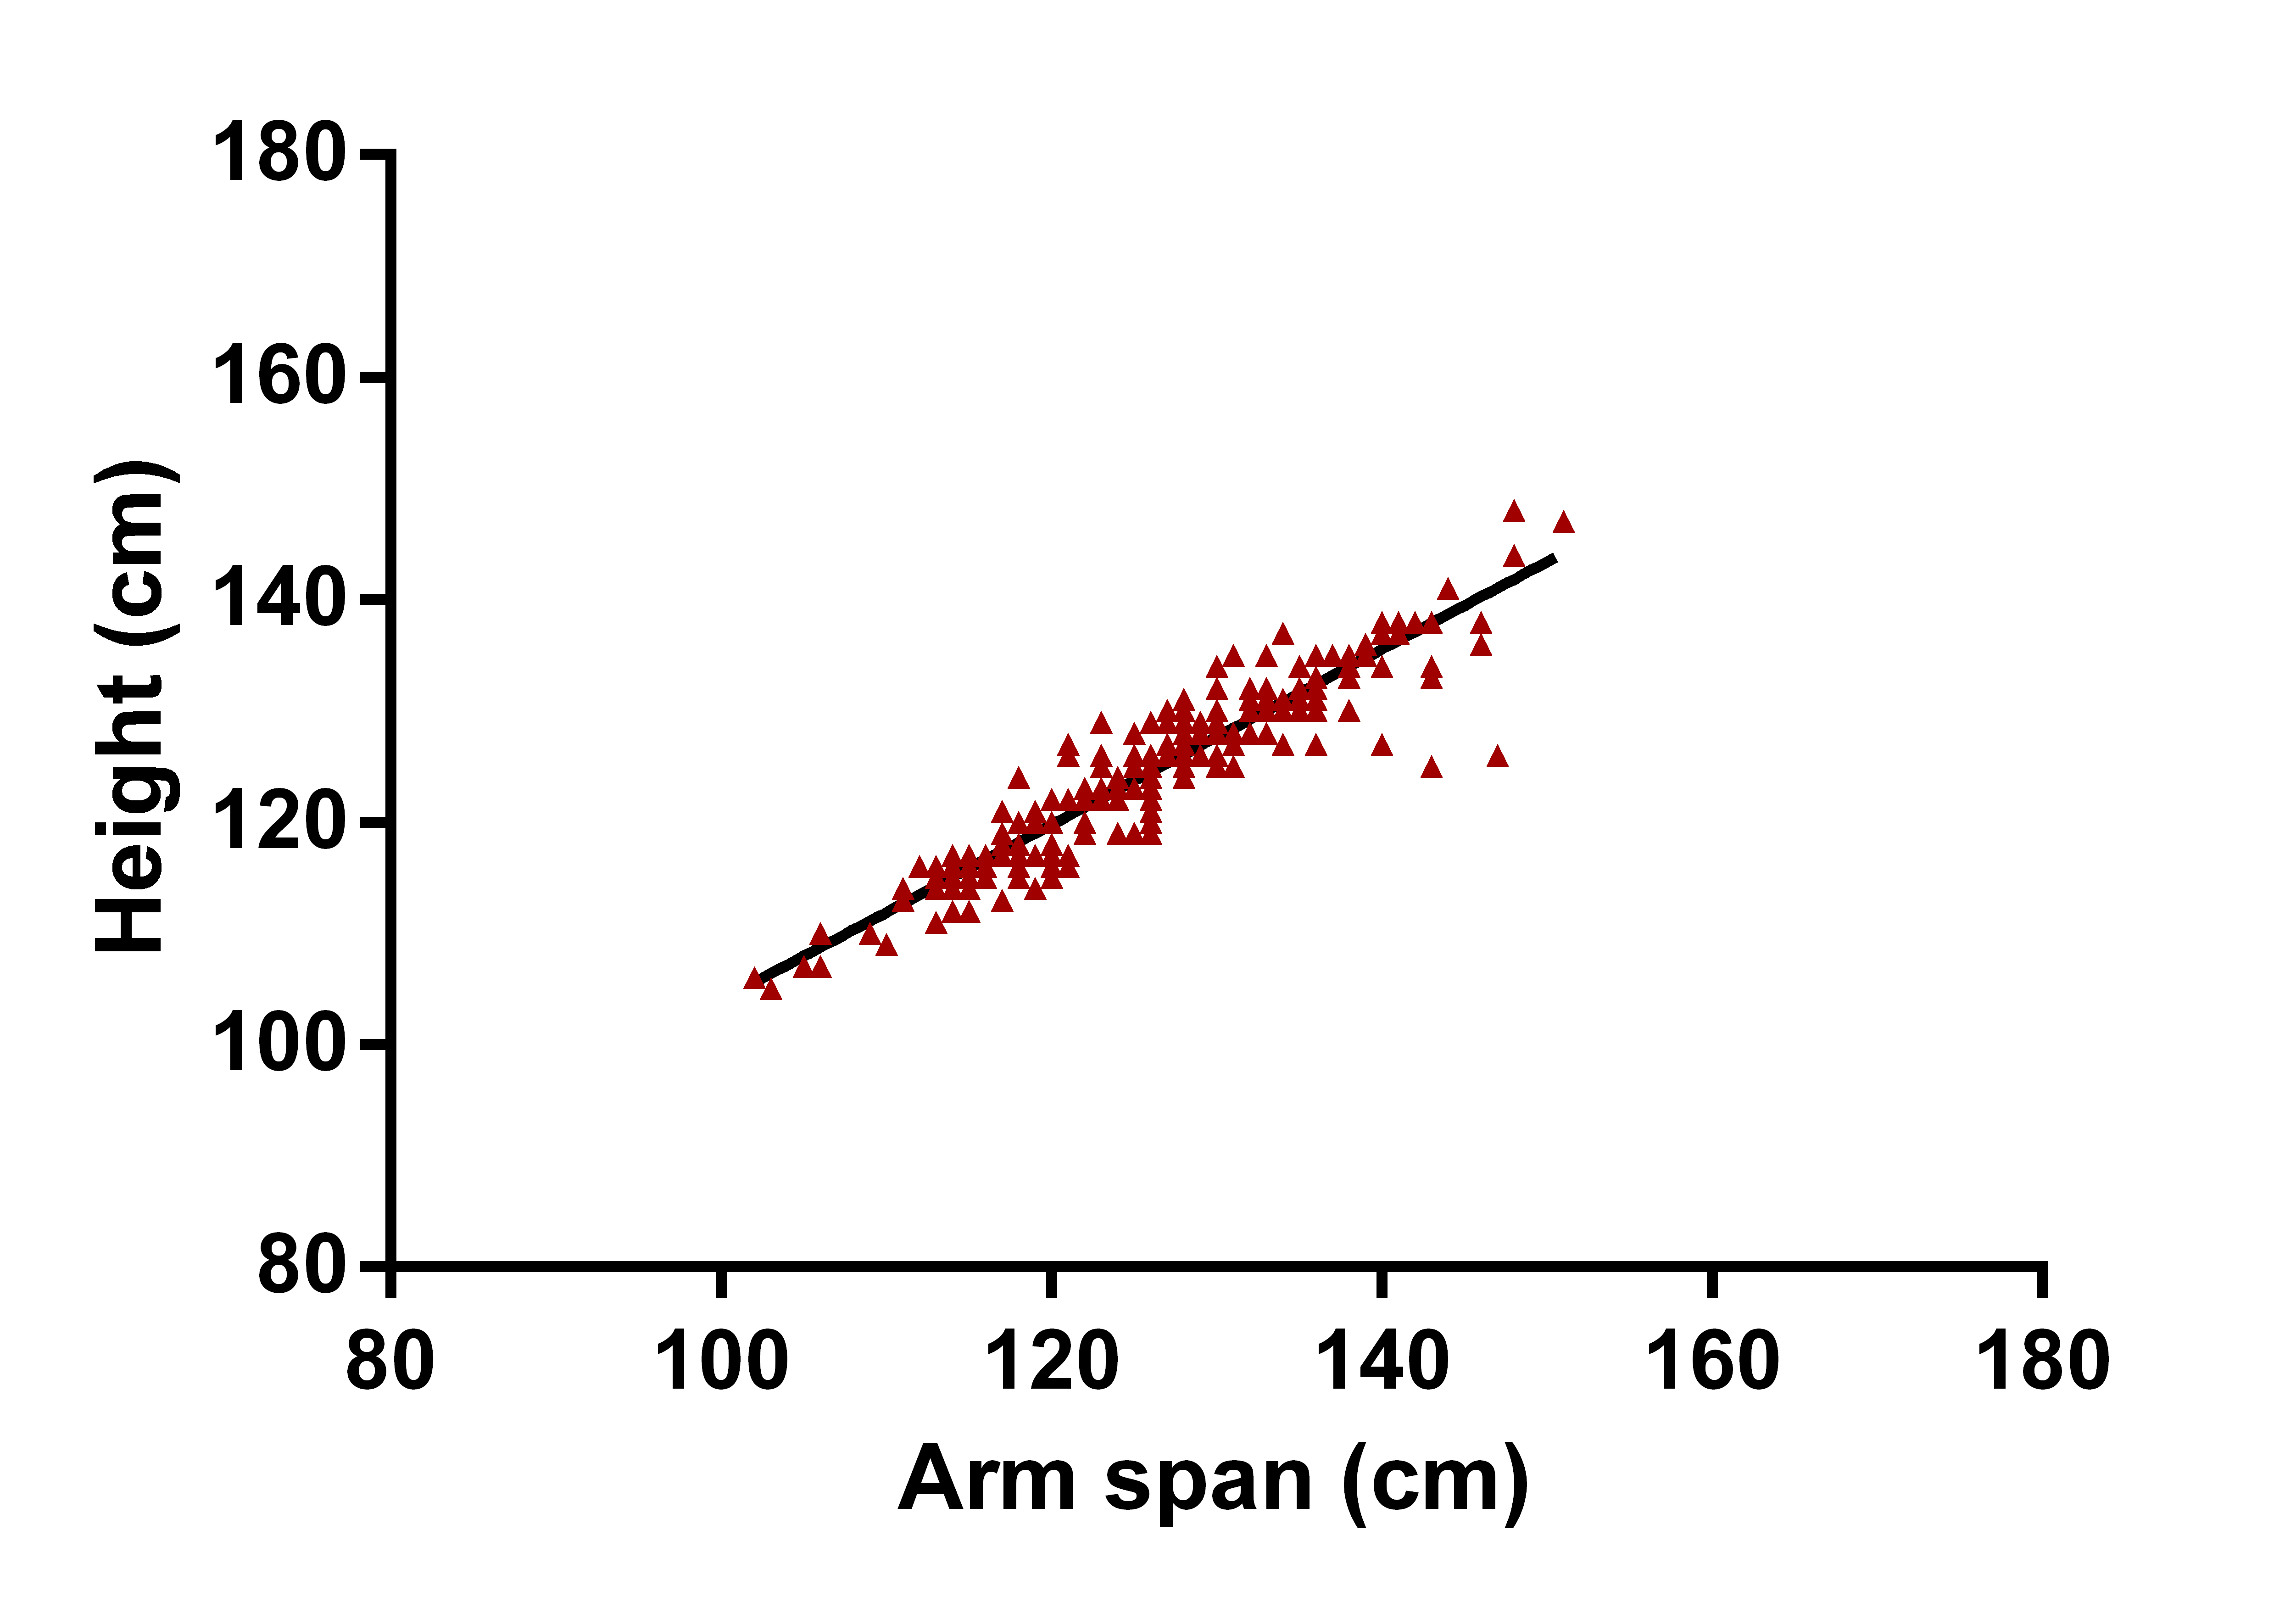
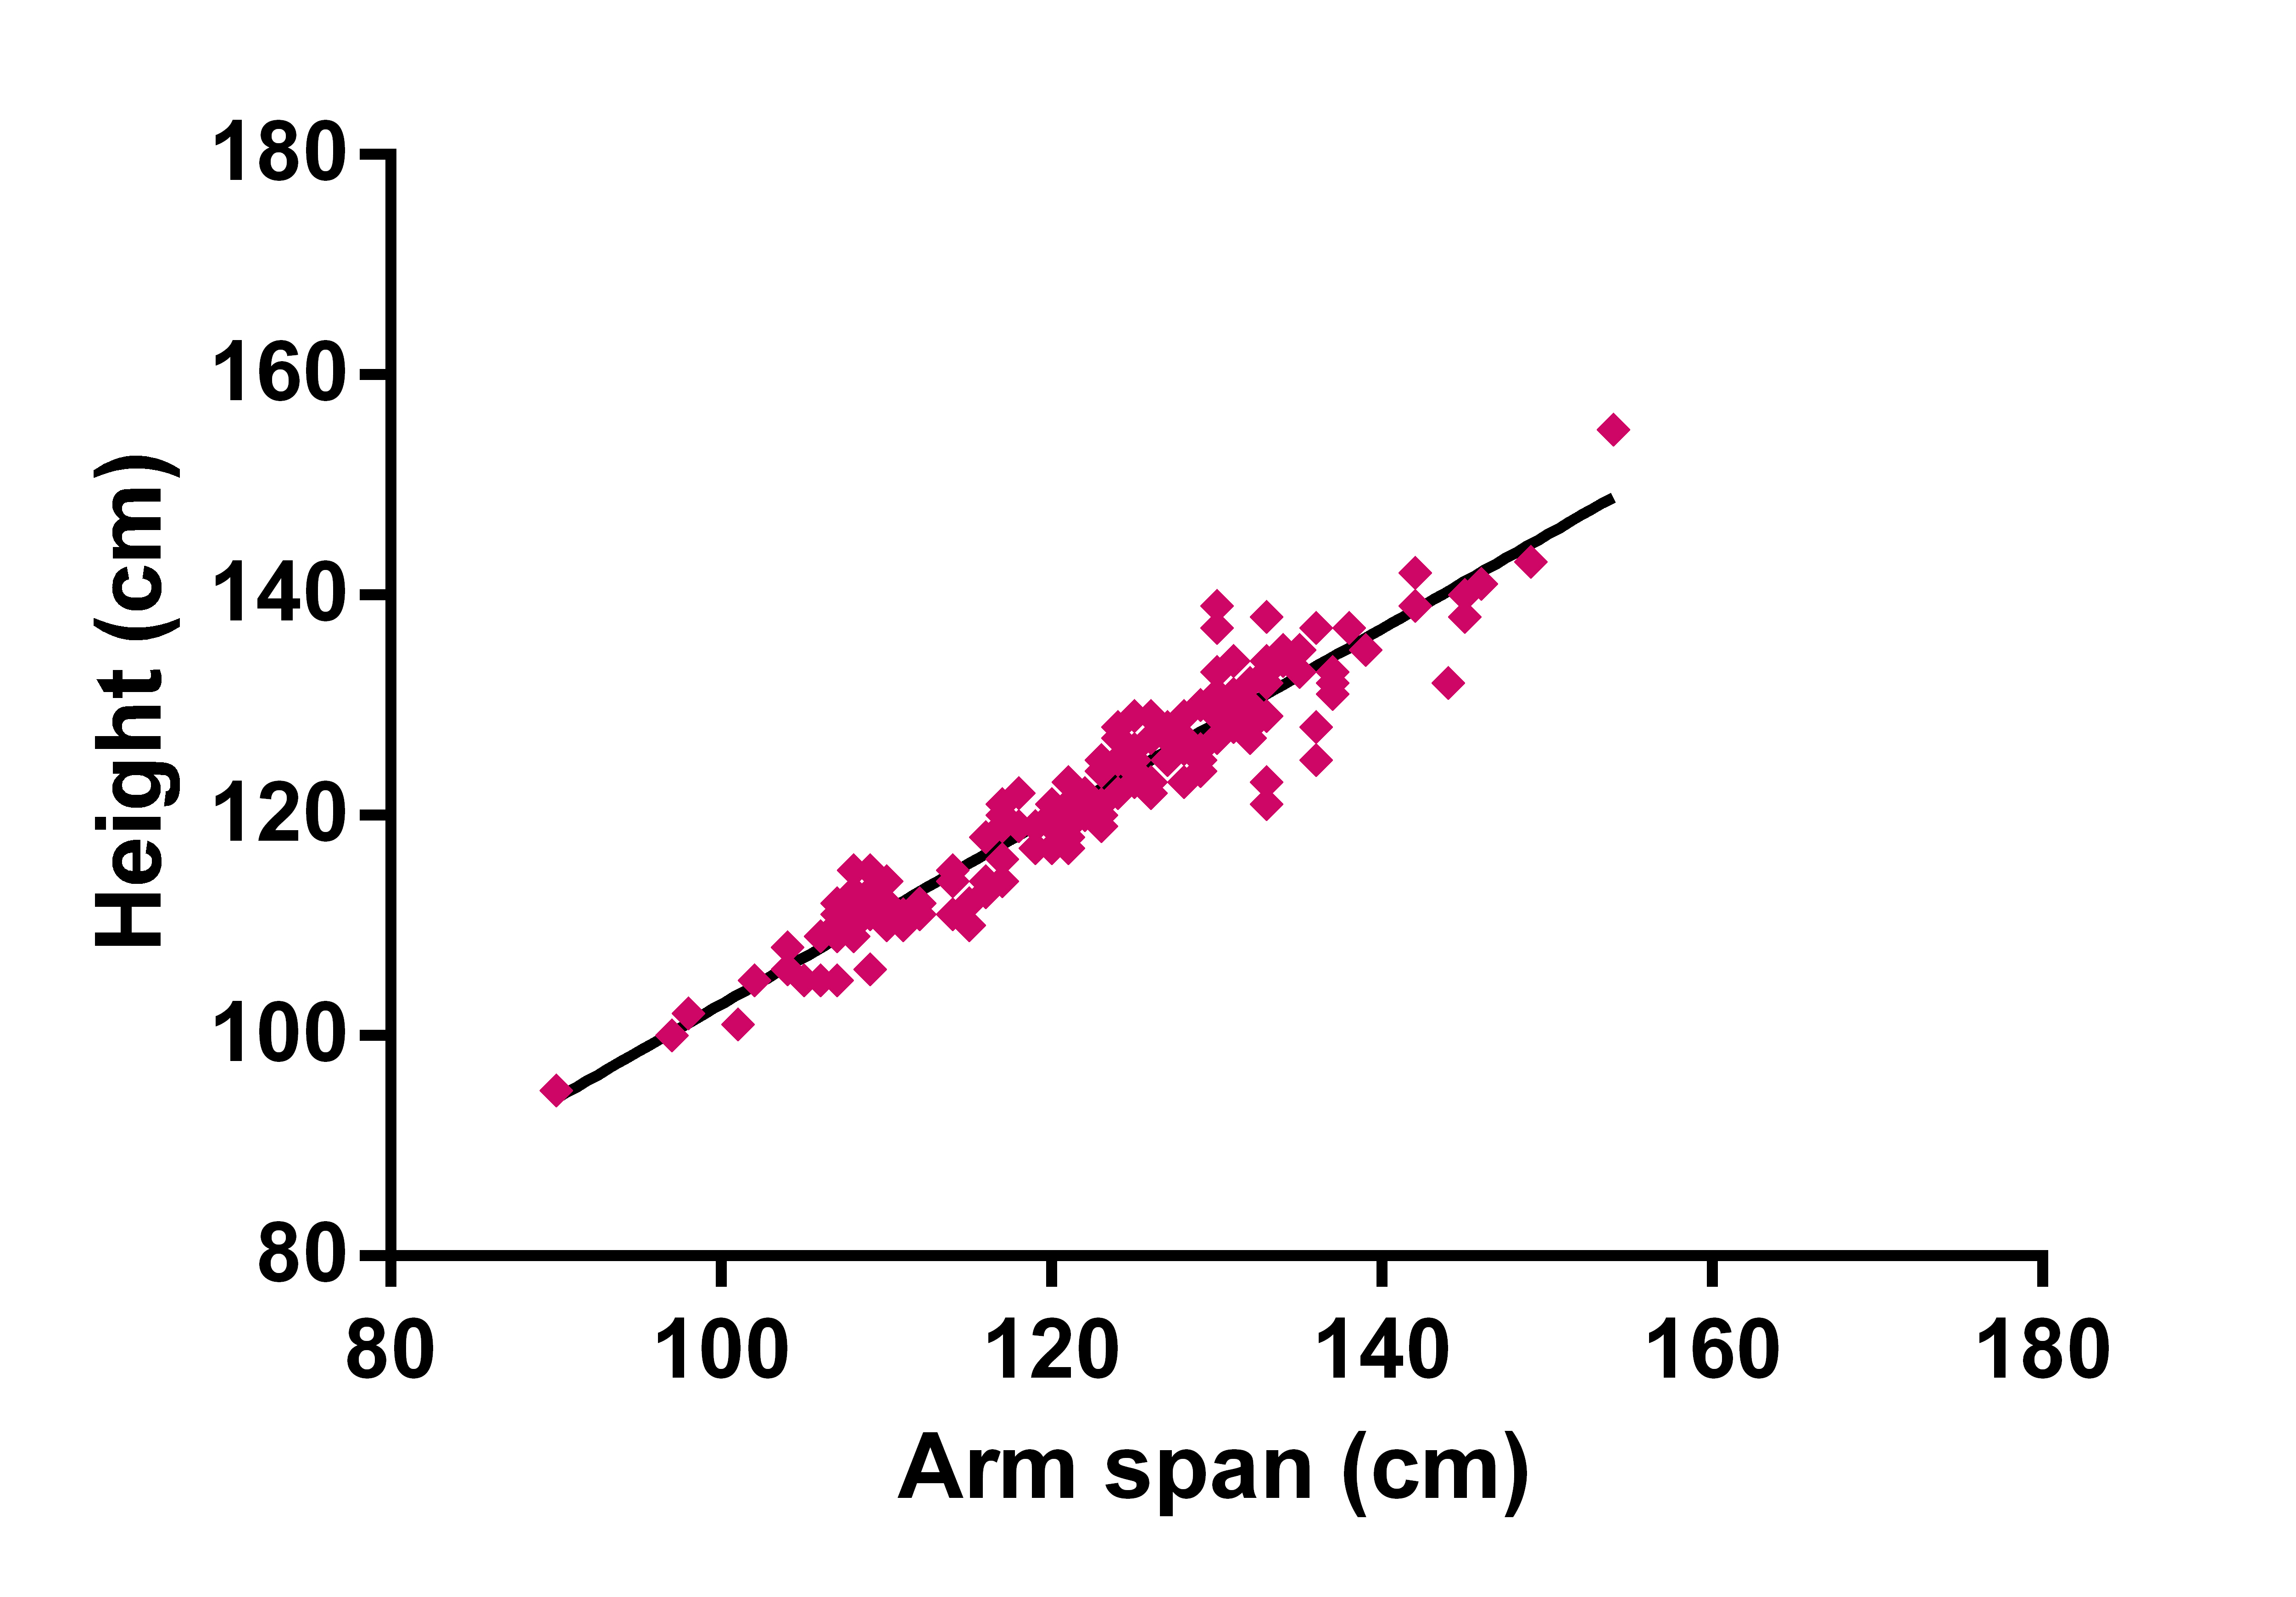
[Table/Fig-4] shows the linear regression scatter plot of height and arm span in boys. The correlation coefficient showed a strong positive correlation (r= 0.94, p<0.001). The regression equation was Y = 0.7880*X + 25.21; R2 = 0.89; SEE = 2.964. Which may be interpreted as Height (cm) = 0.788 * arm span (cm) + 25.21. [Table/Fig-5] shows the linear regression plot of height and arm span in girls. The correlation coefficient also showed a strong positive correlation, quantitatively more than boys (r= 0.96, p<0.001). The regression equation was Y = 0.8528*X+17.57; R2 =0.92; SEE = 2.903.
Linear regression scatter plot of height and arm span in boys (n=774). [Pearson correlation coefficient (r) = 0.94, R2=0.89, Equation: Y = 0.7880*X + 25.21].
Linear regression scatter plot of height and arm span in girls (n=691). [Pearson correlation coefficient (r) = 0.96, R2=0.92, Equation: Y = 0.8528*X + 17.57].
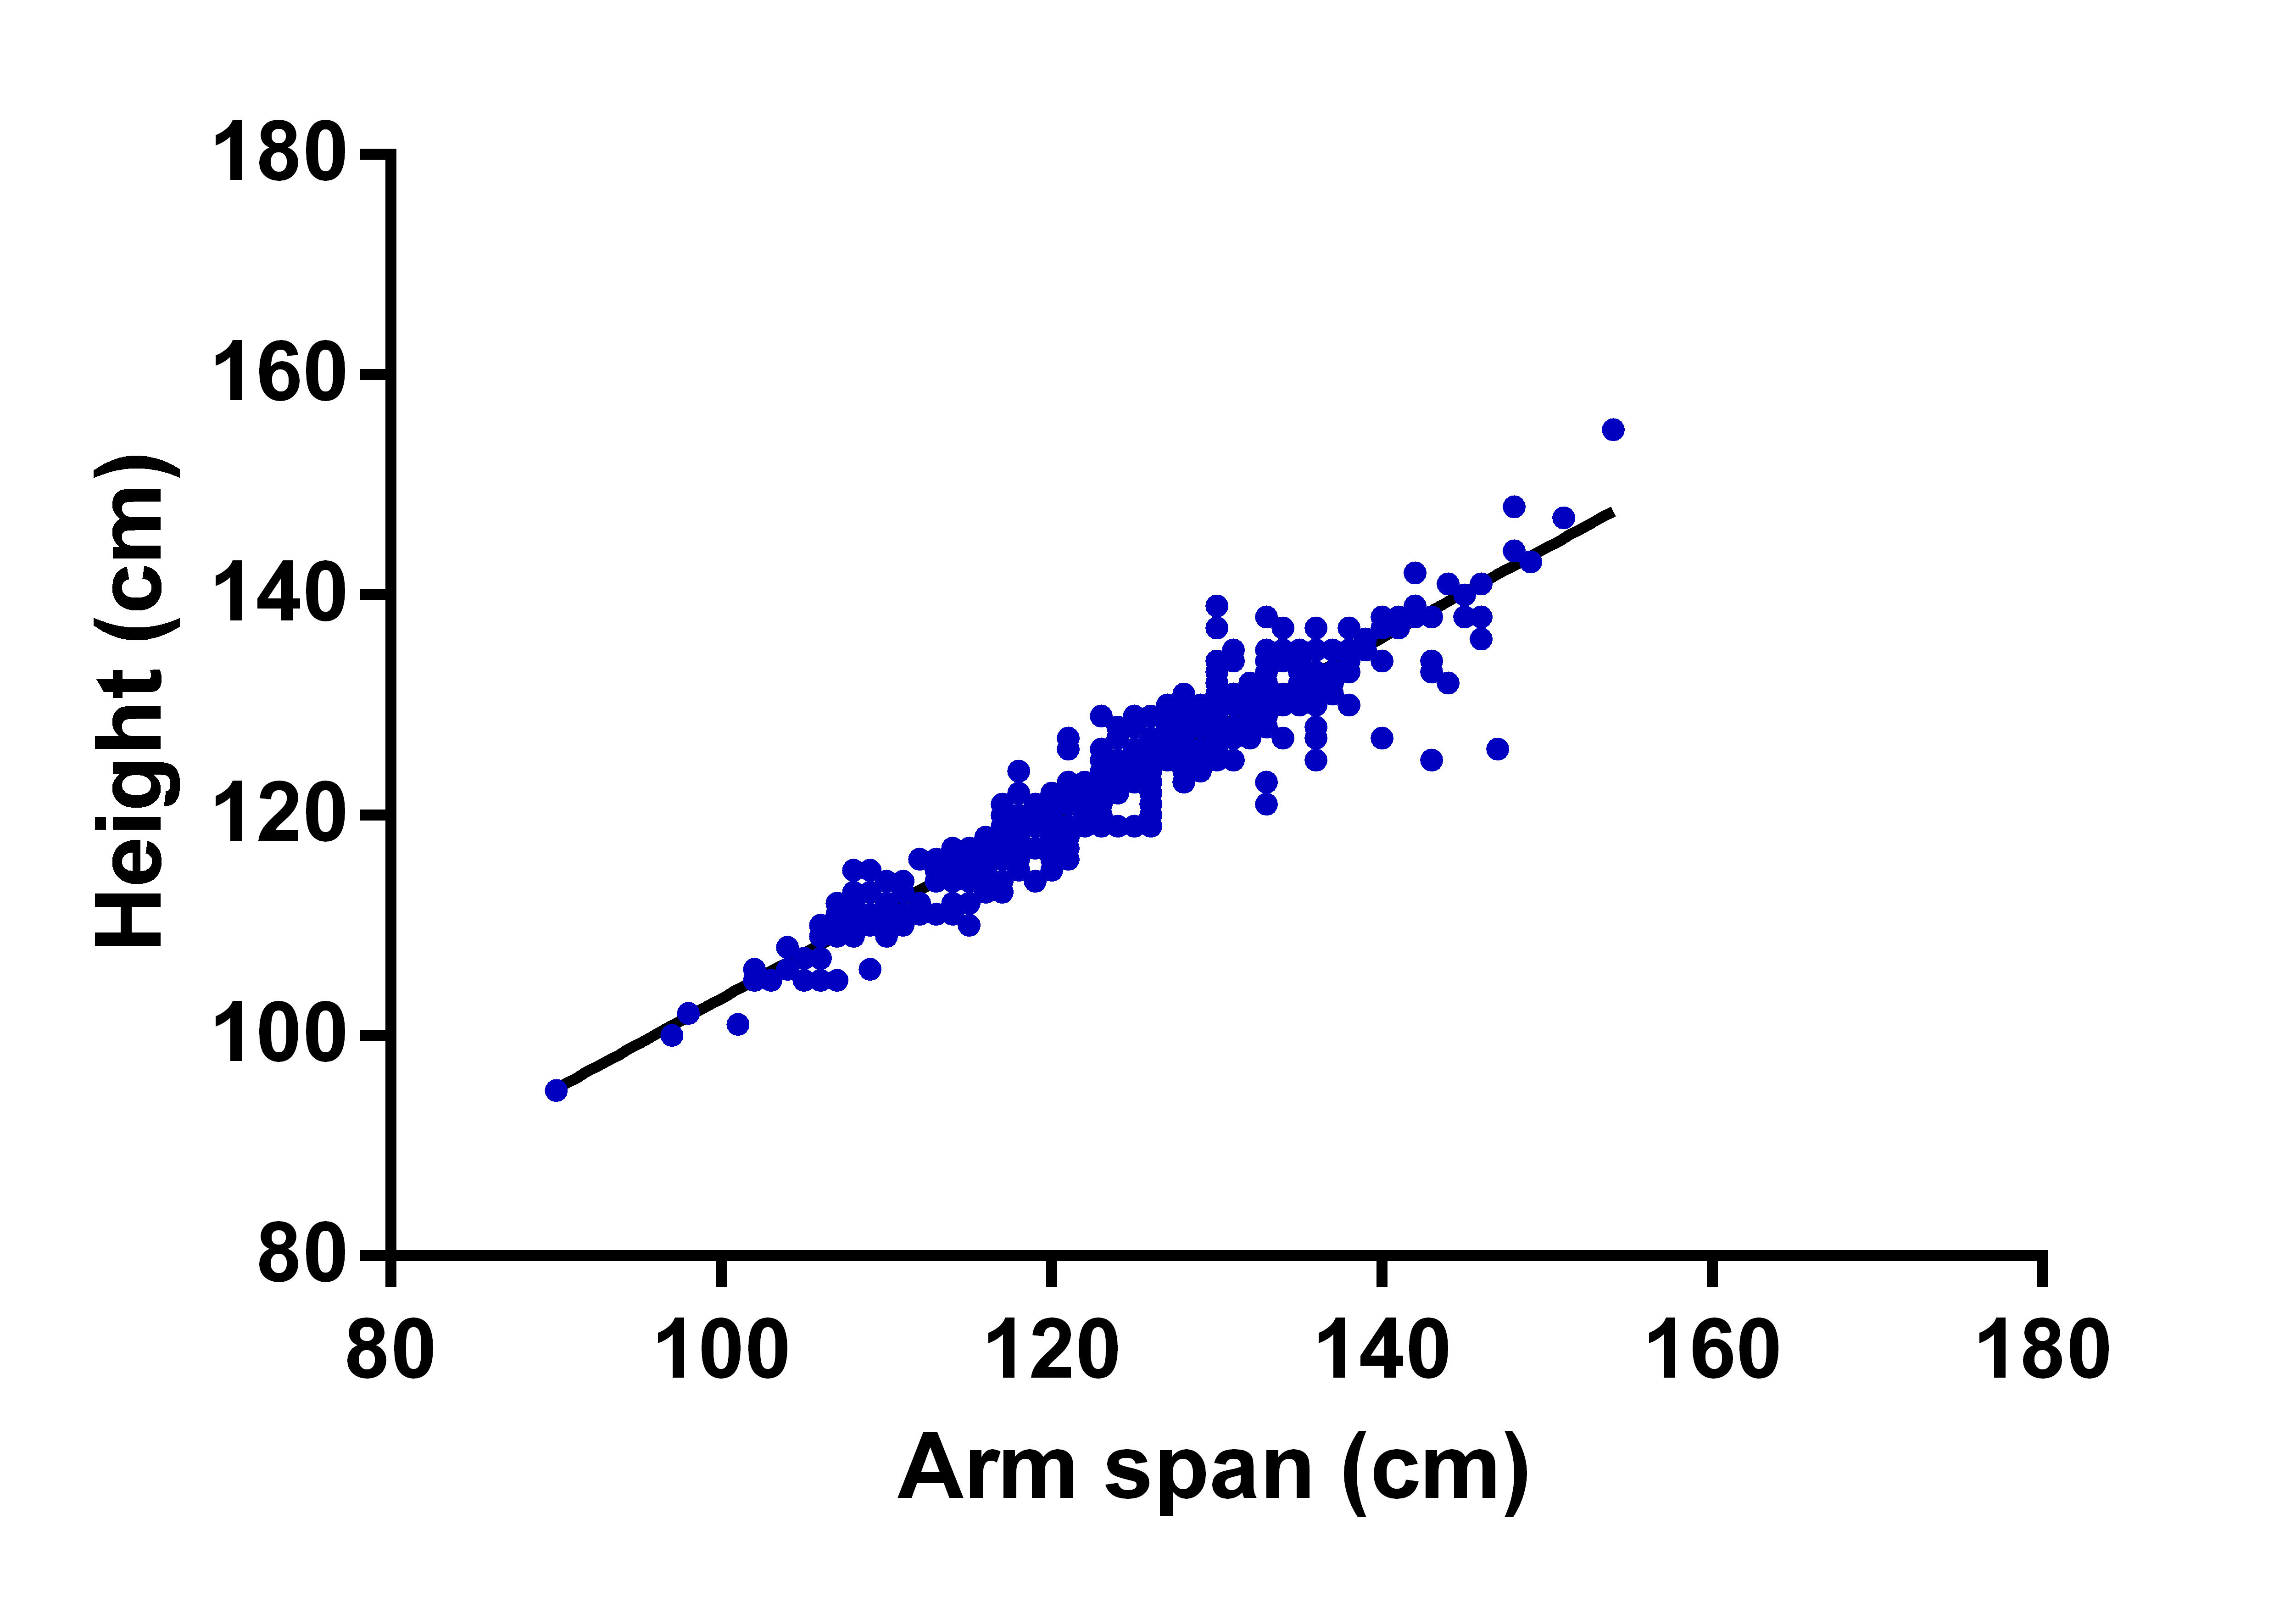
When the height and arm span data of boys and girls were taken combined, and correlation and regression analysis were carried out, it showed a positive correlation coefficient (r= 0.95, p<0.001). The regression equation was Y = 0.8192*X + 21.46; R2 = 0.91; SEE=2.961 [Table/Fig-6].
Linear regression scatter plot of height and arm span (n=1465). [Pearson correlation coefficient (r) = 0.95, R2=0.91, Equation: Y = 0.8192*X + 21.46].
This equation was used to obtain estimated height from the arm span data for residual analysis. When residual analysis was carried out between arm span and residuals calculated from regression equation (i.e., difference between actual height and estimated height from the regression equation), it showed practically a zero slope [Table/Fig-7].
Scatter plot between residuals (difference between actual and predicted height calculated from regression equation Y = 0.8192*X + 21.46) and arm spans. It showed a zero slope.
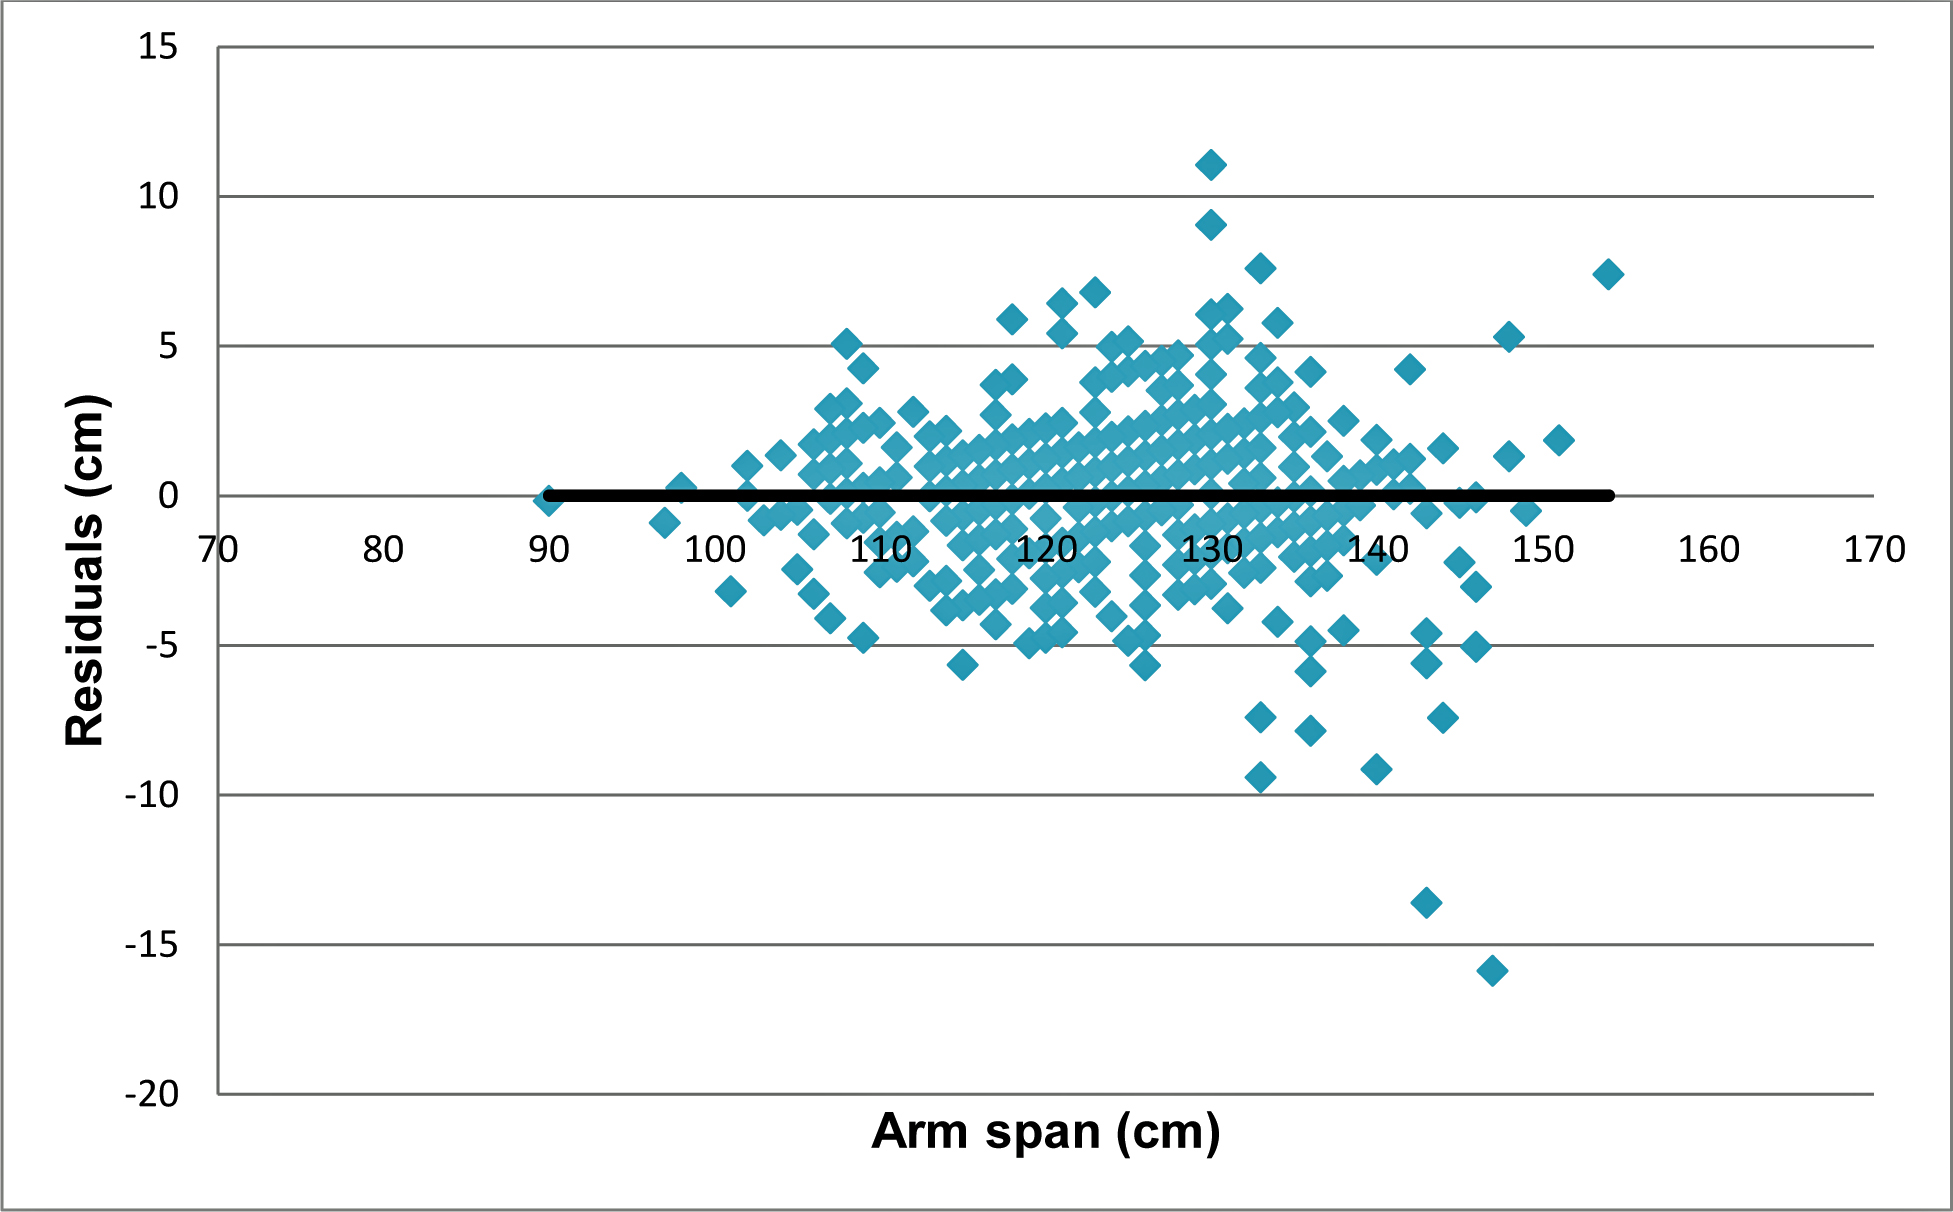
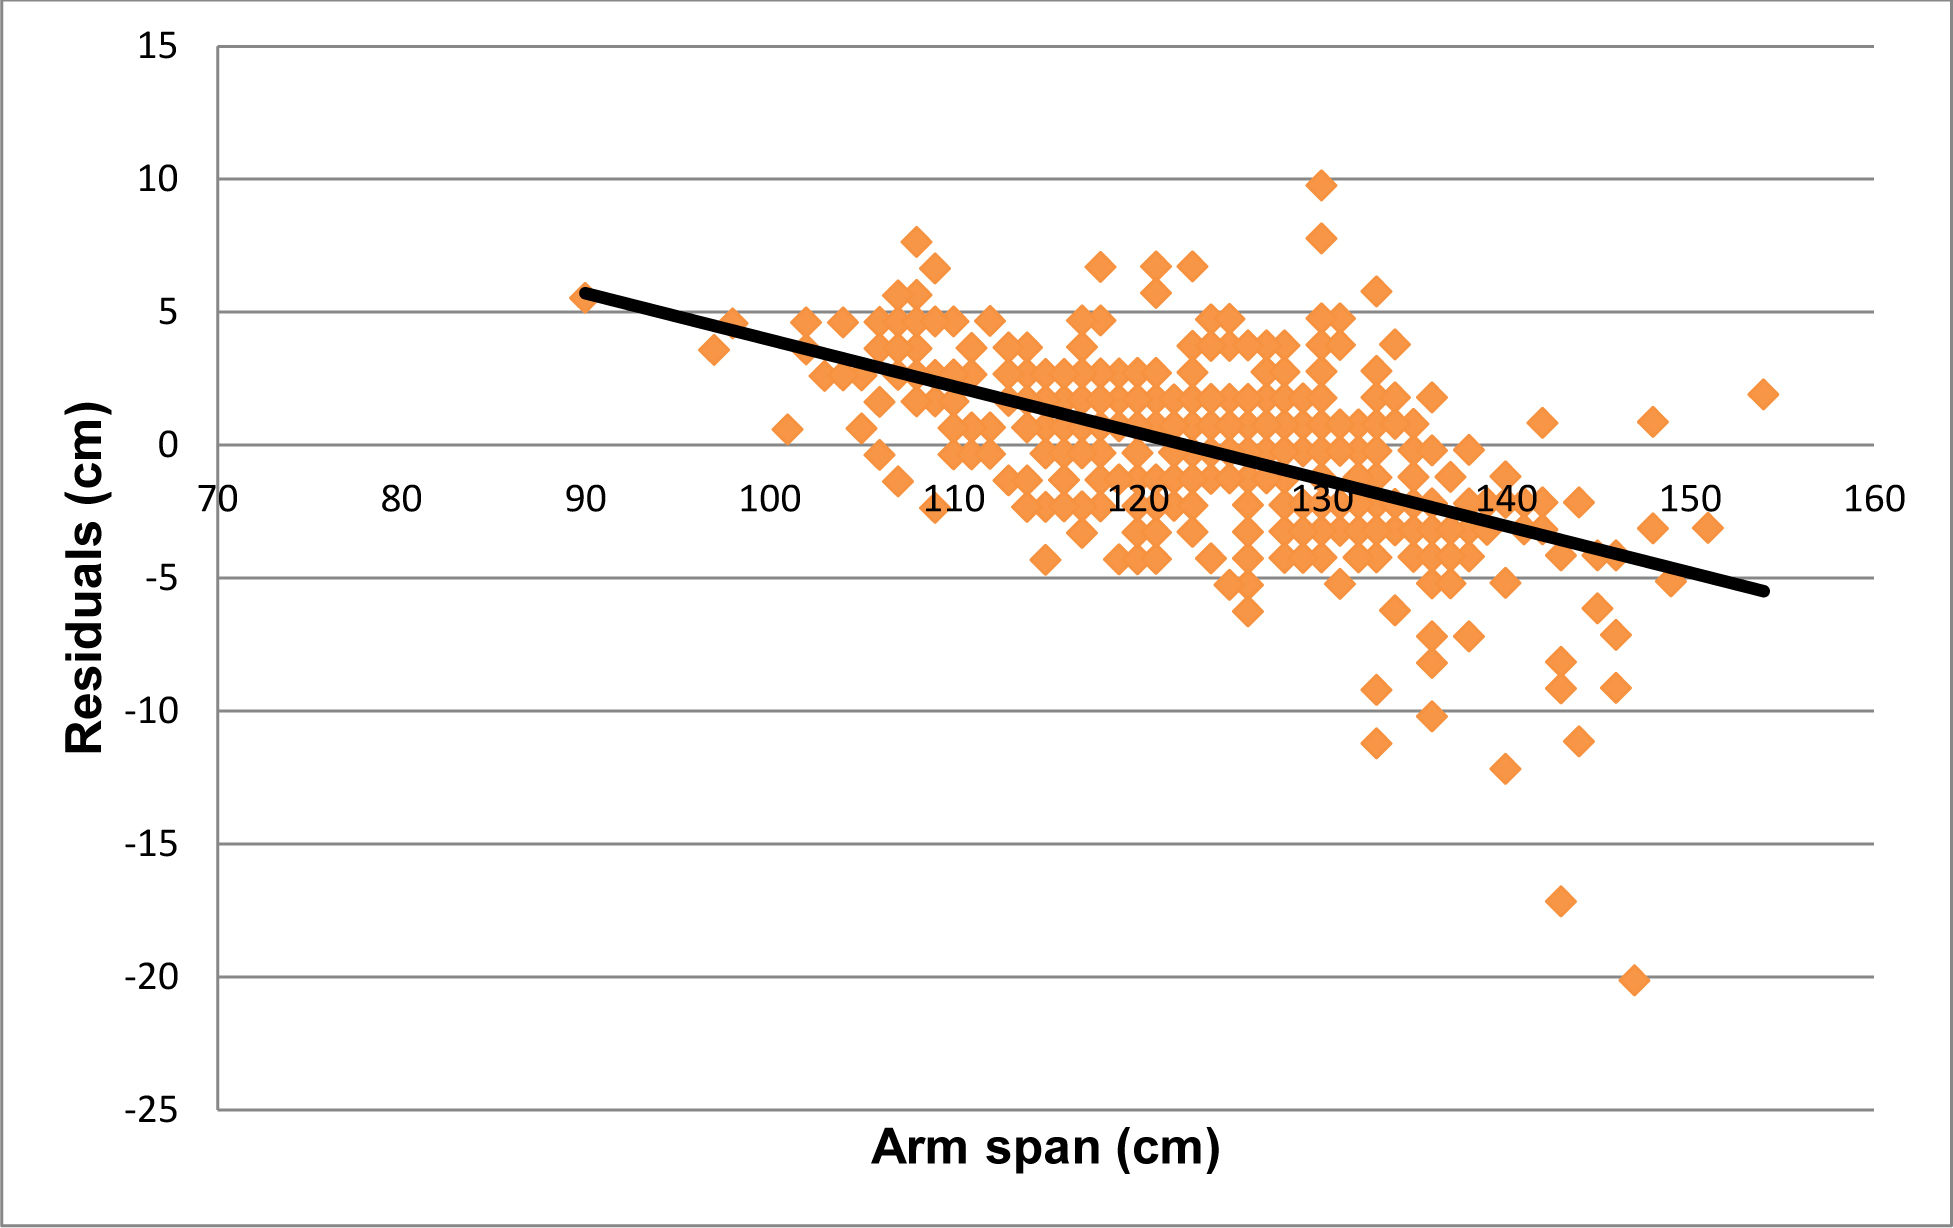
It indicates no interdependence between variables. However, residual analysis between arm span and residuals calculated by HAR showed a slope of -0.175 [Table/Fig-8].
The scatter plot between residuals (difference between actual and predicted height calculated from HAR=0.9942) and arm spans. It showed a slope of -0.175.
Discussion
Result of this study showed that in majority (50.38%) of study subjects, arm span was more than the height as well as mean arm span in children was more than height [Table/Fig-1]. This supports the finding of the study by Dorjee B and Sen J in West Bengal state, India [14]; Esomonu UG et al., in Nigeria [11], Forman MR et al., in United States [12]. However, Monyeki KD et al., reported that arm span is less than standing height in 8-18 years subjects in South Africa [13]. In contrast, adult population from India showed that arm span is more than height [6,19-21]. Underlying reason of discordant result from South Africa may be ethnical difference as well as the sample itself. In our study, 36.72% subjects had height more than arm span.
Correlation between height and arm span showed a strong positive correlation (r=0.95, p<0.001). This result is another support to the widely accepted positive correlation between height and arm span in children, adolescent, and in adults. Dorjee B and Sen J found more strong correlation (male r=0.978, female r=0.972) than the result of this study [14]. However, they took a smaller sample (n=240) while this study was conducted out on a larger sample size (n=1465). Difference between sample size and sample age range may be the contributing factors behind the difference in the results.
Regression equations were established for boys and girls separately. Overall regression equation was Y = 0.8192*X + 21.46. This equation was used to estimate height from arm span data and compared with the actual height. Residual analysis graph indicated factually zero slope of trend line [Table/Fig-7]. However, when we estimated height from the HAR, the residual analysis had detectable slope [Table/Fig-8]. Hence, regression equation provides better estimation of height from arm span when compared to estimation of height from HAR.
Complex interaction of growth factors and hormones (e.g., growth hormone, androgen, oestrogen) are responsible for linear bone growth in children and adolescents. Higher level of estradiol concentration in girls contributes for pubertal growth spurt. Boys show no pubertal growth spurt due to oestrogen resistance which leads to delay in epiphyseal fusion [22]. Arm span increases more than height in girls until 15 years and until 25 years in boys. In the present study, sample was taken from age group below 15 years while the subjects were in a phase of growth both in arm and height. Study by Quanjer PH et al., on multi ethnic subjects of wide range of age in both sexes showed that the ratio between arm span and height is different according to age, sex and ethnicity [23]. Hence, considering the physiology of growth and the study by Quanjer PH et al., the regression equation established from this study should be considered different from that obtained by studies carried out on adult population in India and abroad. In addition, these regression equations may not be appropriate for the children of same age group of different ethnicity. However, the difference in height-to-arm span ratio in different ethnic groups was beyond the scope of this study.
Regression equation for estimation of height from other anthropometric parameters is available for adult population. Tandon R et al., found that foot length can be used to estimate height in adult population from the established regression equation in their study [24]. Mondal MK et al., established regression equation for estimation of height from ulnar length in adult population [25]. However, these studies were carried out on adult population. Another study by Chowdavarapu RR et al., showed that head length can be used to estimate height in 8-12 years children [26]. Bardale RV et al., and Sen J et al., showed that height can be estimated from index and ring fingers also in adult population [27,28]. However, appropriate measurement of smaller segments of the body (e.g., finger length, foot length, head length) requires calipers and intraobserver and interobserver variation may give a proportionate error in height estimation. Precise measurement of ulnar length also needs anthropometer [29], whereas, arm span can be measured with simple measuring tape. Arm span is almost similar to stature in length; hence, chances of error in estimation would be less for estimated height from arm span.
To best of our knowledge, currently two studies and respective regression equations are available for Indian children for estimation of height from arm span. Established regression equation from those studies, age group of sample is shown in [Table/Fig-9]. Result of this study is an addition to Indian literature for estimation of height from arm span in children in 6-11 years age. One of the common difficulties faced by occupational therapist or paediatricians is height measurement in children with cerebral palsy as these children may not stand properly due to presence of joint contracture, muscular weakness, scoliosis etc., [30]. Disproportionate growth, skeletal dysplasia, spine deformities after surgical procedure are other cases where arm span can be used to estimate height of the children. In archeological and medicolegal cases, height is important parameter. If the age of the skeleton can be estimated from other evidences, height can be estimated from regression equation available for that age group. Hence, results of these studies can be utilized by medical professionals including occupational therapist, pediatricians, nutritionist, anthropologist and forensic experts.
Published studies to predict height from arm span in Indian children.
| Article | Sample | Regression equation |
|---|
| Yousafzai et al. (2003) [5] | Boys = 83; Girls = 79Age range: 2-6 years | Overall: Height = 6.4 + 0.93 * Arm span; R2 = 0.93; SEE = 3.2 |
| Dorjee and Sen (2016) [14] | Boys = 116; Girls = 124Age range: 3-11 years | Boys: Height = 8.758 + 0.929 * Arm span; R2 = 0.96; SEE = 2.532Girls: Height = 8.882 + 0.932 * Arm span; R2 = 0.95; SEE = 2.809Overall: Height = 9.082 + 0.928 * Arm span; R2 = 0.95; SEE = 2.681 |
| Mishra et al. (2017) – Present study | Boys = 774; Girls = 691Age range: 6-11 years | Boys: Height = 0.7880 * Arm span + 25.21; R2 = 0.89; SEE = 2.964Girls: Height = 0.8528 * Arm span + 17.57; R2 = 0.92; SEE = 2.903Overall: Height = 0.8192 * Arm span + 21.46; R2 = 0.91; SEE = 2.961 |
Limitation
Convenience sampling from a single city in a district of a state was carried out among children of 6-11 years. The sample may not represent all children in that age group residing in the state of Odisha. Further studies involving large sample size from multiple districts may provide generalized result for this state. Hence, the data and result should be interpreted with caution.
Conclusion
Standing height is positively correlated with arm span in children of 6-11 years age. Height can be estimated from measured arm span using regression equations. Using regression equation for estimation of height is more acceptable than estimation of height from fixed HAR. Data of this study and regression equations for children in Berhampur city, Odisha, India, may be considered in clinical practice and in medicolegal cases for estimation of height from arm span in 6-11 years children.
*Two tail p value of unpaired t-test <0.05 was considered statistically significant
HAR: Height-to-arm span ratio
*Two tail p value of unpaired t-test <0.05 was considered statistically significant
HAR: Height-to-arm span ratio; SD: standard deviation
*Two tail p value <0.05 was considered statistically significant
r: Pearson correlation coefficient (shown up to two decimal number)