India is presently facing an epidemic of diabetes mellitus with upto 62 million people diagnosed with the disease, apart from predictions of this number reaching 79.4 million by the year 2030 [1]. The increase in prevalence has been rapid in the urban areas and also has been found to increase from 2% to 12% in a span of 3 decades [2]. As per the ICMR-INDIAB phase I final report, the prevalence of diabetes mellitus in India ranges from 10.9% to 14.2% in urban areas and 3% to 8.3% in rural areas [3]. The risks of chronic complications like retinopathy are associated with the duration of the disease as well as the degree of hyperglycaemia in the individual [4]. The microvascular complications of long standing diabetes mellitus are known to cause Retinopathy [4].
Apolipoproteins are the protein component of lipoproteins. Apo A-I is present in High Density Lipoprotein (HDL), playing an important part in the transfer of cholesterol in the circulation from the periphery to the liver. Apo B-100 is the principal apolipoprotein present in the circulation in the fasting state and is responsible for the clearing of the Low Density Lipoprotein (LDL) from the circulation. Glycated haemoglobin is the non-enzymatic addition of glucose to the N-terminal valine of the β chain of the haemoglobin molecule and is commonly known as HbA1c [4].
Diabetic retinopathy is the most common cause of loss of vision in the western countries [4]. Diabetic retinopathy correlates very well with the duration of the disease and it has been seen that 60% of Type II and all most all patients of Type I have some degree of retinopathy after 20 years [4].
The ICMR-INDIAB study has provided data regarding total cholesterol and triglycerides values in diabetic patients from different areas in the country. The value of total cholesterol was the least in Jharkhand at 158±40mg/dl and triglyceride was 118mg/dl in Maharashtra (both urban values) [3]. Similar results of Apo A-I and B-100 are not available and this study was attempted to establish any association if so found.
Materials and Methods
The study is an observational study and was undertaken in a tertiary care super specialty service hospital, Command Hospital (Eastern Command) Kolkata. The target population is derived from Eastern states of India as the hospital caters to the service personnel from these areas. The samples were collected from the period of 10 March 2014 to 31 April 2015 from the patients attending the ophthalmology OPD. The study design was approved by the Institutional Ethical Committee. The study sample was from all patients attending the Eye OPD of the hospital who had diabetic retinopathy. Cases of both Type I & type II diabetes mellitus were included. In our study, the cases of diabetes had the disease of varying durations ranging from a couple of months to more than 20 years. The age of the cases varied from 37-83 years. Of the 135 cases, 55% (n=74) were males and 45% (n=61) were females. Only a few cases were of less than one year duration (n=05) while all the rest had the disease since many years. Recruitment of the cases was done by using the exclusion criteria patients on lipid lowering medications/glitazones, female patients on Oral Contraceptive Pills (OCP) or Hormone Replacement Therapy (HRT), hypothyroid cases, familial hypercholesterolaemia, Chronic Kidney Disease (CKD), chronic liver disease, pregnant females and known cases of haemoglobinopathies. A total of 228 patients were initially identified and 135 of them were selected on the basis of the exclusion criteria. Informed written consent was taken from the individual patients.
The sample size was based on Creative Research System Survey Software with a confidence level of 95%. The data was maintained by the principal investigator with the clinical component filled up in the OPD when the patients were evaluated for their diabetic retinopathy status. Fasting blood samples for serum (lipid profile & apolipoproteins) and plasma with sodium Ethylene Diamine Tetraacetic Acid (EDTA) as anticoagulant samples for HbA1c estimation were collected. Following fundoscopic examination, the patients were classified as per International Clinical Diabetic Retinopathy Disease Severity Scale [5], which is based on the Early Treatment Diabetic Retinopathy Study (ETDRS) classification as NPDR and PDR. The patients in the NPDR category were further sub-classified as mild, moderate and severe. Apart from these cases, diabetic with no retinopathy patients were also selected. A total of 100 healthy controls (age and sex matched) were selected from patients attending the daily OPD who did not have diabetes mellitus or CKD and had reported to the hospital for routine annual examination.
In total, there were 100 controls and 135 cases. Of these, 35 were cases of PDR, 75 cases of NPDR (25 cases each of mild, moderate and severe types) and 25 cases of diabetes with no retinopathy.
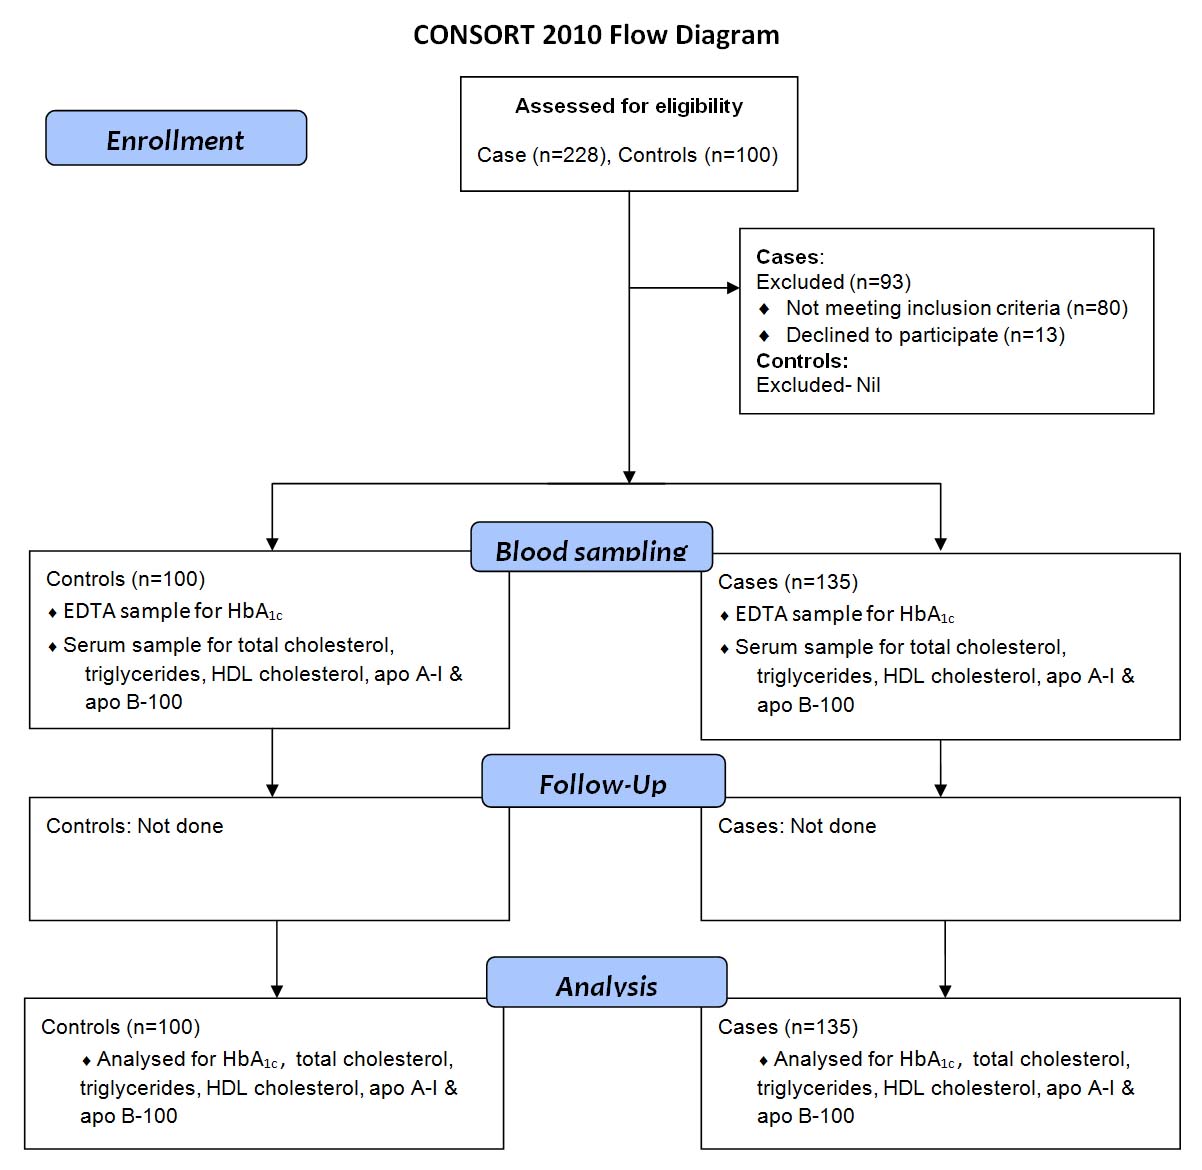
For the purpose of data analysis, the patients were classified into groups (G1-G6) in the following manner: controls (G1), diabetic without retinopathy (G2), mild NPDR (G3), moderate NPDR (G4), severe NPDR (G5), PDR (G6). A flow diagram for the step wise analysis is given in [Table/Fig-1].
Flow diagram for the step wise analysis.
Sample Collection and analysis: Blood samples in fasting condition were collected from all the cases and the controls. A 2ml of blood was collected for HbA1c estimation in EDTA sample and 4 ml of blood was collected for serum estimations in sterile gel vaccutainers. The serum was used for total cholesterol, triglyceride, HDL cholesterol, apo A-I and B-100 estimations whereas, EDTA plasma sample was taken for HbA1c estimation. The serum samples were separated and stored at -200°c and processed in batches for both lipid profile and apo A-I & B-100 levels. The HbA1c samples were processed on the same day.
The tests for total cholesterol were done by enzymatic method using cholesterol oxidase, triglycerides using enzymatic method of lipase and glycerophosphate oxidase, direct HDL by precipitation methods and LDL using selective precipitation was done on Fully Automated Biochemistry Analyser ILAB (INSTRUMENTATION LABORATORY) [6]. The serum apo-I & B-100 were estimated by nephelometry on Binding Site by Minineph Plus. The HbA1c estimation was done by direct enzymatic method of DIAZYME on the ILAB analyser by fructosyl valine oxidase method [7].
Statistical Analysis was performed using SPSS software. Data was expressed as mean and standard deviation. A p-value <0.05 was considered statistically significant. Logistic regression models were used to estimate the Odds Ratio (OR) and 95% Confidence Interval (CI) for the association between variables and the status of retinopathy in the patients.
Results
The mean values of Apo A-I were found to be lowest in the diabetes without retinopathy group (G2) at 88 mg/dl and the highest in severe NPDR (G5) at 167 mg/dL. The mean values of Apo B-100 were found to be lowest in the non diabetic control group (G1) at 63 mg/dL and the highest in severe NPDR (G5) 114 mg/dL.
The mean concentration of HbA1c was found to range from 5.58% non diabetic (G1) to 8.82% in mild NPDR (G3). HDL cholesterol mean was found to range from 36.64 mg/dl in moderate NPDR (G4) to 42.45 mg/dl in diabetic without retinopathy (G2). The mean concentration of total cholesterol (TCOL) varied from 172.49mg/dl in control group (G1) to 280.88mg/dl in severe NPDR (G5). Triglyceride mean was found to vary from 132.28 mg/dl in NPDR mild group (G3) to 286.4mg/dl in severe NPDR group (G5) [Table/Fig-2]. LDL cholesterol was found to vary from 95.32 mg/dl in diabetics without retinopathy (G2) to 116.20 mg/dl in severe NPDR group.
Statistical results of the study parameters.
| N | Mean | SD | Std. Error | 95% Confidence Interval for Mean | Min | Max |
|---|
| Lower Bound | Upper Bound |
|---|
| HbA1c | Control[G1] | 100 | 5.58 | .19 | .033 | 5.51 | 5.64 | 5.10 | 5.90 |
| DWR[G2] | 35 | 7.02 | 1.56 | .263 | 6.48 | 7.55 | 3.80 | 11.50 |
| NPDR Mild[G3] | 25 | 8.82 | 1.64 | .329 | 8.14 | 9.50 | 5.60 | 11.20 |
| NPDR Moderate [G4] | 25 | 6.34 | .89 | .178 | 6.00 | 6.74 | 4.90 | 9.80 |
| NPDR Severe[G5] | 25 | 7.85 | .97 | .195 | 7.44 | 8.25 | 5.20 | 11.10 |
| PDR[G6] | 35 | 7.00 | 1.15 | .195 | 6.60 | 7.40 | 4.80 | 10.50 |
| ApoA | Control[G1] | 100 | 1.03 | .23 | .039 | .95 | 1.11 | .48 | 1.41 |
| DWR[G2] | 35 | .88 | .28 | .048 | .79 | .96 | .50 | 1.70 |
| NPDR Mild[G3] | 25 | 1.47 | .12 | .025 | 1.42 | 1.53 | 1.30 | 1.74 |
| NPDR Moderate [G4] | 25 | 1.23 | .21 | .043 | 1.14 | 1.33 | .67 | 1.50 |
| NPDR Severe[G5] | 25 | 1.67 | .17 | .035 | 1.59 | 1.74 | 1.40 | 1.90 |
| PDR[G6] | 35 | 1.21 | .34 | .058 | 1.1 | 1.34 | .31 | 1.80 |
| ApoB | Control[G1] | 100 | .63 | .21 | .036 | .56 | .71 | .38 | .97 |
| DWR[G2] | 35 | 0.89 | .28 | .048 | .78 | .98 | .5 | 1.7 |
| NPDR Mild[G3] | 25 | .84 | .08 | .017 | .81 | .88 | .70 | 1.10 |
| NPDR Moderate [G4] | 25 | .67 | .13 | .026 | .64 | .75 | .38 | .90 |
| NPDR Severe[G5] | 25 | 1.14 | .18 | .036 | 1.06 | 1.21 | .84 | 1.70 |
| PDR[G6] | 35 | 1.13 | .43 | .073 | .98 | 1.28 | .38 | 2.10 |
| TCOL | Control[G1] | 100 | 172.49 | 41.65 | 7.04 | 158.17 | 186.79 | 113.00 | 254.00 |
| DWR[G2] | 35 | 187.94 | 39.90 | 6.74 | 174.23 | 201.65 | 115.00 | 269.00 |
| NPDR Mild[G3] | 25 | 183.80 | 30.06 | 6.01 | 171.39 | 196.20 | 103.00 | 260.00 |
| NPDR Moderate [G4] | 25 | 183.96 | 27.13 | 5.42 | 172.76 | 195.16 | 140.00 | 252.00 |
| NPDR Severe[G5] | 25 | 280.88 | 79.79 | 15.95 | 247.94 | 313.81 | 129.00 | 620.00 |
| PDR[G6] | 35 | 229.97 | 51.55 | 8.71 | 212.26 | 247.68 | 106.00 | 335.00 |
| TG | Control[G1] | 100 | 139.91 | 30.89 | 5.22 | 129.30 | 150.52 | 72.00 | 200.00 |
| DWR[G2] | 35 | 161.94 | 54.13 | 9.15 | 143.34 | 180.53 | 66.00 | 277.00 |
| NPDR Mild[G3] | 25 | 132.28 | 27.55 | 5.51 | 120.90 | 143.65 | 57.00 | 180.00 |
| NPDR Moderate [G4] | 25 | 167.72 | 28.74 | 5.74 | 155.85 | 179.58 | 90.00 | 208.00 |
| NPDR Severe[G5] | 25 | 286.40 | 64.43 | 12.88 | 259.80 | 312.99 | 75.00 | 470.00 |
| PDR[G6] | 35 | 191.11 | 50.78 | 8.58 | 173.66 | 208.56 | 72.00 | 260.00 |
| HDL | Control[G1] | 100 | 42.05 | 3.36 | .56 | 40.90 | 43.21 | 36.00 | 53.00 |
| DWR[G2] | 35 | 42.45 | 5.07 | .85 | 40.71 | 44.20 | 36.00 | 56.00 |
| NPDR Mild[G3] | 25 | 40.96 | 3.63 | .72 | 39.45 | 42.46 | 35.00 | 48.00 |
| NPDR Moderate [G4] | 25 | 36.64 | 2.48 | .49 | 35.61 | 37.66 | 33.00 | 42.00 |
| NPDR Severe[G5] | 25 | 39.76 | 3.20 | .64 | 38.43 | 41.08 | 35.00 | 46.00 |
| PDR[G6] | 35 | 41.57 | 3.38 | .57 | 40.40 | 42.73 | 34.00 | 46.00 |
| LDL | Control[G1] | 100 | 95.72 | 39.18 | 6.62 | 82.26 | 109.18 | 42.20 | 187.20 |
| DWR[G2] | 35 | 95.32 | 37.29 | 6.30 | 82.50 | 108.13 | 13.20 | 170.00 |
| NPDR Mild[G3] | 25 | 116.20 | 31.86 | 6.37 | 103.04 | 129.35 | 47.00 | 197.00 |
| NPDR Moderate [G4] | 25 | 113.77 | 23.75 | 4.75 | 103.97 | 123.58 | 83.00 | 178.00 |
| NPDR Severe[G5] | 25 | 183.84 | 69.76 | 13.95 | 155.04 | 212.63 | 74.00 | 486.00 |
| PDR[G6] | 35 | 99.845 | 38.36 | 6.48 | 86.66 | 113.02 | 2.40 | 144.40 |
*G1- Controls, G2-Diabetic without retinopathy, G3- Mild NDPR, G4- Moderate NDPR, G5- Severe NDPR, G6- PDR
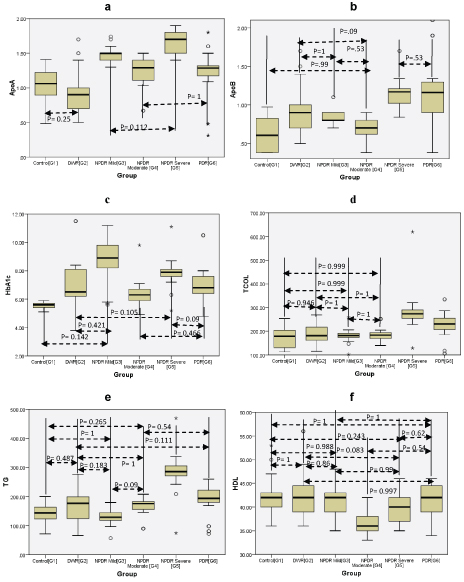
The correlation within groups was calculated and the groups where p was not significant (p<0.05) is shown in [Table/Fig-3], while it was significant in the others.
Showing p value correlation within groups. (a) Apo A-1, (b) Apo B-100, (c) HbA1C, (d) Total Cholesterol, (e) Triglycerides, (f) HDL. The p values not shown were significant (p<0.05).
Discussion
The results of the ICMR-INDIAB study (Phase-I) showed that the prevalence of diabetes mellitus was the highest in Chandigarh (both urban & rural) at 14.2% & 8.3% as compared to the other regions (Maharashtra, Jharkhand & Tamil Nadu) [3]. The public health burden of this illness has just started being felt and is likely to increase exponentially in the future.
The retinopathy associated with diabetes is due to the microvascular etiology and has been found to be mediated by the synthesis of Advanced Glycation End products (AGE), increased flux through hexosamine pathway, activation of Protein Kinase C (PKC) and increased sorbitol pathway [4,6]. Glycated haemoglobin (HbA1c) is supposed to be a reflection of the level of glycaemia in the circulation, of the previous 6 to 8 weeks [6]. The other factors that can influence the levels of HbA1c include the lifespan of red blood corpuscles, presence of haemolytic conditions and haemoglobinopathies [6].
The complications of diabetes are well known to be associated with the duration of the disease and the levels of glycaemia in the tissues concerned. In addition to the duration of diabetes, other factors like chronic hyperglycaemia, hypertension, nephropathy and dyslipidemia also increase the risk of retinopathy [8].
As per the data collected from the patients, in our study, the cases of diabetes had the disease of varying durations ranging from a couple of months to more than 20 years. The mean HbA1c in controls (G1) was 5.58% and was found to range from 5.1-5.9% as compared to the lowest found in the INDIAB study at 5.4±1.1% [3]. In diabetics without retinopathy (G2), it was found to be 7.02% as compared to the PDR group (G6) with 7.00%. This could be due to stricter glycaemic control in PDR cases. In the NPDR cases (G3, G4 & G5), the HbA1c was found to range from 6.34% to 8.82%with the highest values seen in mild cases of NPDR (G3) HbA1c of 8.82%. It has been established that proper glycaemic control has a distinct role in the prevention of retinopathy [9-12]. Semeraro F et al., and Kohner EM et al., have shown that stricter glycaemic control at HbA1c <7% reduces the risk of retinopathy in both type 1 & 2 diabetes mellitus [13,14]. The glycaemic threshold to prevent the onset and diagnosis of microvascular complications in diabetes as per the Kumamoto study was found to be HbA1c values ≥ 6.5% [15]. In the present study, the HbA1c was highest in mild NPDR (G3) reflecting the worst glycaemic control in that group as compared to severe NPDR (G5) and PDR (G6). The association of HbA1c in the moderate NPDR, severe NPDR & PDR group as compared to the non diabetics was significant (p<0.05) as all these groups had diabetic patients with improper glycaemic levels for longer durations.
The association of dyslipidemia with diabetic retinopathy has been studied extensively in the last decades with the ETDRS showing that patients of diabetic retinopathy with elevated levels of total cholesterol and LDL cholesterol were twice as likely to have hard exudates as compared to those with normal levels [16]. In the Chennai Urban Rural Poor Study (CURPS), total cholesterol, triglycerides and HDL cholesterol were higher in cases of diabetic retinopathy as compared to those without retinopathy [17]. In the INDIAB study, the highest total cholesterol was 172±48 mg/dl, triglyceride was 140 mg/dl and HDL was 42±16 mg/dl [3]. In the present study, results were similar, with higher values of total cholesterol and triglyceride seen in those with retinopathy as compared to those without retinopathy. Total cholesterol was highest in the severe NPDR group (G5) at 280.88 mg/dl as compared to PDR group (G6) at 229.97 mg/dl. Similarly, triglycerides were highest in the severe NPDR group (G5) at 286 mg/dl as compared to PDR group (G6) at 191 mg/dl. In our study, the correlation of total cholesterol between non diabetics (G1) and severe NPDR (G5) and PDR (G6) was significant. For triglycerides, the correlation between non diabetics (G1) and severe NPDR (G5) as well as PDR (G6) was significant. Highest values of LDL cholesterol were found in severe NPDR (G5) at 183.8 mg/dl and the lowest was seen in diabetics without retinopathy at 95.32 mg/dl and there was no significant correlation in LDL cholesterol. In the present study, the levels of HDL cholesterol were highest in diabetics without retinopathy (G2) and the lowest in moderate NPDR (G4). Since apo A-I is the apolipoprotein associated integrally with HDL cholesterol, its values would be related to any changes in HDL cholesterol, but in our study the lowest value of HDL cholesterol was seen in moderate NPDR (G4) while apo A-I was lowest in diabetics without retinopathy (G2). This discordance may be due to some unknown factors. The severe NPDR cases (G5) had the highest values of apo B-100, triglycerides, total cholesterol and LDL cholesterol. This is in consonance with apo B-100 being the apolipoprotein integrally a part of VLDL (triglycerides), total cholesterol and LDL cholesterol.
The association of various lipid fractions and microvascular complications of diabetes mellitus has been studied extensively. In a study of 224 diabetic patients, Sasongko MB et al., found lower levels of Apo A-1 and higher levels of Apo B-100 in patients of diabetic retinopathy than in those without retinopathy [18]. In the present study, the highest Apo A-I (167 mg/dl) & Apo B100 (114mg/dl) were seen in severe NPDR (G5). The association between severe NPDR (G5) and PDR (G6) in case of Apo A-I was significant, whereas in case of Apo B100 was not significant (p=0.53). In addition, Apo A-I had significant association between non diabetics (G1), PDR (G6) and severe NPDR (G5). Similarly for severe NPDR and PDR (G5 & G6) Apo B-100 was found to be significant. Apo B-100 also had significant correlation between non diabetics (G1), severe NPDR (G5) and PDR (G6). In a Chinese population, Hu A et al., found that there were significant associations between the decreased Apo A-I and low Apo A-I/Apo B-100 ratio in cases of PDR [19].
The association of other non-lipid markers like homocysteine and few novel markers like lipoprotein(a) with retinopathy has also been studied. The level of total serum homocysteine was measured in Diabetic patients with retinopathy and it was found that the values were higher in cases of proliferative retinopathy as compared to nonproliferative retinopathy and diabetics without retinopathy [20]. The association of lipoprotein(a) with diabetic retinopathy has been studied and it was found to be higher in patients with retinopathy as compared to those without retinopathy [21]. These parameters were not covered in the scope of the present study and merit further in depth studies in diabetic retinopathy.
Limitation
A small sample size is a limitation of the study.
Conclusion
The present study was undertaken to study the association of glycated haemoglobin and serum apo A-I% and apo B-100 in diabetic retinopathy. We have seen discordance in the levels of HDL cholesterol and apo A-I levels. We have seen that apo B-100, total cholesterol, triglycerides and LDL cholesterol were the highest in severe NPDR cases. This knowledge may be utilized for screening of diabetes mellitus cases with apo B-100 as higher values may predispose to either development of retinopathy or to progression of the disease.
Conflict of Interest
There was no financial implication involved.
*G1- Controls, G2-Diabetic without retinopathy, G3- Mild NDPR, G4- Moderate NDPR, G5- Severe NDPR, G6- PDR