Nephrotic syndrome (NS) is one of the most common renal disorders in children with estimated annual incidence of 2-7 cases per 100,000 children per year in western countries [1]. There is epidemiological evidence of higher incidence of NS in children from Southern Asia [2]. Oral corticosteroids preferably prednisolone forms the cornerstone for management which are given for variable periods depending on presentation. There are various well reported adverse effects including osteoporosis which can lead to increased risk of fractures and impaired growth especially in children. Glucocorticoids inhibit osteoblastogenesis, promote osteoblast apoptosis and osteoclastogenesis which result in significant reductions in bone formation and preferably affects trabecular bone mass [3].
Many studies have reported dose and duration dependent decrease in BMD after glucocorticoids [4,5]. Though Ca and VitD supplementation is recommended in children on steroids for more than three months, existing guidelines do not recommend routine supplement during treatment of initial episode [6,7]. This study was conducted to find out the effect of oral prednisolone on BMD in children of NS treated for the first episode and role of Ca and vitD supplementation in this group.
Materials and Methods
A hospital based double blind randomized controlled study (CTRI/2017/06/008780) was conducted in the Department of Paediatrics at a Tertiary Care Centre in New Delhi, India, between October 2011 and March 2013 with total duration of 18 months. Study population was selected from the children attending paediatric nephrology clinic. Clearance from the Ethical Committee of hospital was taken. Inclusion criteria involved children presenting with first episode of NS between age group of 2-12 years. After explaining nature of study, parents/guardians were provided with patient information sheet for informed and written consent before including patients in study.
Those who had relapsed or took steroids, Ca, VitD or diuretics in previous three months were excluded. Also children with kidney dysfunction/congenital renal anomalies, those with extra renal manifestations suggestive of secondary/systemic cause like Systemic Lupus Erythematosus (SLE) were also excluded.
Sample size calculation: Assuming to detect a 10% increase in mean BMD value among cases than control from a previous study [4]. At 5% level of significance and 90% power sample size of 16 for each group was obtained. Considering a maximum attrition of 20%, plan was to take at least 20 patients in each group. Treatment of initial episode was done as per revised Indian Paediatric Nephrology Group guidelines [6].
Randomisation and blinding: All the cases meeting inclusion criteria were registered and prescribed treatment after complete assessment. Randomisation was done using computer generated blocks by an independent physician who was not part of treatment or analysis and Group A or Group B were allocated in equal numbers in opaque envelopes which were provided to nursing staff who dispensed drugs from designated room and was not aware about the nature of drug in the bottles. The two bottles labelled as A and B contained supplement and placebo respectively. Supplement had calcium carbonate 500 mg (200 mg elemental calcium and 400 IU of vitamin D3) tablets whereas placebo contained B-complex tablets with same size and colour. Patients were also blinded to allocation and treatment. Anthropometry, blood pressure, urine dipstick analysis, medicine intake was recorded and follow up diary was maintained on monthly basis to ensure compliance.
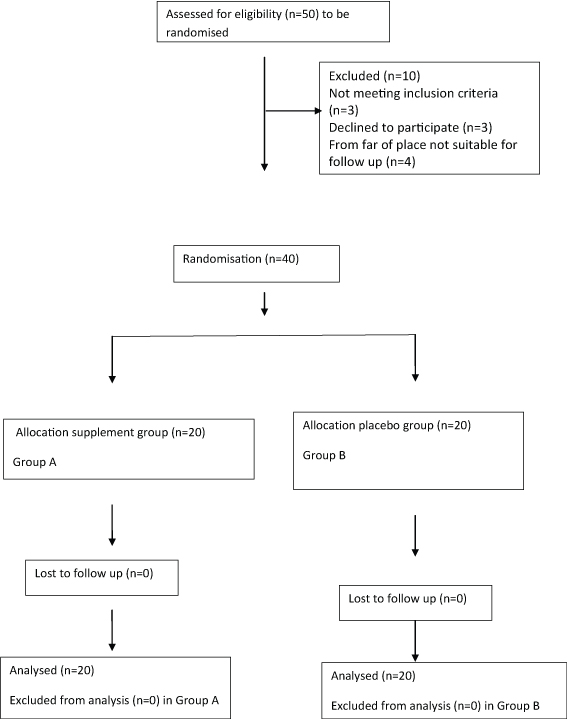
Two groups of 20 cases designated as Group A (supplement/intervention) and Group B (placebo) [Table/Fig-1]. A third group of 20 children age and sex matched attending Outpatient Department (OPD) for acute minor illnesses like cough, cold, diarrhoea, febrile illness etc., were taken as healthy controls (Group C).
Flowchart showing enrolment and division of study population in supplement (Group A) and placebo (Group B) groups.
Biochemical tests including serum Ca, PO4, and ALP were estimated along with VitD levels and BMD at start and after three months of steroid therapy. Serum Ca, PO4, and ALP were measured by colorimetric method, Serum vitamin D (25-hydroxy VitD) levels by using competitive ELISA technique with analyser (Immunodiagnostik K 2109 25-OH VitD direct Elisa) and BMD was estimated using Dual Energy X-linked absorptiometry by Osteocore 3 DEXA scan. DXA scan of lumbar spine both anteroposterior and lateral was done and analysed by comparing with Z-score nomograms by Southard RN et al., [8].
Statistical Analysis
All the continuous variables were tested for normality assumption through Shapiro-wilk test. Variables which were not significantly normally distributed were log transformed at base 10 for the purpose of analysis. For continuous variables t-test was used for comparison. Categorical variables were compared using Chi-square test. Group wise differences were assessed through ANOVA. Linear regression models were used to test the association between different variables and to study difference between two groups. To test the difference in mean vitD, Ca, PO4 and ALP values, Group C controls were compared with Group A and Group B through ANOVA. Bonferroni’s correction was used for pairwise comparison among three groups.
Results
Consecutive fifty cases of first episode NS were initially screened, out of which ten cases were excluded (three children did not meet inclusion criteria, care giver of three children refused for study and four children were from far away areas and unable for regular follow up). Forty cases were randomised into Group A (with supplement) and Group B (with placebo). In addition, a third group of twenty age and sex matched healthy controls were taken as Group C for baseline estimation of biochemical parameters (VitD, Ca, PO4) for comparison.
In Group A 65% (13) were males and 35% (7) were females. In Group B, 50% each (10) were males and females. Mean age in three groups (A, B and C) and also mean BMI amon groups A,B and C were comparable [Table/Fig-2].
Table showing mean age in three groups (A, B and C) and mean BMI in supplemental and placebo groups (A and B).
| Baseline variable | A | B | C | p value* |
|---|
| Mean ± SE | Mean ± SE | Mean ± SE |
|---|
| Age (years) | 4.35 ± 2.52 | 5.18 ± 2.58 | 4.52±2.50 | 0.247 |
| BMI (kg/m2) | 15.01 ± 1.24 | 15.48 ± 1.33 | 15.28±1.22 | 0.252 |
[Table/Fig-3] shows the serum Ca, PO4, ALP and VitD measured in subjects of all 3 groups. The mean calcium value in healthy control group (Group C) was significantly high than Group A (p<0.001) and B (p<0.001). Similarly, serum PO4 levels were comparable between Group A, Group B and Group C (p=0.457). There was no significant difference in VitD level among three groups. Also BMD score in Group A and Group B were comparable. BMD in healthy controls (Group C) was not done. [Table/Fig-4] shows change in serum VitD, Ca, PO4 and ALP levels measured at end of three months of glucocorticoid therapy in Group A and Group B and it was observed that the difference in change over time between both the groups was not statistically significant. However, there was significant decrease in mean VitD levels in Group B compared to Group A, with p<0.014. The decrease in mean value of BMD score over three months was significant in Group B (p-value <0.001), whereas it was insignificant in Group A (p-value 0.745).
Comparison of baseline mean vitamin D, calcium, PO4, ALP among supplement/Intervention group (A); placebo (B); and healthy control (C) groups.
| Baselinevariable | A | B | C | |
|---|
| Mean ± SE | Mean ± SE | Mean ± SE | p value* |
|---|
| Vitamin D (ng/dl) | 23.59 ± 6.08 | 28.85 ± 5.52 | 27.69 ± 2.94 | 0.741 |
| Calcium (mg/dl) | 9.16 ± 0.23 | 9.11 ± 0.29 | 11.14 ± 0.22 | <0.001 |
| PO4 (mg/dl) | 5.49 ± 0.43 | 6.11 ± 0.35 | 5.55 ± 0.37 | 0.457 |
| ALP (IU/L) | 134.78 ± 16.85 | 139.81 ± 17.37 | 192.68 ± 18.40 | 0.043 |
| BMD (g/cm2) | 0.434 ± 0.025 | 0.405 ± 0.023 | Not done in healthy controls | 0.384 |
*p value among group comparison BMD Bone Mineral Density.
Change in serum Vitamin D, Calcium, PO4, ALP and estimated BMD between supplement (A) and placebo group (B) after three months of steroid treatment.
| Variables | Baseline | After 3 months | Change† | p value for within group change | *p value |
|---|
| Mean ± SE | Mean ± SE |
|---|
| Vitamin D (ng/dl) |
| A | 23.59 ± 6.08 | 13.27 ±1.35 | -10.32 | 0.116 | 0.604 |
| B | 28.85 ± 5.52 | 14.22 ± 1.36 | -14.63 | 0.014 |
| Calcium (mg/dl) |
| A | 9.16 ± 0.23 | 8.44 ±0.51 | -0.72 | 0.233 | 0.700 |
| B | 9.11 ± 0.29 | 8.64 ± 0.24 | -0.47 | 0.077 |
| PO4 (mg/dl) |
| A | 5.49 ± 0.43 | 4.45 ± 0.24 | -1.04 | 0.054 | 0.331 |
| B | 6.11 ± 0.35 | 4.30 ± 0.41 | -1.81 | 0.008 |
| ALP (IU/L) |
| A | 134.78 ± 16.85 | 113.23 ± 12.84 | -21.55 | 0.341 | 0.581 |
| B | 139.81 17.37 | 101.01 11.83 | -38.80 | 0.090 |
| BMD (g/cm2) |
| A | 0.434 ± 0.025 | 0.433 ± 0.026 | -0.001 | 0.745 | <0.001 |
| B | 0.405 ± 0.023 | 0.373 ± 0.023 | -0.033 | <0.001 |
*† Change= decrease or increase in value from baseline.
*p value for the difference in change over time (three months) between Group (A) and Group (B). SE –Standard error.
[Table/Fig-5] shows the association between different variables and BMD within the study groups and also between Group A and Group B. Age was found to be significantly associated with BMD in Group A as well as Group B (p<0.001) as BMD value increased with increasing age in both the groups. VitD was significantly positively correlated with BMD in Group A (p<0.05) when one ng/dl increase in VitD changes BMD positively by 0.0006 g/cm2. Serum total protein was significantly associated with BMD in Group B (p<0.05). In Group A Ca, PO4, ALP, BMI and serum total protein were positively associated with BMD while serum cholesterol and serum albumin were negatively associated with BMD though these associations were not statistically significant. Thus, difference in association between Group A and Group B was only significant for VitD and serum total protein.
Association between different variables and BMD by Group A and Group B.
| Variables | Group A | Group B | p-value |
|---|
| Estimate | SE | Estimate | SE |
|---|
| Age (years) | intercept | 0.2876 | 0.0259 | 0.2417 | 0.0292 | 0.247 |
| Slope | 0.0335 | 0.0052 | 0.0373 | 0.0051 | 0.606 |
| Vitamin D (ng/dl) | intercept | 0.3557 | 0.0225 | 0.4340 | 0.0225 | 0.019 |
| Slope | 0.0006 | 0.0002 | -0.0001 | 0.0002 | 0.032 |
| Calcium (mg/dl) | intercept | 0.3475 | 0.0318 | 0.4236 | 0.0535 | 0.225 |
| Slope | 0.0049 | 0.0025 | 0.0011 | 0.0054 | 0.537 |
| PO4 (mg/dl) | intercept | 0.3643 | 0.0263 | 0.4360 | 0.0294 | 0.054 |
| Slope | 0.0042 | 0.0028 | -0.0005 | 0.0021 | 0.184 |
| ALP (IU/L) | intercept | 0.3782 | 0.0241 | 0.4339 | 0.0239 | 0.107 |
| Slope | 0.00006 | 0.00007 | -0.000003 | 0.00007 | 0.512 |
| BMI (kg/m2) | intercept | 0.2833 | 0.2747 | 0.0755 | 0.2638 | 0.588 |
| Slope | 0.0069 | 0.0182 | 0.0231 | 0.0170 | 0.519 |
| Serum Cholesterol (mg/dl) | intercept | 0.4025 | 0.1574 | 0.4327 | 0.1634 | 0.895 |
| Slope | -0.00004 | 0.0005 | 0.000002 | 0.0005 | 0.946 |
| Serum total protein (g/dl) | intercept | 0.2912 | 0.2193 | 1.0836 | 0.3004 | 0.039 |
| Slope | 0.0220 | 0.0478 | -0.1568 | 0.0723 | 0.046 |
| Serum *Alb (g/dl) | intercept | 0.4652 | 0.2546 | 0.6582 | 0.3091 | 0.632 |
| Slope | -0.0372 | 0.1240 | -0.1205 | 0.1653 | 0.689 |
*p value is for the difference of association of each variable with BMD between Group A and Group B through linear regression models with repeated measures. SE –Standard error.
*Alb- albumin.
Discussion
Out of 50 cases who met criteria initially for eligibility, 40 subjects were enrolled and completed study. Time frame of three months was taken as per the treatment protocol of first episode NS [6,7]. This study was mainly undertaken to observe the effect of steroids given for three months on BMD and role of Ca and VitD supplement in such children. Most of the studies conducted earlier have enrolled children on long term steroids (steroid dependent, frequent or infrequent relapsers) although Mishra OP et al., and Bak M et al., also included cases with first episode NS along with other group [9,10].
The age distribution was comparable in all three groups. Mean values of serum VitD and PO4 were comparable between children of Group A, Group B and Group C [Table/Fig-3] suggesting, nephrotic syndrome as disease per se does not affect vitamin D levels. The low calcium in Group A and Group B may be explained on basis of low level of albumin in nephrotic children. The mean baseline values of VitD, Ca, PO4 and ALP [Table/Fig-3] were comparable in Group A and Group B suggesting good randomisation. Similarly, there was no significant difference in mean BMD between Group A and Group B (p=0.384). After three months, all the biochemical parameters as well as BMD were found to be decreased in all nephrotic syndrome cases following treatment with corticosteroids. But change in serum Ca and ALP was not significant in both the groups which is similar to observation made by Wojnar J et al., and Gulati S et al., who reported no significant change in serum Ca, PO4 and ALP levels after follow up of NS children with or without supplement [11,12]. However, in our study it was observed that serum level of phosphate decreased in both groups {Group A (p=0.054) as well as Group B (p= 0.008)} after three months of steroid treatment in contrast to other studies [11-13] where they had observed no significant change in levels of PO4 with steroid treatment. Decrease in VitD levels were more pronounced and significant in Group B who did not get supplements [Table/Fig-4]. Observation of our study corroborates with that of Zaniew M et al., showing mean serum concentration of 25-OHD in patients who were on cholecalciferol were higher as compared to controls. They also observed that despite VitD and Ca supplementation, majority of patients (89%) showed hypovitaminosis for VitD [14]. The mean BMD values decreased in both groups A and B after treatment period of three months and decrease was significant in Group B (p<0.001). Many studies had reported decrease in BMD with steroid treatment, most of them being cross-sectional in nature and compared BMD of NS children on variable doses of steroids with age and sex matched controls [13-16].
In addition to BMD, Shouman MG et al., also measured bone density biochemical markers like procollagen, osteocalcin, deoxypyridinoline, osteoprotegerin and serum Parathormone (PTH). They observed that although serum Ca, PO4 and ALP were not affected significantly but bone density markers mentioned above along with BMD significantly decreased with steroid treatment [16]. However, there are some studies which did not observe significant decrease in BMD with steroid therapy [17-21].
Role of prophylactic VitD and Ca in improving BMD in NS children taking steroids for longer duration have been reported in various studies [11,12,14]. Bak M et al., observed that BMD was significantly decreased in both the supplement (p=0.001) and non supplement (p<0.001) group and percent decrease in BMD was found to be significantly lower in the supplement group than in the non supplement group (p<0.001) [10]. Most importantly our study showed decrease in BMD with steroids treatment and beneficial role of Ca and VitD supplement even during first episode NS. Main strength of this study is inclusion of only first episode NS children to emphasize role of Ca and VitD supplementation even during first episode as there is definite lack of similar study. However, decrease in BMD in Group A showed that the supplement (VitD 400 IU and elemental Ca 200 mg) were not adequate to prevent bone deficit. Further studies at large scale with higher doses are needed to estimate optimum dose of supplement.
Limitation
Main limitation of this study is single institution study with small size. To incorporate as a uniform recommendation, multicentric study with large sample size carried out among different ethnicities is needed. Also using higher and graded doses of Ca and VitD supplements will help in knowing the optimum dose of these supplements.
Conclusion
BMD and VitD levels are adversely affected in children of NS treated with steroids for initial episode and therefore requires VitD and Ca supplementation during first episode as well.
*p value among group comparison BMD Bone Mineral Density.
*† Change= decrease or increase in value from baseline.
*p value for the difference in change over time (three months) between Group (A) and Group (B). SE –Standard error.
*p value is for the difference of association of each variable with BMD between Group A and Group B through linear regression models with repeated measures. SE –Standard error.
*Alb- albumin.