Introduction
Blood cell histograms are produced by the modern automated haematology analysers which are routinely used to count blood cells. A good interpretation of this histogram provides a wealth of information on many haematological conditions than mere cell counts, helping to narrow down the differential diagnosis at a very early stage even before higher level investigations are ordered. Histogram interpretation needs careful analysis of RBC, WBC and platelet distribution curves. These curves also known as Complete Blood Count (CBC) histogram are derived by plotting the size of each cell on X-axis and their relative number on Y-axis [1]. Unfortunately, due to various reasons blood cell histograms have not gained popularity among clinicians.
Principle of Automated Haematology Analyser
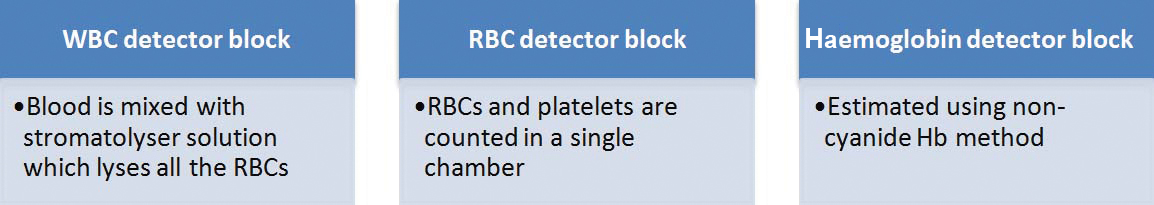
The automated blood cell counting process is very fast and can process up to 60-80 blood samples in an hour [2-3]. There are three detector blocks in an automated haematology analyser [Table/Fig-1]. RBCs and platelets are counted in the same block whereas, WBCs are counted in a separate block. All the red cells in the blood directed towards the WBC counting block are lysed first using the stromatolyser solution [1-3]. This solution is composed of an organic quarternary ammonium salt (8.5 g/L) and sodium chloride (0.6 g/L). After lysis, only the nuclei of the WBCs along with a thin rim of cytoplasm remains, which are counted and plotted in the WBC histogram [1]. The size of the WBCs after lysis corresponds to the size of their nuclei; hence neutrophil is the largest after lysis even though originally monocyte is the largest WBC. Cells are counted by passing a dilute solution of the blood through an aperture across which an electrical current is flowing. The passage of cells through the current changes the impedance between the terminals (Coulter principle) [4]. The sizing and counting of blood cells is based on this measurable change in the electrical impedance.
Inside an automated haematology analyser, the EDTA anticoagulated blood is divided into three channels and enters WBC detector block, RBC detector block and haemoglobin detector block.
WBC Histogram
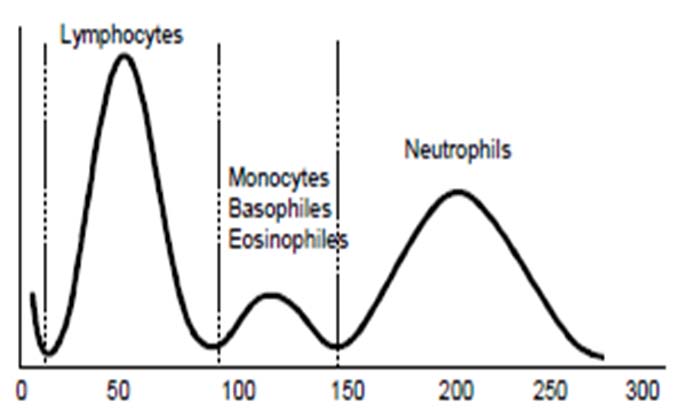
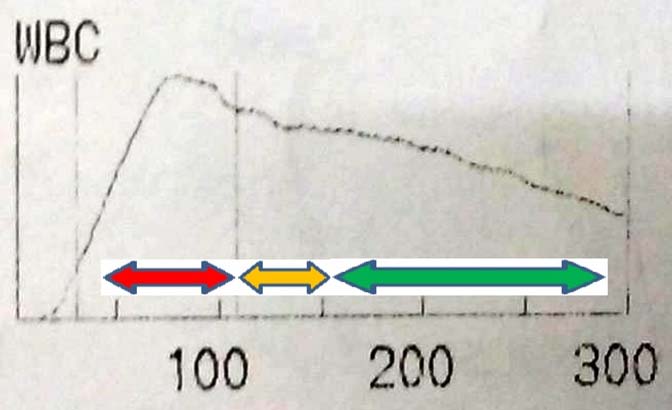
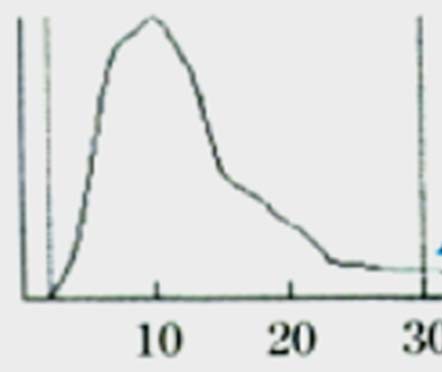
A normal WBC histogram is shown in the [Table/Fig-2]. Lymphocytes are distributed between 50-100 fL, mixed cell population (monocytes, basophils and eosinophils) between 100-150 fL, and neutrophils between 150-300 fL [5].
Normal WBC distribution curve.
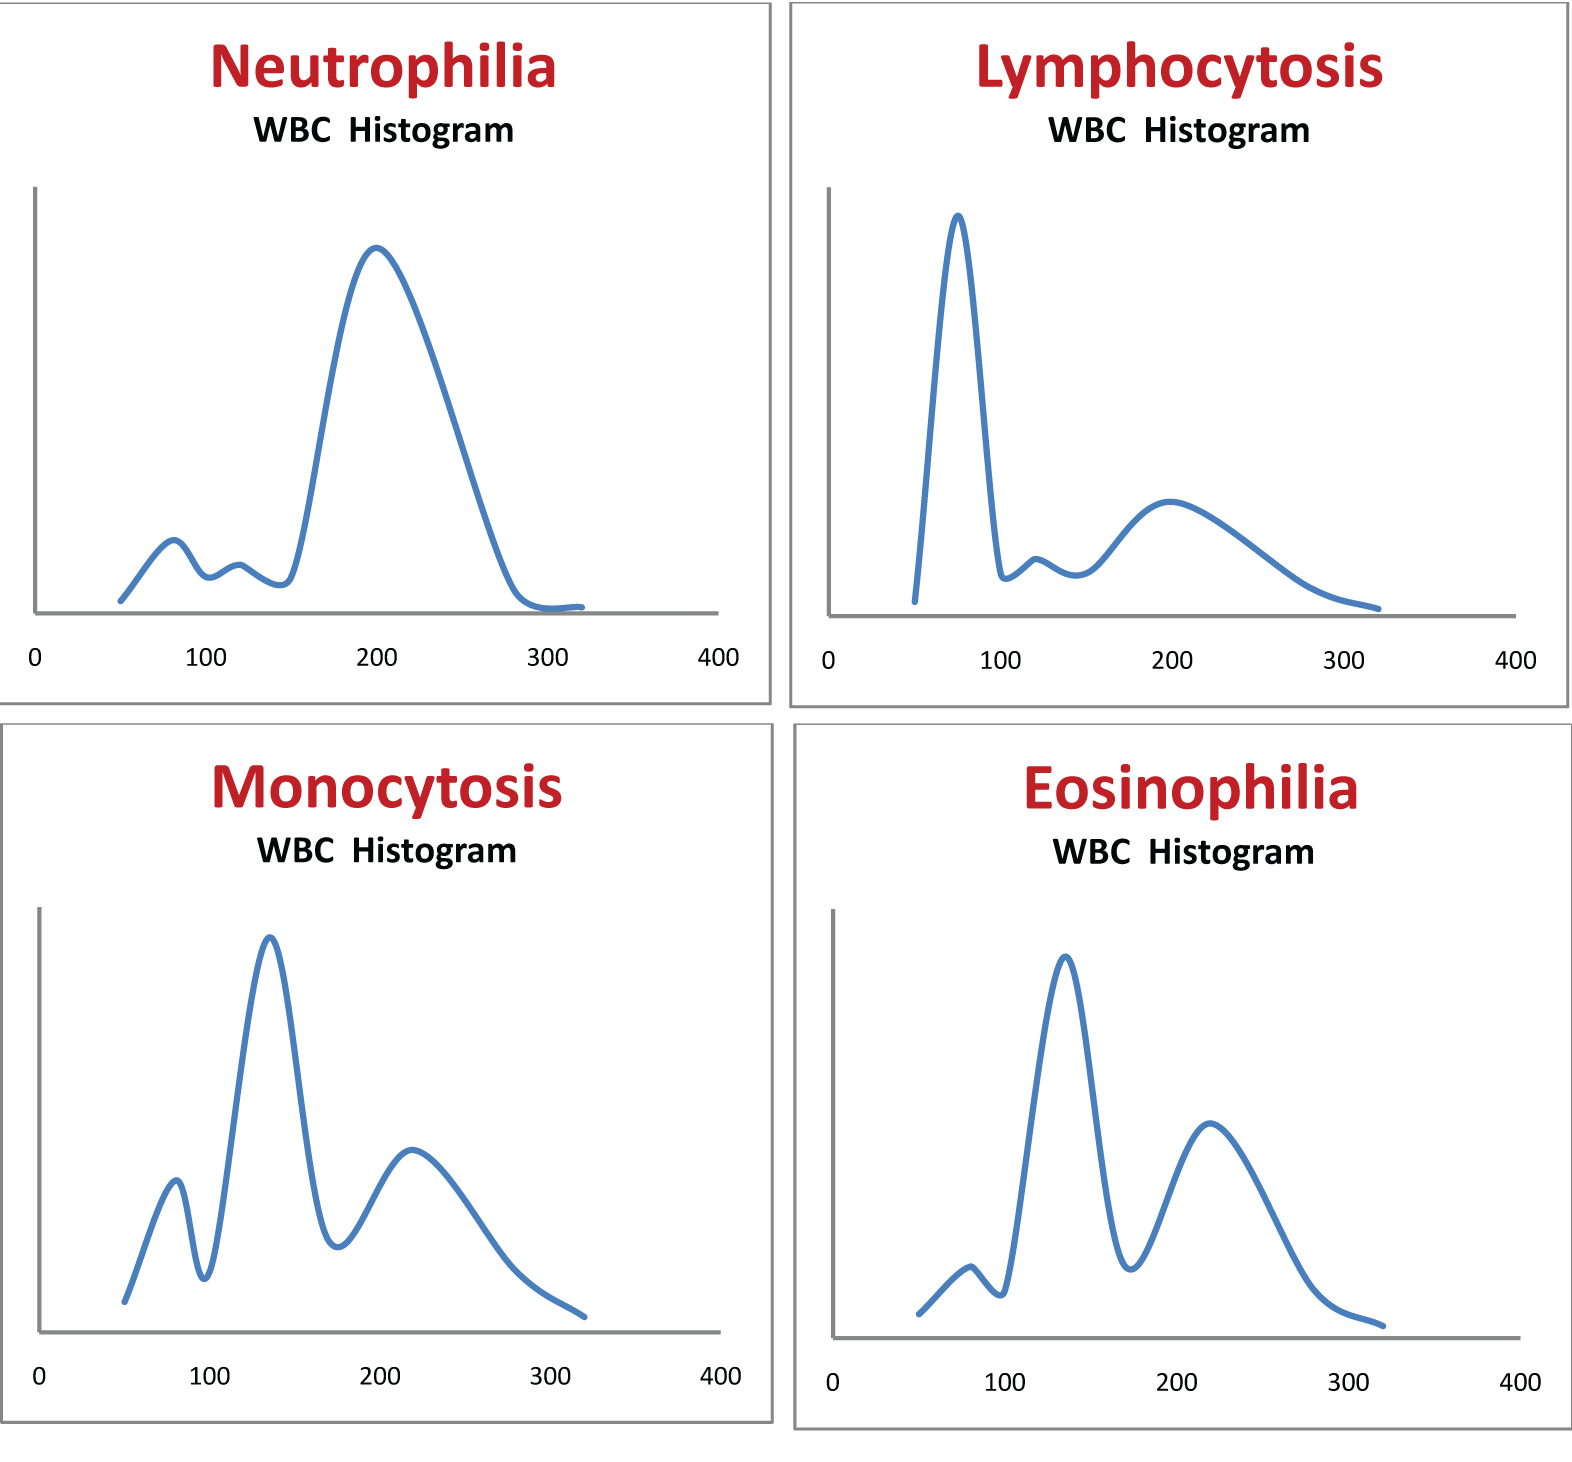
[Table/Fig-3a-d] shows different types of leukocytosis. It is difficult to distinguish between eosinophilia, basophilia and monocytosis from the WBC distribution curve as all these are distributed in the same region (100-150 fL).
Shows different types of leukocytosis. It is difficult to distinguish between eosinophilia, basophilia and monocytosis from the WBC distribution curve as all these are distributed in the same region (100-150 fL). a) Neutrophilia; b) Lymphocytosis; c) Monocytosis; d) Eosinophilia.
All the histograms that are discussed below were obtained from SYSMEX KX 21 machine.
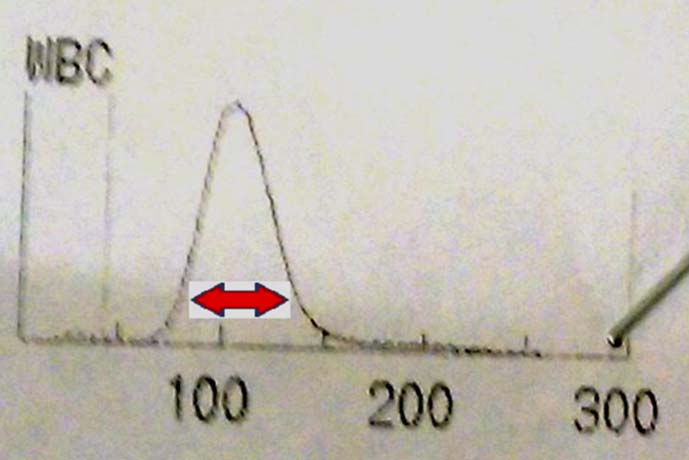
Case 1: A 56-year-old male presented with tiredness and early satiety. He had a massive splenomegaly. His haemogram showed Haemoglobin (Hb) of 9.7 g/dl, WBC count of 64,000 per mm3. The WBC histogram is shown in the [Table/Fig-4].
WBC histogram of case 1. Red arrow is marked in the region of myelocyte buldge of CML.
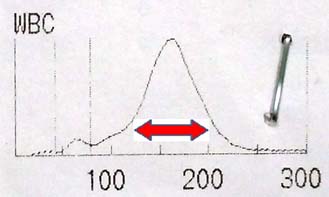
Patient in the case 1 has leukocytosis with WBC distribution curve showing a peak in the region of neutrophils. The two differential diagnoses for this WBC distribution were Chronic Myeloid Leukaemia (CML) in chronic phase and leukemoid reaction. As the patient was having massive splenomegaly, diagnosis was in favour of CML. The myelocytes outnumber the more mature metamyelocytes in CML and are seen as the myelocyte bulge in WBC histogram [6] (red arrow shown in the [Table/Fig-4]).
Case 2: A 44-year-old male presented with tiredness and massive splenomegaly. His Hb was 8.0 g/dl, WBC count was 2,57,000 per mm3 and platelet count was 96,000 per mm3. WBC histogram is shown in the [Table/Fig-5].
WBC histogram of case 2. Blast cells are shown in red arrow, basophils are shown in yellow arrow, and cells at various stages of myeloid maturation are shown in green arrow.
The patient in case 2 was in blast crisis of CML. In the WBC distribution curve, the maximum number of cells was seen in the region of blasts (Red arrow). Blast cells occupy the region between 70-120 fL. Cells at various stages of myeloid maturation were also increased (Green arrow). There was also marked basophilia (Yellow arrow). Diagnosis of blastic phase of CML from peripheral blood requires ≥20% blasts [7], which was obvious in this histogram.
Case 3: Complete blood count of a 30-year-old female was done as a part of preoperative evaluation for an elective surgery. The WBC count was 3.49 million per mm3. The WBC histogram is shown in the [Table/Fig-6a].
a) WBC histogram of case 3 showing sliding curve; b) Empty bottle of stromatolyser solution is seen when the outer cover of the analyser was opened.
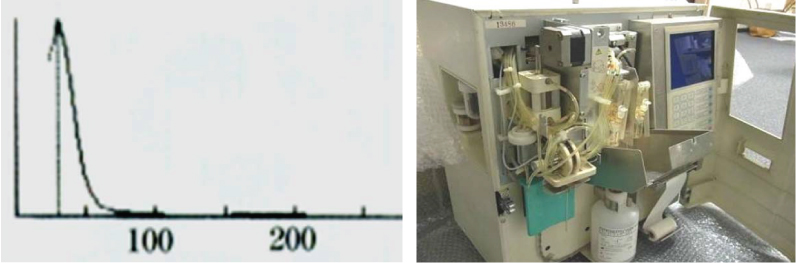
The WBC count in case 3 was 3.49 million per mm3, which is in the range of RBC count. The histogram here shows a sliding curve [Table/Fig-6a] that does not correspond to the usual WBC distribution. This indicates a technical error in counting, which in this case was caused due to an empty stromatolyser bottle in the analyser machine [Table/Fig-6b]. Insufficient lysis of RBCs due to the lack of stromatolyser solution resulted in the entry of RBCs into the WBC counting block, causing a spuriously high count. The differential diagnoses for spurious elevations of the WBC count are platelet clumps, nucleated RBCs, incomplete lysis of RBCs, cryoglobulins, and cryofibrinogen, all of which may be wrongly counted as WBC by the haemanalyser [8].
Case 4: A 63-year-old male came to Outpatient Department (OPD) with tiredness and intermittent fever. His Hb was 6.6 g/dl, WBC count was 41,500 per mm3, and platelet count was 20,000 per mm3. WBC histogram is shown in the [Table/Fig-7].
WBC histogram of case 4 shows a peak in the region of blasts (red arrow).
The patient in case 4 has very high WBC count, all seen in the area of blasts (Red arrow). This is suggestive of acute leukaemia.
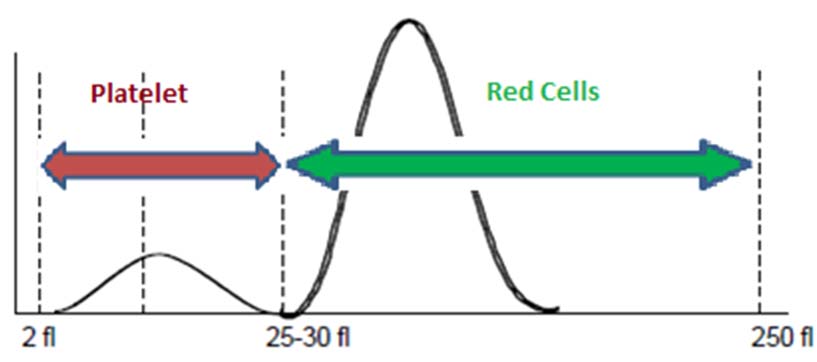
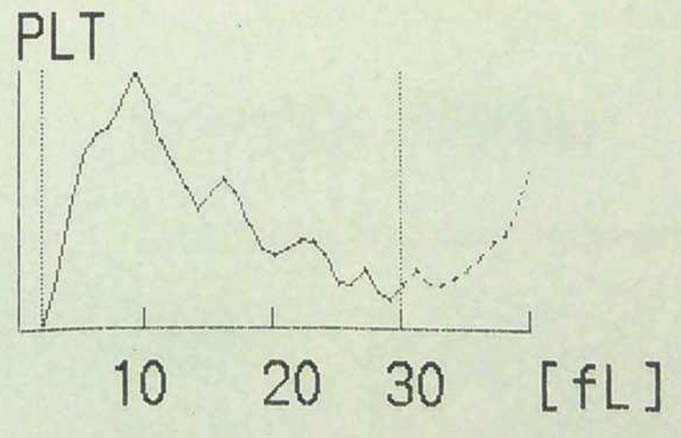
RBC and platelet distribution curve: RBCs and platelets are counted in the same chamber and plotted in a same graph [Table/Fig-8]. An arbitrary line is drawn through the trough of the curve which is usually in the 25-30 fL regions. All the cells towards the left of this line are counted as platelets and towards the right as RBCs [9].
Normal platelet and RBC histogram.
Case 5: A 27-year-old female was admitted with chronic diarrhoea. Her Hb was 7.7 g/dl. Mean Corpuscular Volume (MCV) was 88 fL. RBC histogram is shown in the [Table/Fig-9].
RBC histogram of case 5 showing two peak (near 70 fL and 100 fL).
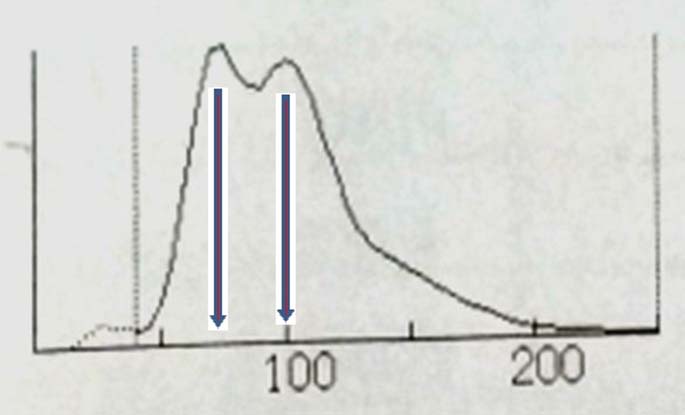
RBC histogram [Table/Fig-9] of case 5 shows two peaks (near 70 fL and 100 fL). This histogram is consistent with dimorphic anaemia. It was the average of these two peaks that was recorded as the MCV of 88 fL in the haemogram. She was diagnosed to have Crohn’s disease on colonoscopy and terminal ileal biopsy.
Case 6: A 24-year-old male was admitted with history of fever, sore throat and cervical lymphadenopathy. His Hb was 9.4 g/dl and MCV was 116 fL. RBC distribution curve of this patient is shown in the [Table/Fig-10a].
a) RBC histogram of case 6 showing an additional small peak at 180 fL region; b) RBC histogram of case 6 when the same blood sample was warmed to 37°C and reanalysed. The additional peak seen initially disappeared.
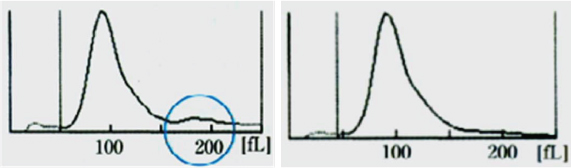
Patient in case 6 had infectious mononucleosis complicated by cold agglutinin haemolytic anaemia. The high MCV initially recorded by the automated counter was due to the RBC clumping by cold agglutinins [10,11]. Clumped RBCs was counted as a single cell resulting in spuriously high MCV. RBC clumping in this case can be recognised by the presence of a second peak (blue circle in the [Table/Fig-10a]) with double the normal corpuscular volume, indicating that two RBCs attached to each other were counted as single by the analyser. The same EDTA sample when warmed and analysed again, showed Hb of 9.8 g/dl with MCV of 96 fL. The graph obtained after warming is shown in the [Table/Fig-10b]. Warming of same sample made the cold agglutinin non viable, hence, no clumping was observed in the second RBC distribution curve.
Case 7: A 45-year-old female presented to the OPD with lethargy. Her Hb was 7.8 g/dl and MCV was 65 fL. She was started on oral iron therapy. CBC was repeated after two weeks. RBC distribution curves before and after starting iron therapy is shown below in [Table/Fig-11a,b].
a) Initial RBC histogram of case 7; b) RBC histogram of case 7 when repeated two weeks after starting iron therapy.
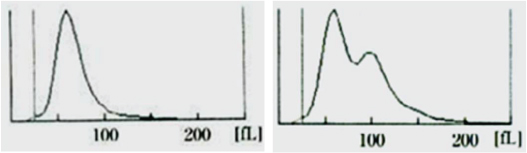
The second graph [Table/Fig-11b] shows a population of new cells with corpuscular volume >100 fL, which are the reticulocytes. This is a definite indicator that, the patient is responding to the iron therapy and the primary diagnosis is iron deficiency anaemia.
Case 8: A 17-year-old female presented with tiredness. Her Hb was 7.8 g/dl and WBC count was 24,200 per mm3. Her RBC and WBC distribution curves are shown in the [Table/Fig-12a,b].
a) WBC histogram of case 8 showing an additional peak (dotted curve) before the lymphocyte peak; b) RBC histogram of case 8 showing an additional population of cells with larger corpuscular volume.
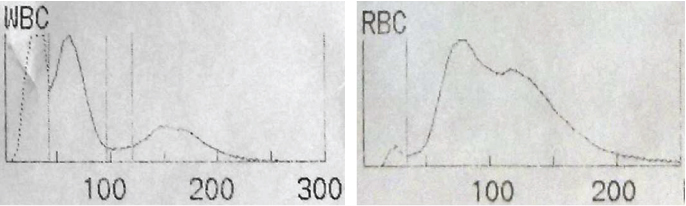
In the WBC histogram [Table/Fig-12a], the dotted curve before the lymphocyte peak indicates nucleated RBC. Nucleated RBCs (normoblasts) will be counted as WBC in the haemanalyser [8]. Looking into the RBC distribution curve [Table/Fig-12b], there are two peaks. The second peak in the RBC distribution (with higher corpuscular volume) curve indicates reticulocytes. Presence of significant number of nucleated RBCs and reticulocytes are highly suggestive of haemolytic anaemia.
Case 9: A 64-year-old male came to haematology OPD with persistently low platelet counts. His latest automated platelet count was 57,000 per mm3. Platelet histogram is shown in the [Table/Fig-13].
Platelet histogram of case 9 showing multiple peaks.
Multiple peaks in platelet histogram indicate platelet clumping [Table/Fig-13]. Normal platelet count was obtained when counting was repeated using heparin as anticoagulant instead of EDTA. This is an in vitro phenomenon, induced at room temperature in EDTA-anticoagulated blood. It occurs due to preformed EDTA-dependent antibody with dual reactivity against both the platelet glycoprotein IIb/IIIa complex and the neutrophil Fc gamma receptor III. It is a fairly common phenomenon seen 1 in 1000 normal adults [12-16].
Case 10: A 28-year-old female presented with multiple petechiae on her legs. She did not have any lymphadenopathy or organomegaly. Her platelet count was 14,000 per mm3. The platelet distribution curve is shown in the [Table/Fig-14].
Platelet histogram of case 10 showing a significant number of cells with size more than 10 fL.
The platelet distribution curve [Table/Fig-14] shows a significant number of cells with size more than 10 fL. Immune Thrombocytopenic Purpura (ITP) is a condition where there is accelerated platelet destruction by autoantibodies, with a compensatory increase in platelet production, hence circulating platelets in patients with ITP are younger and have larger size [17].
Mechanism of thrombocytosis in iron deficiency anaemia: Iron deficiency anaemia is a cause for reactive thrombocytosis. The mechanism for thrombocytosis is not fully elucidated. The correlation between high Erythropoietin (EPO) levels and high platelet counts may suggest that, EPO increases platelet counts by stimulating of thrombopoesis [18]. When blood cell counting is done in an automated analyser, a more important cause of thrombocytosis also comes into play. In iron deficiency anaemia, microcytes with size less than 30 fL will be counted as platelets. Even a small percentage of RBCs when falsely counted as platelets can significantly affect the platelet count as RBC count is in millions and platelet count is in lacs.
Detection of malarial parasites: A spurious increase in the mixed cell population can be an indicator of the presence of malaria parasites in the red blood cells [19]. This occurs because the parasite infected RBCs cannot be lysed by the stromatolyser solution and will enter the WBC counting block. In a study, using Sysmex XS-800i analyser, a spurious increase in the mixed cell population was moderately sensitive and highly specific in diagnosing malaria [20].
Conclusion
CBC histogram analysis is an often neglected part of automated haemograms that if well interpreted, has a good potential to provide diagnostically relevant information about many disease process even before higher level investigations are ordered. It is a universal, economical and simple method to narrow down the differential diagnosis at early stages of patient evaluation.
[1]. Brown Barbara A, Haematology: Principles and Procedures 1993 Sixth EditionMedia, PALippincott Williams & Wilkins:102-7.:111-6. [Google Scholar]
[2]. Sysmex XE-2100 Main Unit Operator’s Manual, Sysmex Corporation, April 2004 [Google Scholar]
[3]. Sysmex XE-2100 IPU Operator’s Manual, Sysmex Corporation, April 2004 [Google Scholar]
[4]. Hogg WR, Coulter WH. Apparatus and method for measuring a dividing particle size of a particulate system. U.S. Patent 3,557,352 [Google Scholar]
[5]. WBC histogram interpretation of 3-part differentiation, Sysmex Xtra online, July 2011 [Google Scholar]
[6]. Anastasi J, Vardiman JW, Chronic myelogenous leukaemia and the chronic myeloproliferative diseases. In: Knowles DM, editorNeoplastic haematopathology 2001 2nd edPhiladelphiaLippincott Williams and Wilkins:1745-90. [Google Scholar]
[7]. Vardiman JW, Harris NL, Brunning RD, The World Health Organization (WHO) classification of the myeloid neoplasmsBlood 2002 100(7):2292-302. [Google Scholar]
[8]. Cornbleet J, Spurious results from automated haematology cell countersLab Med 1983 14:509-14. [Google Scholar]
[9]. Platelet distribution curves: interpretation, potentials and limitations, Sysmex Xtra online. June 2011 [Google Scholar]
[10]. Nikousefat Z, Javdani M, Hashemnia M, Haratyan A, Jalili A, Cold agglutinin disease: a laboratory challengeIran Red Crescent Med J 2015 17(10):e18954 [Google Scholar]
[11]. Choccalingam C, Kannan A, Spectrum of changes in rbc indices and histograms in blood from subjects with cold antibodiesJ Clin Diagn Res 2016 10(11):ED10-ED11. [Google Scholar]
[12]. Isik A, Balcik OS, Akdeniz D, Cipil H, Uysal S, Kosar A, Relationship between some clinical situations, autoantibodies, and pseudothrombocytopeniaClin Appl Thromb Haemost 2012 18:645-49. [Google Scholar]
[13]. Fang C, Chien Y, Yang L, Lu W, Lin M, EDTA-dependent pseudothrombocytopeniaFormosan Journal of Surgery 2015 48:107-09. [Google Scholar]
[14]. Garcia Suarez J, Calero MA, Ricard MP, Krsnik I, Rus GP, Perera F, EDTA-dependent pseudothrombocytopenia in ambulatory patients: clinical characteristics and role of new automated cell-counting in its detectionAm J Haematol 1992 39(2):146-48. [Google Scholar]
[15]. Vicari A, Banfi G, Bonini PA, EDTA-dependent pseudothrombocytopaenia: a 12-month epidemiological studyScand J Clin Lab Invest 1988 48(6):537-42. [Google Scholar]
[16]. Bartels PC, Schoorl M, Lombarts AJ, Screening for EDTA-dependent deviations in platelet counts and abnormalities in platelet distribution histograms in pseudothrombocytopeniaScand J Clin Lab Invest 1997 57(7):629-36. [Google Scholar]
[17]. Illes I, Pfueller SL, Hussein S, Chesterman CN, Martin JF, Platelets in idiopathic thrombocytopenic purpura are increased in size but are of normal densityBr J Haematol 1987 67(2):173-76. [Google Scholar]
[18]. Beguin Y, Erythropoietin and platelet productionHaematologica 1999 84(6):541-47. [Google Scholar]
[19]. Singh A, Narang V, Sood N, Garg B, Gupta VK, Malaria diagnosis using automated analysers: a boon for haematopathologists in endemic areasJ Clin Diagn Res 2015 9(10):OE01-08. [Google Scholar]
[20]. Adlekha S, Jaiswal RM, Chadha T, Singla A, The correlation of spurious eosinophilia in automated haematological analyser Sysmex XS-800i with Plasmodium infection diagnosisIndian J Med Sci 2011 65:469-75. [Google Scholar]