LVM increases during childhood and adolescence with body growth. It has been suggested that other factors, such as high blood pressure, obesity, hyperlipidemia, arterial stiffness, smoking etc., may have an effect on left ventricular mass [1].
Increased LVM assessed by echocardiogram is an independent risk factor for cardiovascular morbidity and mortality [2,3]. Blood Pressure (BP) in the high normal range and excessive body weight (often associated with hyperinsulinemia) are cardiovascular risk factors with long-term effects on Left Ventricular (LV) structure and function [4-6]. Body Mass Index (BMI) and high blood pressure are independently associated with LVMI. The association between BP and LVMI is stronger with higher BMI categories, however this relationship is additive and not synergistic or multiplicative [7].
LVM and geometry occupy an unusual position in the assessment of cardiovascular risk in that these factors are not only in part determined by conventional cardiac risk factors such as hypertension but also function independently as intermediate risk factors themselves [8].
LVM estimates can be used to determine prognosis and cardiovascular risk and to assess the efficacy of therapy in a number of different heart diseases in which Left Ventricular Hypertrophy (LVH) is present. In patients with essential hypertension and baseline ECG LV hypertrophy, lower LV mass during antihypertensive treatment is associated with lower rates of clinical end points additional to effects of BP lowering and treatment modality [9].
Measurement of LVM and geometry in patients with essential hypertension by echocardiography stratify risk in them which is independent and stronger than BP or other reversible risk factors. This may also help to stratify need for intensive treatment [10]. Besides hypertension, continuous physical activity may be related to LVH in different populations [11].
There are no documented studies for the determinants of LVM in the Northern Indian population in the state of Himachal Pradesh, hence the present study is an attempt to study the prevalence and determinants of LVH in hospital based population with no structural heart disease.
Materials and Methods
A prospective cross-sectional observational study was carried out in a tertiary care centre in Northern India and the study population was all consecutive patients attending cardiology OPD on Mondays with symptoms of breathlessness, chest pain, dizziness etc., and patients seeking medical attention for dyslipidaemia, hypertension but not on medication. Patients fulfilling the eligibility criteria as defined and consenting to participate, were enrolled for the study. The study was conducted on 105 eligible patients during one year period commencing June 2012 to June 2013. Patients who fulfilled inclusion criteria were subjected to focused history, physical examination and investigations (blood tests, ECG and ECHO).
Details of demographic data, behavioural characteristics e.g., consumption of tobacco and alcohol, physical activity status (sedentary, moderate, vigorous) were recorded. Medical history- evidence of hypertension, diabetes, dyslipidaemia and their treatment status was obtained.
Physical examination involved recording of anthropometrics and BP. We collected blood samples for haemoglobin (Hb), lipids, blood sugar and renal functions tests.
Twelve lead Electrocardiogram (ECG) were recorded and analysed for evidence of LVH based on the various criteria mentioned in operational definition; by recording the R wave amplitudes in V5/V6, and aVL, S wave amplitude in V1/V3.
A 2D guided M mode Echocardiography (truncated ellipse formula) was done in each patient using I 33 ECHO machine of Philips medical system using 2-5 MHZ phased array probe.
LV mass as found on Echocardiography was indexed (LVMI) using body surface area for each subject. Cut off values of 95 gm2 in females and 115 gm2 (as per guidelines of American Society of Echocardiography) were taken.
Statistical Analysis
Data Analysis was done using Epi-info software version 3.5.1. We calculated Means ±Standard deviation for continuous variables and proportions for categorical variables were calculated. We calculated means of LVMI for categorical variables i.e., sex, tobacco consumption, alcohol consumption and sedentary lifestyle etc., and also calculated p-values as test of significance for mean difference across the exposure variable groups. Association between increased LVMI with clinical characteristics was analysed on linear regression. The independent predictors/determinants of LVM were analysed using multivariate linear regression model fitting all the independent variables found to have significant associations on univariate analysis. A 2 tailed significance at p< 0.05 was taken as statistically significant.
Results
Mean age of study population was 42.30±9.8 years and 62.9% were men. The proportion of study population consuming tobacco was 15.2% and 23.8% were alcohol consumers. About 25.7% of the study participants were leading a sedentary life style. Means of anthropometrical, biochemical variables and ECHO findings are shown in [Table/Fig-1]. About 70% of the study population had raised WHR [Table/Fig-2]. Hypertension was present in 44.8% of study populations (95% C.I–35-50.8%). Proportion of study participants with raised fasting blood sugar (>100 mg/dl) was 25.7%. Proportion of raised triglyceride (>150 mg/dl) was 36.2%, while 11.4% had raised total cholesterol (>240 mg %). Only three patients (2.8%) were found to have LVH in our study population.
Means of demographic, anthropometry, behavioural and biochemical variables (continuous variables).
| Variables | Mean (± Standard Deviation) |
|---|
| Demographic |
| Age in years | 42.3±9.8 |
| Males (%) | 62.9% |
| Anthropometrical |
| Body Mass Index | 25.9±3.8 |
| Diastolic BP | 90.9±9.8 |
| Waist Hip Ratio | 0.91±0.05 |
| Systolic BP | 139.8 ±15.8 |
| Biochemical |
| Hb | 12.8±1.3 |
| Fasting Blood Sugar | 92.6±12.1 |
| Total Cholesterol | 191.2±42.4 |
| Triglyceride | 155.9±98.3 |
| Mean HDL | 43.2±12.0 |
| TG/HDL Ratio | 3.9±2.8 |
| Echo Findings |
| LV Mass Index | 75.3±13.4 |
| LVEDV | 92.1±22.6 |
| LVESV | 32.1±10.7 |
| LVEF | 65.0±6.1 |
| EWDT | 171.6±34.2 |
LVEDV = Left Ventricular Ejection Diastoloc Volume, LVESV = Left Ventricular Ejection Systolic Volume, LVEF = Left Ventricular Ejection Fraction, EWDT = E Wave Deceleration Time.
Distribution characteristics of behavioural, and CV risk factors in study population.
| Parameters | Percentage (n=105) | 95% Confidence Interval |
|---|
| Tobacco Consumers (%) | 15.2 | 9.0-23.6% |
| Alcohol Consumers (%) | 23.8 | 16.0-33.1% |
| Sedentary Lifestyle (%) | 25.7 | 17.7-35.2% |
| Hypertensives (%) | 44.8 | 35.0-50.8% |
| Obesity (%) | 23.8 | 16.0-33.1% |
| Raised Waist Hip Ratio (%) | 69.5 | 59.8-78.1% |
| Prediabetics (%) | 25.7 | 17.7-35.2% |
| Hypercholesterolaemia (%) | 11.4 | 6.0-19.1% |
| Hypertriglyceridaemia (%) | 36.2 | 27.0-46.1% |
| Proportion Dyslipidaemia (%) | 33.3 | 24.4-43.2% |
The mean LVMI was significantly higher in men than in women 77.7±11.4 vs.71.3±15.7 (p-value < 0.01) and among tobacco consumers compared to non-consumers 79.3±9.5 vs. 74.6±13.9 (p<0.02.) and among alcohol consumers compared to non-consumers 79.9±12.9 vs. 73.9±13.4 (p< 0.04). There was a trend of higher mean LVMI among study population with hypertension, high waist hip ratio, elevated blood sugar (>100 mg/dl) and overweight but was statistically not significant [Table/Fig-3,4,5 and 6].
Means of LVMI according to selected risk factors (categorical variables).
| Variables | LVMI amongexposed | LVMI amongunexposed | p-value |
|---|
| Mean | s.d. | Mean | s.d. |
|---|
| Male Sex | 77.7 | 11.3 | 71.2 | 15.7 | 0.01 |
| Tobacco Consumption | 79.2 | 9.5 | 74.6 | 13.9 | 0.02 |
| Alcohol Consumption | 79.9 | 12.9 | 73.8 | 13.3 | 0.04 |
| Sedentary Lifestyle | 75.7 | 12.7 | 75.1 | 15.5 | 0.84 |
| Hypertension | 77.1 | 13.6 | 73.8 | 13.2 | 0.20 |
| Obesity (BMI ≥ 29) | 76.3 | 14.1 | 74.9 | 13.3 | 0.65 |
| Raised Waist Hip Ratio | 76.3 | 14.0 | 72.9 | 11.9 | 0.22 |
| Raised Fasting Blood Sugar (≥100mg%) | 78.5 | 8.6 | 74.2 | 14.6 | 0.15 |
| Dyslipidaemia | 75.6 | 13.7 | 75.1 | 13.4 | 0.85 |
Linear regression test using Epi-info software version 3.5.3, p-value <0.05 is taken as significant.
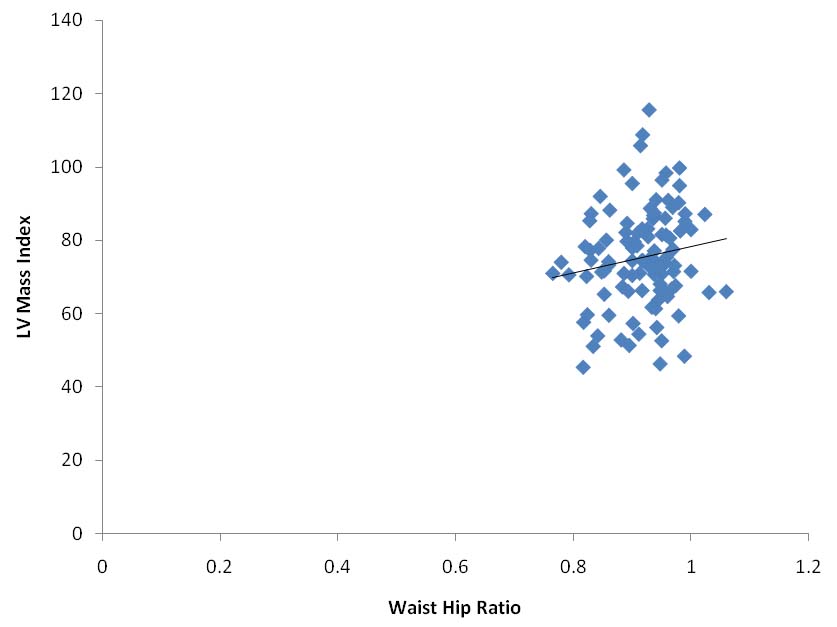
Scatter diagram showing the relation of LVMI with WHR (p-value=0.04).
Linear regression test using Epi-info software version 3.5.3, p-value <0.05 is taken as significant.
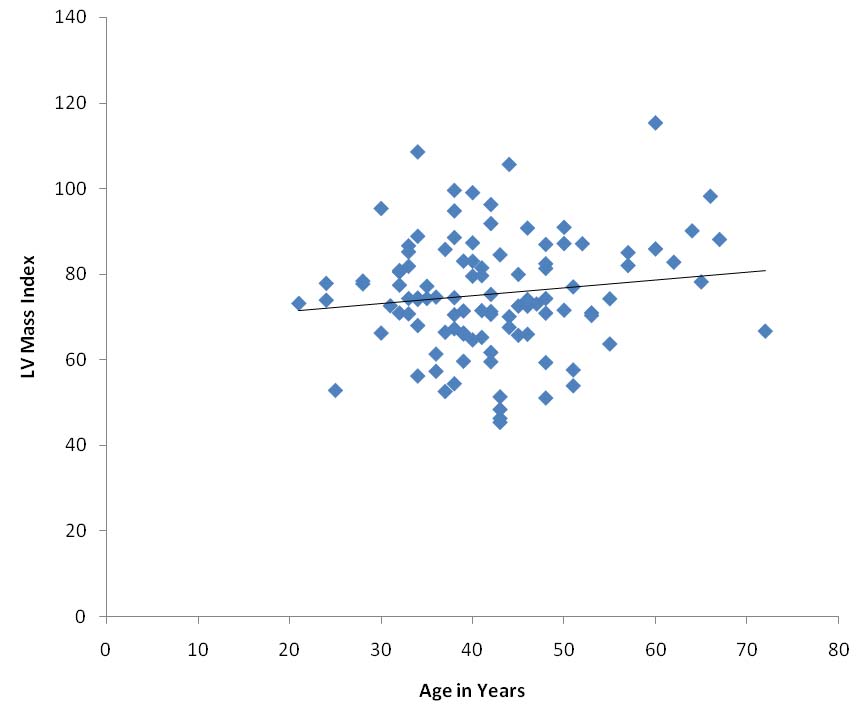
Scatter diagram showing the relationship of age with LVMI (p-value= 0.11).
Linear regression test using Epi-info software version 3.5.3, p-value <0.05 is taken as significant.
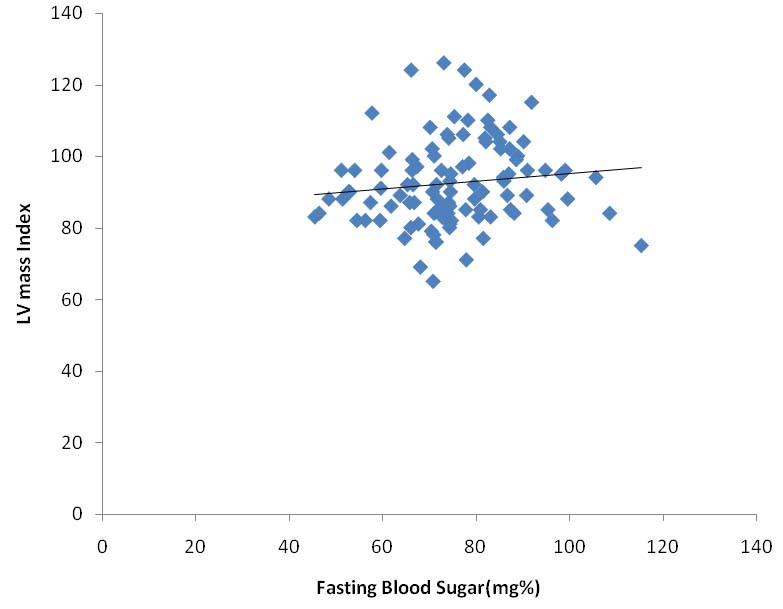
Scatter diagram showing the relationship of fasting blood sugar with LVMI (p-value= 0.03).
Linear regression test using Epi-info software version 3.5.3, p-value <0.05 is taken as significant.
The predictive value of waist hip ratio for LVMI was statistically not significant (p=0.12). Age and BMI were also positively related to higher LVMI but was statistically not significant. The regression coefficient for age was 0.18 (p-value- 0.17) and for BMI was 0.27 (p-value- 0.43). Similarly, systolic BP was also positively correlated with LVMI (coefficient 0.09, p-value 0.28) but was statistically not significant. LVEDV, LVESV, LVEF and E wave deceleration time had significant predictive value for LVMI. LVEF and E wave deceleration time had inverse association with LVMI (coefficient -0.63, p < 0.01) (coefficient -0.13, p < 0.02) respectively [Table/Fig-7].
Univariate linear regression - outcome variable LVMI.
| Variables | Coefficient | F-test | 2-tailed significance |
|---|
| Age | 0.18 | 1.84 | 0.17 |
| CV Risk Factors |
| BMI | 0.27 | 0.6 | 0.43 |
| Systolic BP | 0.09 | 1.7 | 0.28 |
| Diastolic BP | 0.16 | 1.5 | 0.21 |
| Waist Hip Ratio | 35.5 | 2.3 | 0.12 |
| Fasting Blood Sugar | 0.13 | 1.5 | 0.21 |
| Total Cholesterol | 0.02 | 0.5 | 0.46 |
| Triglyceride | 0.01 | 0.2 | 0.62 |
| HDL | 0.05 | 0.2 | 0.64 |
| TG/HDL Ratio | 0.18 | 0.1 | 0.70 |
| ECHO Findings |
| LVEDV Indexed | 0.72 | 60.3 | <0.001 |
| LVESV Indexed | 1.32 | 42.7 | <0.001 |
| LVEF Indexed | -0.63 | 7.6 | 0.01 |
| EWDT Indexed | -0.13 | 5.2 | 0.02 |
| E/A Ratio Index | -4.96 | 1.2 | 0.25 |
Coefficient= Pearson correlation coefficient, F Test=Value obtained after multiple linear regression test, 2 tailed significance= p-value, p-value <0.05 is taken as significant
Multiple linear regressions to study the independent correlation between LVMI and other variables: To study the independent association of LVMI, all the variables found to have significant associations were fitted into multiple linear regression model. Strong positive correlation was observed between increased waist hip ratio and increased LVMI. The Pearson correlation coefficient was 36.77 and it was statistically significant (p-value 0.04).
Independent positive correlation was also observed between LVMI and age (coefficient 0.18, p = 0.11), Left Ventricular End Diastolic Volume (coefficient 0.77, p<0.001), BMI with coefficient 0.015, (p = 0.96), fasting blood sugar coefficient 0.20, (p = 0.03) and raised TG/HDL ratio with coefficient 0.20 (p-value 0.59). LVEF index was negatively correlated with LVMI (coefficient -0.25, p-value 0.39) [Table/Fig-8].
Multiple Linear regression outcome variable LVMI with other variables i.e. Age, Cardiovascular Risk factors and ECHO findings.
| Variables | Coefficient | F-test | p-value |
|---|
| Age | 0.18 | 2.5 | 0.11 |
| CV Risk Factors |
| BMI | 0.01 | 0.1 | 0.96 |
| Systolic BP | 0.05 | 0.5 | 0.44 |
| Waist Hip Ratio | 36.7 | 3.1 | 0.04 |
| Total Cholesterol | -0.02 | 0.9 | 0.33 |
| TG/HDL Ratio | 0.20 | 0.2 | 0.59 |
| Fasting Blood Sugar | 0.20 | 4.5 | 0.03 |
| ECHO Findings |
| LVEDV Indexed | 0.77 | 17.3 | <0.001 |
| LVEF Indexed | -0.25 | 0.7 | 0.39 |
| EWDT Indexed | 0.04 | 0.5 | 0.45 |
| LVESV Indexed | 0.05 | 0.0 | 0.90 |
Coefficient= Pearson correlation coefficient, F-Test=Value obtained after multiple linear regression test, p-value= 2 tailed significance
Discussion
Prognostic information provided by the estimation of LVM by echocardiography is beyond that provided by the evaluation of traditional cardiovascular risk factors. Increase in LVM leads to an increased incidence of clinical events due to cardiovascular disease [3].
In our study, we tried to study the correlation between LVMI with demographic, behavioural characteristics and CV risk factors. The means of LV mass index were found to be significantly higher (p-value <0.05) in males, tobacco consumers and alcohol consumers, these findings are supported by a previous study [12].
LVMI had an independent positive correlation with increased WHR in our study (p=0.04). Similar findings have been observed in the Multi Ethnic study of Atherosclerosis on the impact of obesity on left ventricle [13]. Significant association of LVMI with systolic BP and BMI was observed in The Atherosclerotic Risk in Communities Study [7], but only a trend of systolic BP and BMI being independently and positively associated with LVMI was seen in our study, though not statistically significant.
Fasting blood sugar was also independently correlated with LVMI (p=0.03) and this finding is consistent with previous study [14]. The Augusburg Diabetes Family Study conducted in 2002 in which it was observed that in prediabetic and diabetic elderly subjects, fat mass is a major determinant of LVM.
Increased TG/HDL ratio was found to have no significant independent association with LVMI (p=0.59). Increased left ventricular end diastolic volumes had significant independent correlation with LVMI (p=<0.001).
Results of present study reveal that there is an independent association between fasting blood sugar, and raised waist to hip ratio with LVMI suggesting the role of insulin resistance as the underlying cause of increased LVM. Thus, Insulin may be one of the underlying potential causes of LVH and associated phenotypic expression of elevated fasting blood sugar, deranged raised TG/HDL ratio. The hypertension that is the component of insulin resistance may also be contributory factor in pathogenesis of LVH as a result of increased LV after load. Thus, LVH is the phenotypic manifestation of deranged underlying metabolic and neurohormonal balance resulting in hypertension, dysglycaemia and dyslipidaemia and are important independent risk factors of CV events. The observed association of tobacco consumption and alcohol consumption with LVMI in the present study could also be operating through mechanism of insulin resistance mediated by processes oxidative stress and obesity respectively.
Limitation
The study population was low risk population thus the association of LVH with clinical characteristics recorded could not be evaluated reliably.
Conclusion
There is positive and independent correlation of increased LVMI with increased waist hip ratio. A positive independent correlation is also present with higher fasting blood sugar levels. Insulin resistance may be underlying mechanism of development of LVH. Overall LVH was low which may be due to enrollment of low risk population therefore the correlation between clinical characteristics and LVH could not be studied adequately. Future large scale studies are required to determine risk determinants of LVH.
LVEDV = Left Ventricular Ejection Diastoloc Volume, LVESV = Left Ventricular Ejection Systolic Volume, LVEF = Left Ventricular Ejection Fraction, EWDT = E Wave Deceleration Time.
Linear regression test using Epi-info software version 3.5.3, p-value <0.05 is taken as significant.
Coefficient= Pearson correlation coefficient, F Test=Value obtained after multiple linear regression test, 2 tailed significance= p-value, p-value <0.05 is taken as significant
Coefficient= Pearson correlation coefficient, F-Test=Value obtained after multiple linear regression test, p-value= 2 tailed significance