There are anatomical, physiological and biochemical changes observed between both the genders. There are numerous variations observed even in oral and dental tissues of different genders, which have been utilised in forensic medicine and dentistry [1].
Gingiva (gums) is part of oral mucosa that covers the alveolar process of jaws and surrounds the neck of tooth in a collar like fashion. Gingiva is a keratinized tissue which acts as a primary barrier against the insult of different microorganisms [2]. The biotype of gingiva plays an important role in maintenance of oral health as well as in restorative and implant dentistry. Gingiva is one of those aspects that vary in both males and females from an anatomic and morphometric perspective [3].
Gingival biotype is a term used to describe the thickness of the gingiva in the labiolingual direction [4-6]. Studies have reported that, susceptibility for gingival recession following surgical and restorative procedures is directly correlated with gingival biotype [7,8].
Studies regarding the gingival biotype in different genders are sparse in population of Maharashtra, India.
With this background, the present study was designed to compare and evaluate the gingival biotype between males and females by morphometric (clinical and photographic) and radiographic methods. The outcomes of the study will help dental practitioners of Maharashtra in devising an appropriate treatment plan and achieving a predictable dental aesthetic outcome.
Materials and Methods
This cross-sectional comparative study was conducted in the Department of Periodontology, School of Dental Sciences, Krishna Institute of Medical Sciences Deemed University (KIMSDU), Karad, Maharashtra, India. Institutional Ethical Clearance was obtained before commencing the study (KIMSDU/IEC/04/2015). A written, informed consent was obtained from all participants before their inclusion in the present study.
Subjects in age range of 18 and 25 years, with all the maxillary teeth in the anterior sextant (maxillary left canine to maxillary right canine) were included in the study. Subjects were excluded if they met one of the following criteria – intake of medicaments known to increase gingival overgrowth; systemic diseases having gingival manifestations and/or influence the bone metabolism; pregnant and lactating women; presence of periodontal probing depths ≥4 mm; gingival recessions; signs of attrition and cervical abrasions; crown restorations or fillings in the upper central incisor area.
A total of 837 subjects (420 females and 417 males) were selected for the study based on the inclusion and exclusion criteria. Thirty seven subjects who failed to report after the initial phase I therapy were not considered for the study.
A total of 800 subjects (400 females and 400 males) were included and examined for the study. All the required information was recorded in a pre-designed structured proforma. The study was conducted during the period of March 2016 to November 2016.
Initial Preparation of the Subjects
Oral prophylaxis with scaling and root planing was performed on all the subjects to eliminate any inflammatory component of the gingiva that could cause bias in the measurements.
Measurement of Clinical Parameters
The gingival biotype on the facial aspect over the maxillary central incisors was assessed with a periodontal probe (CP 15 UNC; Hu-Friedy, Rotterdam, Netherland). The maxillary central incisors were selected as they play a vital role in influencing the aesthetic outlook of the patient and were easy to record the radiographic and morphometric parameters. A single calibrated examiner measured the gingival parameters under the supervision of a senior periodontist to minimize the bias.
The width of keratinized gingiva (GW) was measured from the mid-facial position of the marginal gingiva up to the mucogingival junction, to the nearest millimetre.
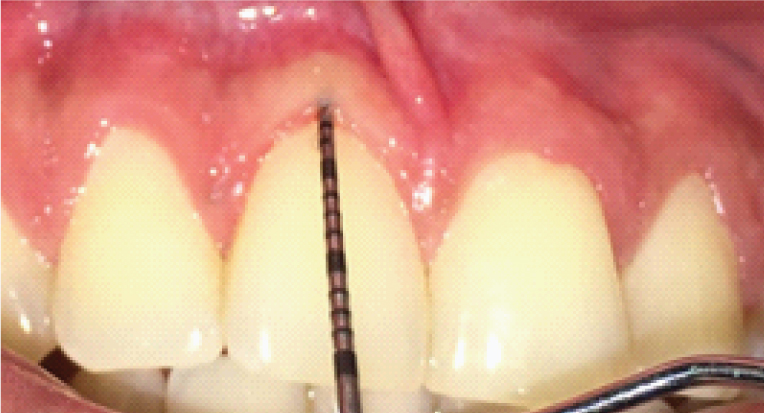
The gingival tissue thickness was determined by placing a periodontal probe through the sulcus (TRAN) at the mid- facial region and observing for the transparency of the probe as shown in [Table/Fig-1] (score 0= probe visible denotes thin gingival biotype; score 1= probe not visible denotes thick gingival biotype according to Kan JY et al., [9].
Transparency of periodontal probe placed through the sulcus to determine the gingival tissue thickness (TRAN).
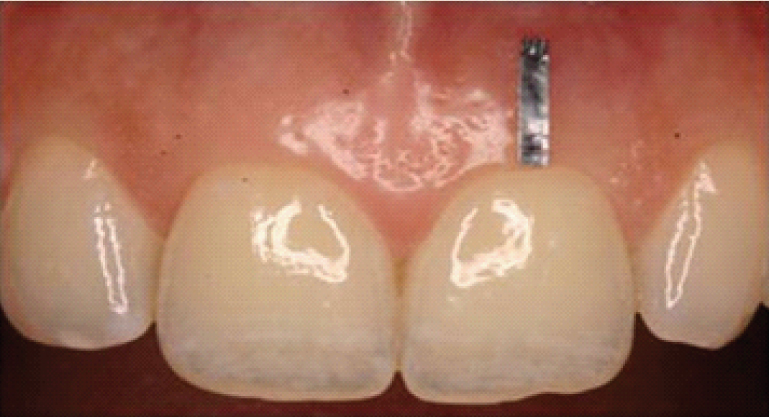
A thin lead foil (5.0 mm × 1.0 mm × 0.1 mm) was attached over the facial gingival surface with a tissue adhesive (Histoacryl®; B.Braun, Melsungen, Germany) with its most coronal margin aligned with the edge of the marginal gingiva extending till the midbuccal position which acted as a reference for radiographic interpretations [Table/Fig-2].
Clinical view of index tooth with the attached lead foil.
A single calibrated oral radiologist captured the digital Radiographic images (RVG) using an X-ray machine (Intraskan DC; ImageWorks, Elmsford, NY, USA) operating at 65 kVp and 7.5 mA with a complementary metal-oxide semiconductor (CMOS) sensor (RVG 5200; Carestream Health, Toronto, ON, Canada). The exposure time was set to 0.06 seconds for RVG. All the images were captured using paralleling technique where the sensor was placed parallel to the long axis of the tooth in a lateral position as described by Alpiste-Illueca [10]. A bite block was placed in the posterior teeth, so that the sensor could be positioned on the lateral vestibule for better image reproducibility. Particular care was taken for the parallel orientation of the film towards the long axis of the tooth to minimize distortion of the image. The digital radiographs were analysed using digital imaging software (CS Imaging version 7.0, Carestream Health, Toronto, ON, Canada).
The following measurements were made radiographically [Table/Fig-3]:
Radiographic measurement points for assessment of gingival thickness (GT1, GT2, GT3) and alveolar bone thickness (AT1, AT2, AT3).
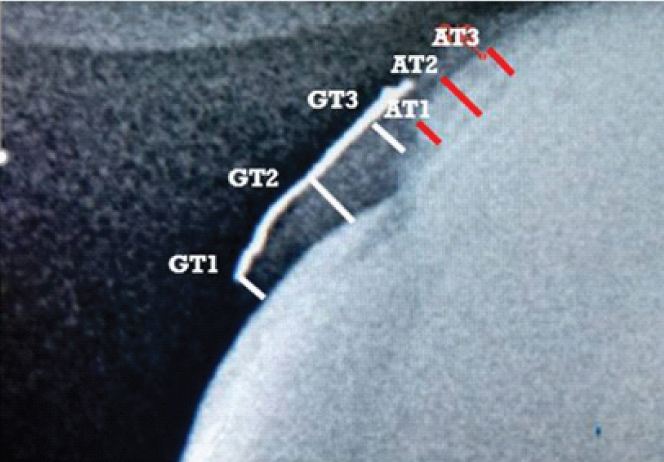
Thickness of gingiva was measured at three different points as follows; GT1: from the inner side of the lead foil to the enamel surface at the coronal margin of the free gingiva; GT2: from the inner side of the lead foil to the root surface at the cementoenamel junction at the supracrestal attachment and GT3: from the inner side of the lead foil to the facial margin of the bone crest at the attached gingiva.
Thickness of alveolar bone on the facial aspect was measured at three different points as follows; AT1: at the bone crest level; AT2: at the mid-point between AT1 and AT3; AT3: at the junction between the coronal third and middle third of the root length.
Measurement of Photographic Parameters
Clinical photographs were captured using the SLR camera (Canon EOS 1100D) with standardization (Resolution- 12 megapixels, Distance- 10 cm from the object and fixed magnification) for all the patients as suggested by Suragimath and colleagues [11]. A Photoshop software (Adobe Photoshop CS7) was used to measure the Crown Width (CW), Crown Length (CL) and Papillary Height (PH) in all the photographs [Table/Fig-4].
Photographic measurements of CW, CL and PH.
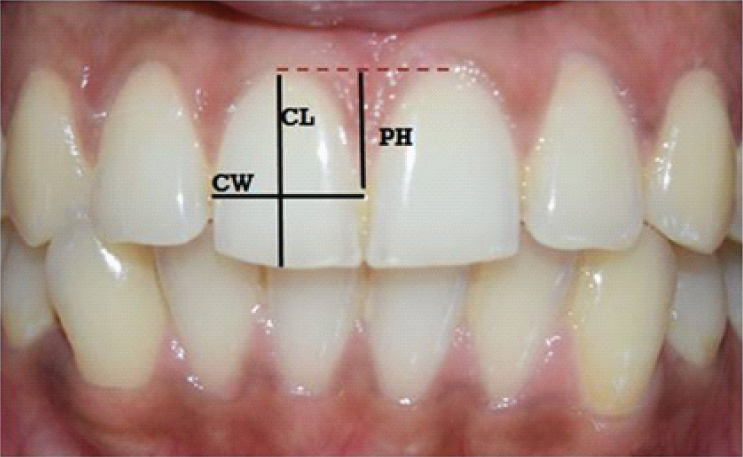
1. Crown width/crown length ratio (CW/CL): Crown length was measured from the incisal edge of the crown to the most coronal level of marginal gingiva on the facial surface. The crown width was measured between the mesial and distal contact points of the crown.
2. Papillary height (PH) was measured from imaginary line joining the zenith of gingival margin on the facial surface of the adjacent maxillary central incisors to the peak of the inter-dental papilla.
Statistical Analysis
The statistical analysis was carried out using SPSS statistical package version 20.0 (IBM Company, Chicago, IL). All analyses were done in an explorative manner. Outcome values of all parameters were mentioned as mean and standard deviation (SD). The Pearson correlation coefficient (r) with the corresponding 95% confidence interval was used to evaluate possible correlations. The strength of correlation was assessed based on absolute value of ‘r’ (0.00-0.19: very weak; 0.20-0.39: weak; 0.40-0.59: moderate; 0.60-0.79: strong; 0.80-1.0: very strong). A value of p ≤0.01 was considered to be statistically significant.
Results
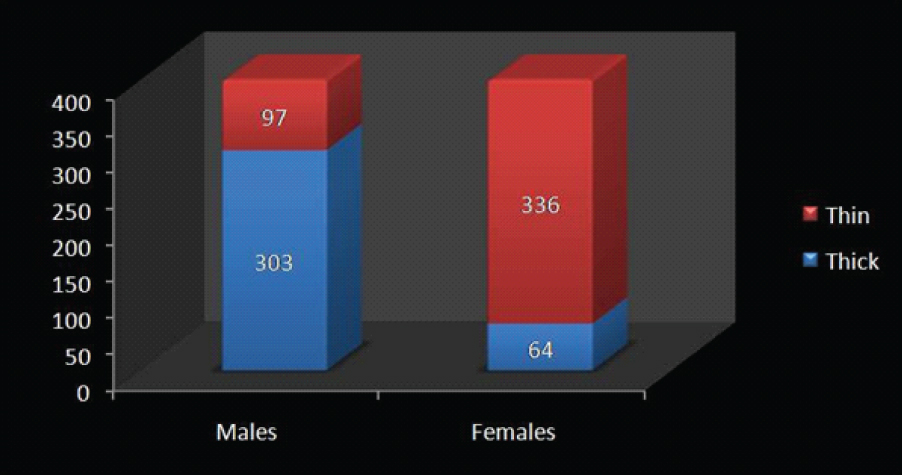
The demographic data showed that the mean age was 21.33±2.42 years and 22.08±2.31 years for males and females respectively. The frequency distribution of different gingival biotypes among males and females has been depicted in [Table/Fig-5] in which 303 males (75.8%) and 64 (16%) females had thick gingival biotype whereas 97 males (24.2%) and 336 females (84%) had a thin gingival biotype. Different gingival parameters were measured in both the genders to elucidate the gender differences [Table/Fig-6] which depicted that the values of GW, TRAN, CW/CL, GT1, GT2, GT3, AT1, AT2 and AT3 were more in males as compared to females except for PH.
Frequency distribution of different gingival biotypes among males and females.
Gingival parameters measured clinically, photographically and radiologically.
| Parameters | Mean (SD) | Range |
|---|
| Males | Females | Total | Males | Females |
|---|
| GW | 3.48(0.28) | 2.75(0.30) | 3.12(0.29) | 3-4 | 2-3.5 |
| TRAN | 0.76(0.43) | 0.16(0.37) | 0.46(0.40) | 0-1 | 0-1 |
| CW/CL | 0.88(0.03) | 0.71(0.05) | 0.80(0.04) | 0.79-0.94 | 0.63-0.84 |
| PH | 4.16(0.21) | 4.92(0.27) | 4.54(0.24) | 3.8-4.7 | 4.3-5.4 |
| GT1 | 0.98(0.15) | 0.54(0.22) | 1.52(0.19) | 0.7-1.1 | 0.2-1.1 |
| GT2 | 1.30(0.11) | 0.86(0.21) | 1.08(0.16) | 1.1-1.4 | 0.6-1.4 |
| GT3 | 1.00(0.11) | 0.64(0.19) | 0.82(0.15) | 0.8-1.1 | 0.3-1.1 |
| AT1 | 0.50(0.11) | 0.29(0.10) | 0.40(0.11) | 0.3-0.6 | 0.2-0.6 |
| AT2 | 0.66(0.08) | 0.50(0.11) | 0.58(0.10) | 0.5-0.7 | 0.4-0.8 |
| AT3 | 0.56(0.08) | 0.40(0.10) | 0.48(0.09) | 0.4-06 | 0.3-0.6 |
GW- Width of keratinized gingiva; TRAN- Transparency of the probe through gingival sulcus; CW/CL- Crown width/crown length ratio; PH- Papillary height; GT1- Thickness of gingiva at the coronal margin of the free gingiva; GT2- Thickness of gingiva at the supracrestal attachment; GT3- Thickness of gingiva to the facial margin of the bone crest at the attached gingiva; AT1- Thickness of alveolar bone on the facial aspect at the bone crest level; AT2- Thickness of alveolar bone at the mid-point between AT1 and AT3; AT3- Thickness of alveolar bone at the junction between the coronal third and middle third of the root length.
Correlation analyses of gingival measurements for males:
Correlation analyses in males revealed a significant relationship between TRAN, CW/CL, PH and all thickness parameters (p ≤ 0.01). A very strong positive correlation was observed for TRAN with the thickness of the gingiva at different apico-coronal levels (GT1, GT2, GT3) as well as thickness of the facial alveolar bone plate at different apico-coronal levels (AT1, AT2, AT3) (r > 0.80). On the contrary, a weak negative correlation was found between all thickness measurements and PH (p ≤0.01, r > -0.40) except for AT2 and AT3, (r = -0.43). Moreover, CW/CL had a weak positive correlation with all thickness values (r <0.19) and there was no significant correlation found between GW and all thickness parameters (p>0.01, r <0.19) [Table/Fig-7].
Correlation between GW, TRAN, CW/CL and PH with gingival and alveolar bone thickness in males.
| Parameters | Test used | GT1 | GT2 | GT3 | AT1 | AT2 | AT3 |
|---|
| GW | Pearson Correlation | 0.06 | 0.06 | 0.06 | 0.06 | 0.05 | 0.05 |
| Sig. (2-tailed) p value | 0.22 | 0.20 | 0.20 | 0.20 | 0.29 | 0.29 |
| C. I. | (-0.04, 0.16) | (-0.04, 0.16) | (-0.04, 0.16) | (-0.04, 0.16) | (-0.05, 0.15) | (-0.05, 0.15) |
| TR AN | Pearson Correlation | 0.88** | 0.85** | 0.85** | 0.85** | 0.89** | 0.89** |
| Sig. (2-tailed) p value | <0.01 | <0.01 | <0.01 | <0.01 | <0.01 | <0.01 |
| C. I. | (0.86, 0.9) | (0.82, 0.87) | (0.82, 0.87) | (0.82, 0.87) | (0.87, 0.91) | (0.87, 0.91) |
| CW/CL | Pearson Correlation | 0.15** | 0.14** | 0.14** | 0.15** | 0.18** | 0.18** |
| Sig. (2-tailed) p value | <0.01 | <0.01 | <0.01 | <0.01 | <0.01 | <0.01 |
| C. I. | (0.05, 0.24) | (0.04,0. 23) | (0.04, 0.23) | (0.05, 0.24) | (0.08, 0.27) | (0.08, 0.27) |
| PH | Pearson Correlation | -0.39** | -0.37** | -0.36** | -0.37** | -0.43** | -0.43** |
| Sig. (2-tailed) p value | <0.01 | <0.01 | <0.01 | <0.01 | <0.01 | <0.01 |
| C. I. | (-0.47, -0.31) | (-0.44, -0.27) | (-0.45, -0.28) | (-0.44, -0.27) | (-0.51, -0.35) | (-0.51, -0.35) |
Correlation is significant at p ≤0.01 level (2-tailed).
C.I. – Confidence interval; GW- Width of keratinized gingiva; TRAN- Transparency of the probe through gingival sulcus; CW/CL- Crown width/crown length ratio; PH- Papillary height; GT1-Thickness of gingiva at the coronal margin of the free gingiva; GT2- Thickness of gingiva at the supracrestal attachment; GT3- Thickness of gingiva to the facial margin of the bone crest at the attached gingiva; AT1- Thickness of alveolar bone on the facial aspect at the bone crest level; AT2- Thickness of alveolar bone at the mid-point between AT1 and AT3; AT3- Thickness of alveolar bone at the junction between the coronal third and middle third of the root length.
The relation between the thickness of the gingiva and the alveolar bone plate was examined for males. There was a significantly very strong positive correlation between the gingival thicknesses at all levels (GT1, GT2, GT3) and the thickness of the alveolar bone plate (AT1, AT2, AT3) (p ≤0.01, r >0.90) [Table/Fig-8].
Correlation between thickness of gingiva and alveolar bone in males.
| Parameters | Test used | GT1 | GT2 | GT3 |
|---|
| AT1 | Pearson Correlation | 0.99** | 1.00** | 1.00** |
| Sig. (2-tailed) p value | <0.01 | <0.01 | <0.01 |
| AT2 | Pearson Correlation | 0.95** | 0.91** | 0.91** |
| Sig. (2-tailed) p value | <0.01 | <0.01 | <0.01 |
| C. I. | (0.94,0.96) | (0.89,0.93) | (0.89,0.93) |
| AT3 | Pearson Correlation | 0.95** | 0.91** | 0.91** |
| Sig. (2-tailed) p value | <0.01 | <0.01 | <0.01 |
| C. I. | (0.94,0.96) | (0.89,0.93) | (0.89,0.93) |
Correlation is significant at p <0.01 level (2-tailed).
C.I. – Confidence interval; GT1- Thickness of gingiva at the coronal margin of the free gingiva; GT2- Thickness of gingiva at the supracrestal attachment; GT3- Thickness of gingiva to the facial margin of the bone crest at the attached gingiva; AT1- Thickness of alveolar bone on the facial aspect at the bone crest level; AT2- Thickness of alveolar bone at the mid-point between AT1 and AT3; AT3- Thickness of alveolar bone at the junction between the coronal third and middle third of the root length.
Correlation Analyses of Gingival Measurements for Females
Correlation analyses in females revealed a significant relationship between TRAN, CW/CL, PH and all thickness parameters (p≤0.01). A very strong positive correlation was observed between TRAN and the thickness of the gingiva at different apico-coronal levels (GT1, GT2, GT3) as well as thickness of the facial alveolar bone plate at different apico-coronal levels (AT1, AT2, AT3) (r > 0.80) except for AT1 (r = 0.59). On the contrary, for PH a weak negative correlation was found for all thickness measurements (r > -0.40) except for AT1, AT2 and AT3 (r < -0.40). Moreover, CW/CL had strong correlation with all thickness values (r >0.60) except for AT1 (r =0.45) which had a moderate correlation. There was no significant correlation found between GW and all thickness parameters (r <0.08) except for GT1 and GT3 (r = 0.17, 0.14) respectively (p ≥0.01) [Table/Fig-9].
Correlation between width of GW, TRAN, CW/CL and PH with gingival and alveolar bone thickness in females.
| Parameters | Test used | GT1 | GT2 | GT3 | AT1 | AT2 | AT3 |
|---|
| GW | Pearson Correlation | 0.17** | 0.07 | 0.14** | 0.03 | 0.04 | 0.08 |
| Sig. (2-tailed) p value | <0.01 | 0.15 | <0.01 | 0.52 | 0.38 | 0.11 |
| C. I. | (0.07, 0.26) | (-0.03, -0.17) | (0.04, 0.23) | (-0.07, 0.13) | (-0.06, 0.14) | (-0.02, 0.18) |
| TR AN | Pearson Correlation | 0.83** | 0.83** | 0.8** | 0.59** | 0.87** | 0.86** |
| Sig. (2-tailed) p value | <0.01 | <0.01 | <0.01 | <0.01 | <0.01 | <0.01 |
| C. I. | (0.8, 0.86) | (0.8, 0.86) | (0.76, 0.83) | (0.52, 0.65) | (0.84, 0.89) | (0.83, 0.88) |
| CW/CL | Pearson Correlation | 0.72** | 0.72** | 0.67** | 0.45** | 0.66** | 0.65** |
| Sig. (2-tailed) p value | <0.01 | <0.01 | <0.01 | <0.01 | <0.01 | <0.01 |
| C. I. | (0.67, 0.76) | (0.67, 0.76) | (0.61, 0.72) | (0.37, 0.52) | (0.6, 0.71) | (0.59, 0.7) |
| PH | Pearson Correlation | -0.39** | -0.37** | -0.36** | -0.13** | -0.23** | -0.23** |
| Sig. (2-tailed) p value | <0.01 | <0.01 | <0.01 | <0.01 | <0.01 | <0.01 |
| C. I. | (-0.47, -0.31) | (-0.45, -0.28) | (-0.44, -0.27) | (-0.23, -0.03) | (-0.32, -0.13) | (-0.32, -0.13) |
Correlation is significant at p ≤0.01 level (2-tailed).
C.I. – Confidence interval; GW- Width of keratinized gingiva; TRAN- Transparency of the probe through gingival sulcus; CW/CL- Crown width/crown length ratio; PH- Papillary height; GT1- Thickness of gingiva at the coronal margin of the free gingiva; GT2- Thickness of gingiva at the supracrestal attachment; GT3- Thickness of gingiva to the facial margin of the bone crest at the attached gingiva; AT1- Thickness of alveolar bone on the facial aspect at the bone crest level; AT2- Thickness of alveolar bone at the mid-point between AT1 and AT3; AT3- Thickness of alveolar bone at the junction between the coronal third and middle third of the root length.
A significant correlation between the thickness of the gingiva and the alveolar bone plate was observed in females (p ≤0.01). There was a strong positive correlation between the gingival thicknesses at all levels (GT1, GT2, GT3) and the thickness of the facial alveolar bone plate at AT2 and AT3. However, there was moderate positive correlation between AT1 and thickness of the gingiva at GT1, GT2 and GT3 [Table/Fig-10].
Correlation between thickness of gingiva and alveolar bone in females.
| Parameters | Test used | GT1 | GT2 | GT3 |
|---|
| AT1 | Pearson Correlation | 0.52** | 0.47** | 0.48** |
| Sig. (2-tailed) p value | <0.01 | <0.01 | <0.01 |
| C. I. | (0.44,0.59) | (0.39,0.54) | (0.4,0.55) |
| AT2 | Pearson Correlation | 0.73** | 0.68** | 0.69** |
| Sig. (2-tailed) p value | <0.01 | <0.01 | <0.01 |
| C. I. | (0.68,0.77) | (0.62,0.73) | (0.63,0.74) |
| AT3 | Pearson Correlation | 0.73** | 0.68** | 0.68** |
| Sig. (2-tailed) p value | <0.01 | <0.01 | <0.01 |
| C. I. | (0.68,0.77) | (0.62,0.73) | (0.62,0.73) |
Correlation is significant at p <0.01 level (2-tailed).
C.I. – Confidence interval; GT1- Thickness of gingiva at the coronal margin of the free gingiva; GT2- Thickness of gingiva at the supracrestal attachment; GT3- Thickness of gingiva to the facial margin of the bone crest at the attached gingiva; AT1- Thickness of alveolar bone on the facial aspect at the bone crest level; AT2- Thickness of alveolar bone at the mid-point between AT1 and AT3; AT3- Thickness of alveolar bone at the junction between the coronal third and middle third of the root length.
Comparison of Correlation of Gingival Measurements between Males and Females
There was no correlation found between GW and GT2, AT1, AT2, AT3 in males and females (p≤0.01) except at GT1 and GT3 (r = 0.17, 0.14) in females (p≥0.01). The TRAN at GT1, GT2 and GT3 as well as thickness of the facial alveolar bone plate at AT1, AT2 and AT3 were compared. A very strong positive correlation was found in males (r > 0.8) as compared to females (r <0.8) where p≤0.01. The CW/CL at GT1, GT2 and GT3 as well as thickness of the facial alveolar bone plate at AT1, AT2 and AT3 were compared. A very weak positive correlation was found in males (r <0.2) as compared to females (r > 0.6). The PH at GT1, GT2 and GT3 as well as thickness of the facial alveolar bone plate at AT1, AT2 and AT3 were compared (p≤0.01). A moderate negative correlation was found in males (r > -0.4) as compared to females (r < -0.25) where p≥0.01. The gingival thickness GT1, GT2 and GT3 and the thickness of the facial alveolar bone plate at AT1, AT2 and AT3 were compared, a very strong positive correlation was found in males (r > 0.9, p≤0.01) as compared to females (r <0.7, p≤0.01).
Discussion
Soft and hard tissue dimensions of oral tissues are important parameters that affect the outcome of periodontal and restorative treatments, and also help in forensic dentistry. There are many factors that may influence the form and position of gingiva around the natural teeth or fixed prosthesis. Therefore, it would be useful to have reliable guidelines or surrogate objective parameters for the identification of critical cases with thin gingival and/or alveolar bone thickness, which might compromise the success of the treatment. Different parameters have been used to assess the gingival thickness or the so-called gingival biotype.
There are various methods proposed to measure gingival biotypes. These include the clinical assessment of gingival biotypes using a periodontal probe, indirect assessment with a visual estimation, direct measurement after tooth extraction, ultrasonic methods, transgingival probing, and cone beam computed tomography without reference object [12,13]
The clinical assessment of gingival biotypes using a periodontal probe was introduced by Kan JY et al., [9]. Later, same authors compared this indirect assessment with a visual estimation and a direct measurement after tooth extraction. They reported that the visual examination was found to be unpredictable and subjective, while the use of a probe translucency method can be considered as an objective method as it did not show any statistical significant difference in thickness parameters as compared to the direct measurements and may therefore be regarded as an objective method [14]. So, to overcome the limitations of accuracy while using other manual methods and cone beam computed tomography without reference object and to retain clinical applicability of results; we have used the method of probe translucency and a modified radiographic technique [15].
Very few studies are available [16-19] as summarized in [Table/Fig-11] among Indian population where the difference in gingival biotype has been assessed in different genders. So, in the current study, we have assessed the prevalence of gingival biotype in reference to gender difference.
Studies on gingival biotype in different geographical locations of India.
| Gingival biotype studies in India | Males | Females | Region of study population |
|---|
| Thick | Thin | Thick | Thin |
|---|
| Bhat V and Shetty S [16] | 63% | 37% | 41% | 59% | Mangalore, Karnataka |
| Abraham S et al. [17] | 74% | 26% | 34% | 66% | Trivandrum, Kerala |
| Manjunath RG et al. [18] | 94.6% | 5.4% | 55.3% | 44.7% | Bareilly, Uttar Pradesh |
| Rathee M et al. [19] | 58.69% | 41.3% | 40.21% | 59.78% | Rohtak, Haryana |
| Current study | 75.8% | 24.2% | 16% | 84% | Karad, Maharashtra |
In the present study, male participants had thicker gingiva which was demonstrated by concealment of the periodontal probe when compared to female. These results are in agreement with several authors [13,20] who used the probe translucency method and reported that males have a thicker gingival biotype than females. However, Shah R. reported no significant difference in gingival thickness among both the genders [21].
Additionally, the thin biotype in females was associated with long slender teeth while males showed quadratic teeth with thicker biotype which were similar to the study conducted by several authors [7,15,22]. However, contradictory results were reported by Seo HS et al., who stated that there is no statistically significant difference between longer or shorter teeth in relation to gingival biotypes [23]. The contradictory results may be due to the racial differences between Korean and Indian population.
In the present study, a decreased papillary height with thick gingival biotype was observed in males whereas an increased papillary height with a thin biotype was observed in females. The results are in accordance with the study conducted by Bhat V and Shetty S [16].
Data from the current study demonstrates a positive correlation between gingival thickness and alveolar bone thickness among both the genders. These findings are not in agreement with Kim YJ et al., who found no significant correlation between buccal bone thickness and soft tissue thickness [24]. This difference can be attributed to variations in techniques used to detect soft and hard tissue thickness parameters. On further comparison; GW, TRAN, CW/CL showed a positive correlation with thickness parameters whereas, papillary height showed a moderately negative correlation as observed by Stein JM et al. [13].
The clinical implication of this study in periodontal surgeries and implant dentistry can be emphasized. Treatment strategies can be planned based on the gingival biotype. Thinner gingival biotypes have more tendencies for gingival recession while thicker gingival biotype is more resistant to abusive forces that lead to recession and helps in camouflaging the margins of the restorations and the titanium implant shadows. Additionally, predictable hard and soft tissue healing can be expected in thicker form of gingival tissue.
Limitation and future prospects
The limitation of this study was non-consideration of buccolingual tooth position which may influence the gingival biotype and thickness of alveolar bone. Future studies including various ethnic races, different age groups and advanced radiographic techniques would aid in formulating promising conclusion.
Conclusion
Within limitations of the present study following conclusions were drawn, the morphometric and radiographic methods are predictable and objective to detect the gingival and alveolar bone thickness. Males had thick gingival biotype with decreased papillary height as compared to females, who had a thin gingival biotype with increased papillary height. The alveolar bone thickness was directly proportional to the gingival thickness in both the genders. This accurate knowledge of gingival biotype would help the clinicians in aesthetic, restorative and implant dentistry.
GW- Width of keratinized gingiva; TRAN- Transparency of the probe through gingival sulcus; CW/CL- Crown width/crown length ratio; PH- Papillary height; GT1- Thickness of gingiva at the coronal margin of the free gingiva; GT2- Thickness of gingiva at the supracrestal attachment; GT3- Thickness of gingiva to the facial margin of the bone crest at the attached gingiva; AT1- Thickness of alveolar bone on the facial aspect at the bone crest level; AT2- Thickness of alveolar bone at the mid-point between AT1 and AT3; AT3- Thickness of alveolar bone at the junction between the coronal third and middle third of the root length.
**Correlation is significant at p ≤0.01 level (2-tailed).
C.I. – Confidence interval; GW- Width of keratinized gingiva; TRAN- Transparency of the probe through gingival sulcus; CW/CL- Crown width/crown length ratio; PH- Papillary height; GT1-Thickness of gingiva at the coronal margin of the free gingiva; GT2- Thickness of gingiva at the supracrestal attachment; GT3- Thickness of gingiva to the facial margin of the bone crest at the attached gingiva; AT1- Thickness of alveolar bone on the facial aspect at the bone crest level; AT2- Thickness of alveolar bone at the mid-point between AT1 and AT3; AT3- Thickness of alveolar bone at the junction between the coronal third and middle third of the root length.
**Correlation is significant at p <0.01 level (2-tailed).
C.I. – Confidence interval; GT1- Thickness of gingiva at the coronal margin of the free gingiva; GT2- Thickness of gingiva at the supracrestal attachment; GT3- Thickness of gingiva to the facial margin of the bone crest at the attached gingiva; AT1- Thickness of alveolar bone on the facial aspect at the bone crest level; AT2- Thickness of alveolar bone at the mid-point between AT1 and AT3; AT3- Thickness of alveolar bone at the junction between the coronal third and middle third of the root length.