Oral mucosa is subject to constant abrasion which may lead to its layers being sequentially sloughed off and consequent exposure of basement membrane. However, this does not happen as the oral epithelium maintains its structural integrity through constantly differentiating cells that repopulate different layers [1]. Defects in this process can lead to developmental abnormalities as well as cancerous growth [2].
MNi are small extranuclear bodies formed during mitosis and are comprised of faulty parts of the chromatids or chromosomes lagging behind in anaphase. They are the consequence of failure of microtubular attachment and subsequent pulling in an altered direction as compared to normal chromosome. This results in their envelopment as an extra nucleus in one of the daughter cells [3,4].
MNi result from non disjunction of chromosomes, breakage of an anaphase bridge, chromatid fragments resulting from incorrectly repaired or unrepaired DNA breaks, from acentric chromatids, repeat sequence hypomethylation in pericentromeric DNA, kinetochore protein anomalies or their assemblage, spindle apparatus dysfunction, or faulty anaphase checkpoint genes [3,4].
These myriad changes are brought in the cells by various genotoxic agents such as betel quid/areca nut and tobacco [5]. The level of baseline chromosomal damage in untreated cancer patients and in various OPMDs is much higher than in cancer free controls. Hence, MNi score can be used as a biomarker to identify various OPMDs much prior to the manifestations of their clinical features [6].
Several staining methods are applied for identification of MNi, some being DNA specific (Feulgen, Acridine orange) and others non DNA specific (Giemsa, MGG, PAP) [7]. All the staining methods have their own advantages and disadvantages related to MNi evaluation and a wide range of baseline MNi values have been reported regardless of the staining method used making the comparison of MNi frequency more confusing [8].
The study was therefore undertaken to evaluate the MNi frequency in normal mucosa, in individuals using various tobacco forms without oral leukoplakia, individuals using various tobacco forms with oral leukoplakia and areca nut chewers with OSMF using three different stains.
Materials and Methods
This prospective study was undertaken at I.T.S Dental College, Hospital and Research Centre, Greater Noida, India, for the duration of one year (2014-2015). Fifty healthy individuals in the age group of 30-60 years without having any objectionable oral mucosal lesion or without any systemic disease were included in the study as control group. Individuals in the age range of 30-60 years, tobacco or areca nut chewers with clinically confirmed oral leukoplakia and OSMF respectively from last five years were recruited in the study. Individuals with any systemic disease or any other concomitant oral lesions other than oral leukoplakia or OSMF and those undergoing treatment were excluded from the study. Three smears were prepared from each volunteer and were stained with PAP, MGG and Feulgen stain respectively. An informed consent from all the volunteers and Institutional Ethical Committee clearance was taken before the commencement of the study.
Collection of the Exfoliated Cells
While collecting the exfoliated buccal mucosal cells, the site of the smear was located and wiped with cotton, moistened in normal saline to remove any surface coatings. Exfoliated cells were obtained by scrapping the oral mucosa with a wooden spatula. The scraped cells were placed on the clean glass slides and three smears were prepared from each patient. The smears were fixed with 90% ethyl alcohol. All the cytological smears were stained by PAP technique, MGG technique and Feulgen technique. From each slide, 10 high power fields were examined under the 10X magnification where cells with MNi were located; they were examined under the 40X magnification.
Counting of Micronuclei
After proper staining, the slides were observed under light microscope for PAP, MGG and Feulgen stains using low magnification (10X) for screening and high magnification (40X) for counting MNi in zigzag method out of 10 high power fields. Counting of MNi was done according to PE Tolbert, (1992) criteria [9].
Statistical Analysis
Data was entered into Microsoft Excel spreadsheet and then checked for any missing entries. It was analysed using Statistical Package for Social Sciences (SPSS) version 21.0.
The data between cases and control groups was analysed by Kruskal-Wallis Test. The comparison between two independent groups was done by Mann Whitney U test and the individual p-value of different groups was obtained. Interstain comparison between cases and control was done by Wilcoxon signed rank test and the individual p-value was obtained. A p-value <0.05 was considered as statistically significant.
Results
In the present study, overall intergroup comparison [Table/Fig-1] revealed maximum mean MNi in Group III (Tobacco chewers with oral leukoplakia) and Group IV (areca nut chewers with OSMF) than in Group I (Normal Oral Mucosa) and Group II (Tobacco chewers without oral leukoplakia), whereas in Group IV using PAP stain mean MNi frequency was higher than in Group III.
The overall intergroup comparison of mean MNi count using three different stains.
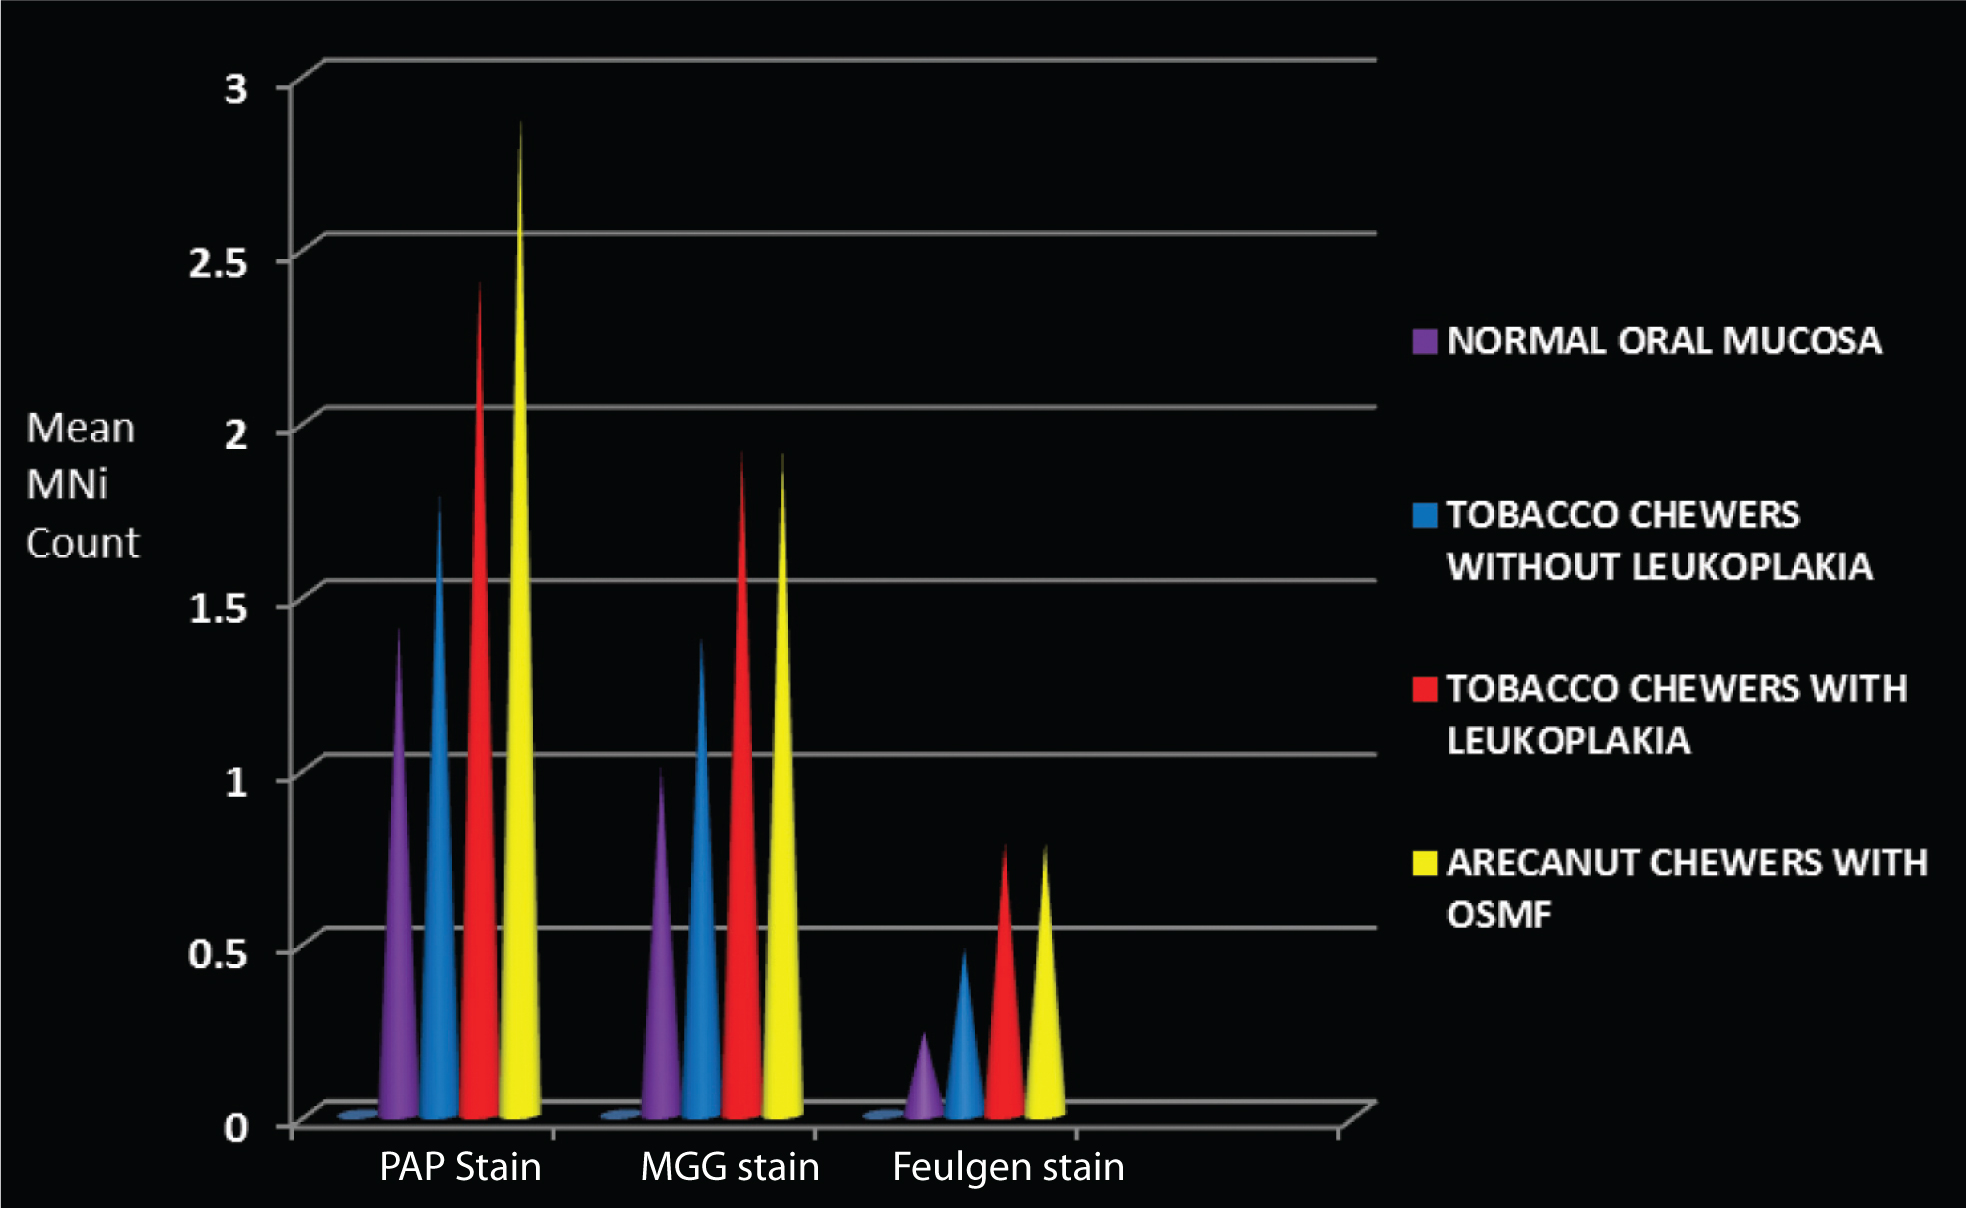
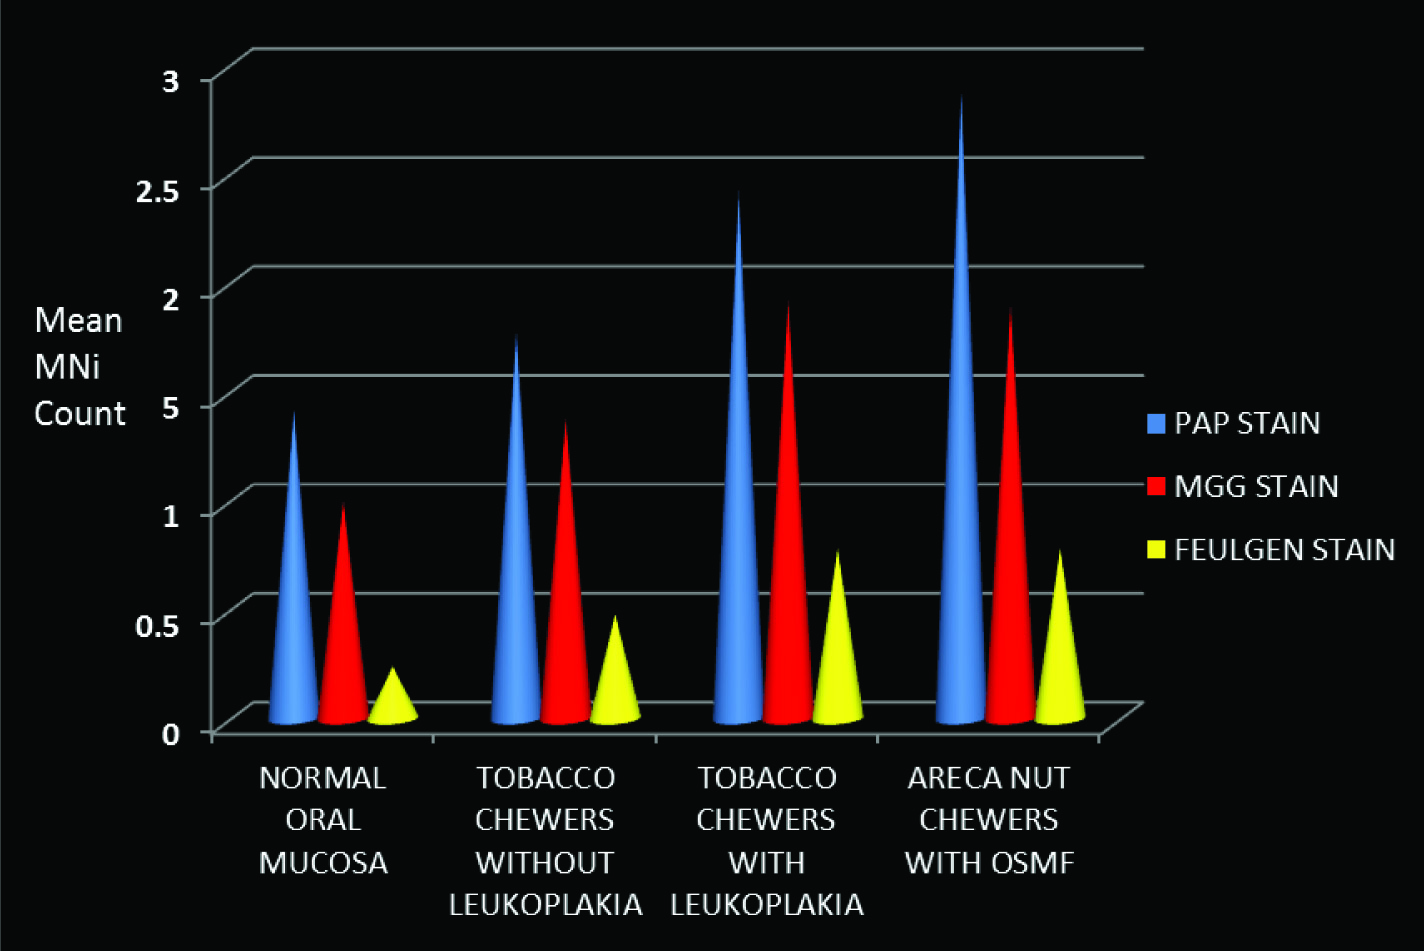
The overall interstain comparison revealed maximum mean MNi frequency using PAP stain followed by MGG stain and Feulgen stain in all the four groups [Table/Fig-2].
The overall Interstain comparison of mean MNi count within the groups.
On comparison of MNi frequency between cases and control for PAP stain, highest mean MNi was seen in Group IV [Table/Fig-3]. The overall intergroup comparison between Group I, Group II, Group III and Group IV using PAP stain was found to be statistically significant [Table/Fig-3].
Comparison of micronuclei frequency between cases and control for PAP stain by Kruskal-Wallis test.
| Stain | Groups | N | Mean ± SD | Minimum | Maximum |
|---|
| PAP stain | I | 50 | 1.42 ± 1.10 | 0 | 3 |
| II | 50 | 1.78 ±0.737 | 0 | 4 |
| III | 50 | 2.42 ±0.992 | 1 | 6 |
| IV | 50 | 2.88 ± 1.06 | 1 | 6 |
p-value<0.001
p-value<0.05 is considered to be statistically significant.
The comparison between two independent groups for PAP stain using Mann Whitney U Test [Table/Fig-4] was found to be statistically significant (p-value<0.05).
Comparison of micronuclei frequency between cases and control for PAP stain by Mann Whitney U Test for two independent groups.
| Groups | Mean rank | Mann Whitney U | p-value |
|---|
| III | 44.9956.01 | 974.50 | 0.04 |
| IIII | 38.3662.64 | 643.00 | <0.001 |
| IIV | 34.2966.71 | 439.50 | <0.001 |
| IIIII | 41.3459.66 | 792.00 | <0.001 |
| IIIV | 35.6865.32 | 509.00 | <0.001 |
| III | 44.5256.48 | 951.00 | 0.02 |
It was observed that MNi count during intergroup comparison using PAP stain was of higher order in Group III and Group IV whereas in Group I and Group II, it was of lower order [Table/Fig-1].
On comparison of MNi frequency between cases and control for MGG stain, highest mean MNi was seen in Group III [Table/Fig-5]. The overall intergroup comparison between Group I, Group II, Group III and Group IV using MGG stain to detect MN was found to be statistically significant [Table/Fig-5].
Comparison of micronuclei frequency between cases and control for MGG stain by Kruskal-Wallis test.
| Stain | Groups | N | Mean ± SD | Minimum | Maximum |
|---|
| MGG stain | I | 50 | 1.00 ± 0.926 | 0 | 3 |
| II | 50 | 1.38 ±0.725 | 0 | 4 |
| III | 50 | 1.92 ±0.944 | 0 | 5 |
| IV | 50 | 1.90 ± 0.839 | 1 | 4 |
p-value =0.02
p-value < 0.05 is considered to be statistically significant.
The comparison between two independent groups for MGG stain using Mann-Whitney U Test [Table/Fig-6] was found to be statistically significant (p-value<0.05).
Comparison of micronuclei frequency between cases and control for MGG stain by Mann-Whitney U Test for two independent groups.
| Groups | Mean rank | Mann Whitney U | p-value |
|---|
| III | 43.7957.21 | 914.50 | <0.001 |
| IIII | 37.9563.05 | 622.50 | <0.001 |
| IIV | 37.6463.36 | 607.00 | <0.001 |
| IIIII | 42.5858.42 | 854.00 | 0.03 |
| IIIV | 42.4258.58 | 846.00 | 0.03 |
| IIIIV | 50.7650.24 | 1237.00 | <0.001 |
It was observed that MNi count during intergroup comparison using MGG stain was of slightly higher order in Group III and Group IV whereas in Group I and Group II it was of lower order [Table/Fig-1].
On comparison of MNi frequency between cases and control for Feulgen stain, mean MN frequency was highest in Group III and IV [Table/Fig-7]. The overall intergroup comparison between Group I, Group II, Group III and Group IV using Feulgen stain to detect MN was found to be statistically significant [Table/Fig-7].
Comparison of micronuclei frequency between cases and control for Feulgen stain by Kruskal-Wallis test.
| Stain | Groups | N | Mean ± SD | Minimum | Maximum |
|---|
| Feulgen stain | I | 50 | 0.24 ±0.431 | 0 | 1 |
| II | 50 | 0.48±0.505 | 0 | 1 |
| III | 50 | 0.78±0.465 | 0 | 2 |
| IV | 50 | 0.78±0.465 | 1 | 2 |
p-value = 0.01
p-value < 0.05 is considered to be statistically significant.
The comparison between two independent groups for Feulgen stain using Mann-Whitney U Test [Table/Fig-8] was found to be statistically significant (p-value<0.05).
Comparison of micronuclei frequency between cases and control for Feulgen stain by Mann-Whitney U Test for two independent groups.
| Groups | Mean rank | Mann Whitney U | p-value |
|---|
| III | 44.5056.50 | 950.00 | <0.001 |
| IIII | 37.3863.62 | 594.00 | <0.001 |
| IIV | 37.3863.62 | 594.00 | <0.001 |
| IIIII | 43.2657.74 | 888.00 | 0.03 |
| IIIV | 43.2657.74 | 888.00 | 0.03 |
| IIIIV | 50.5050.50 | 1250.00 | <0.001 |
It was observed that MNi count during intergroup comparison using Feulgen stain was of higher order in Group III and Group IV whereas in Group I and Group II, it was of lower order [Table/Fig-1].
Interstain comparison of MNi frequency in Group 1, Group II, Group III and Group IV by Wilcoxon’s signed rank test was considered to be statistically significant [Table/Fig-9]. A p-value<0.05 was considered to be statistically significant.
Interstaining comparison of micronuclei frequency between cases and control by Wilcoxon’s signed rank test.
| Groups | MGG - PAP stain (p-value) | Feulgen - PAP stain (p-value) | Feulgen stain- MGG Stain (p-value) |
|---|
| I | <0.001 | <0.001 | <0.001 |
| II | 0.02 | <0.001 | <0.001 |
| III | <0.001 | <0.001 | <0.001 |
| IV | 0.02 | <0.001 | <0.001 |
p-value < 0.05 was considered to be statistically significant.
Intragroup comparison of varying stains revealed statistically significant results between all the groups by Mann-Whitney U Test [Table/Fig-4,6,8]. The results of different stains have been depicted in [Table/Fig-10].
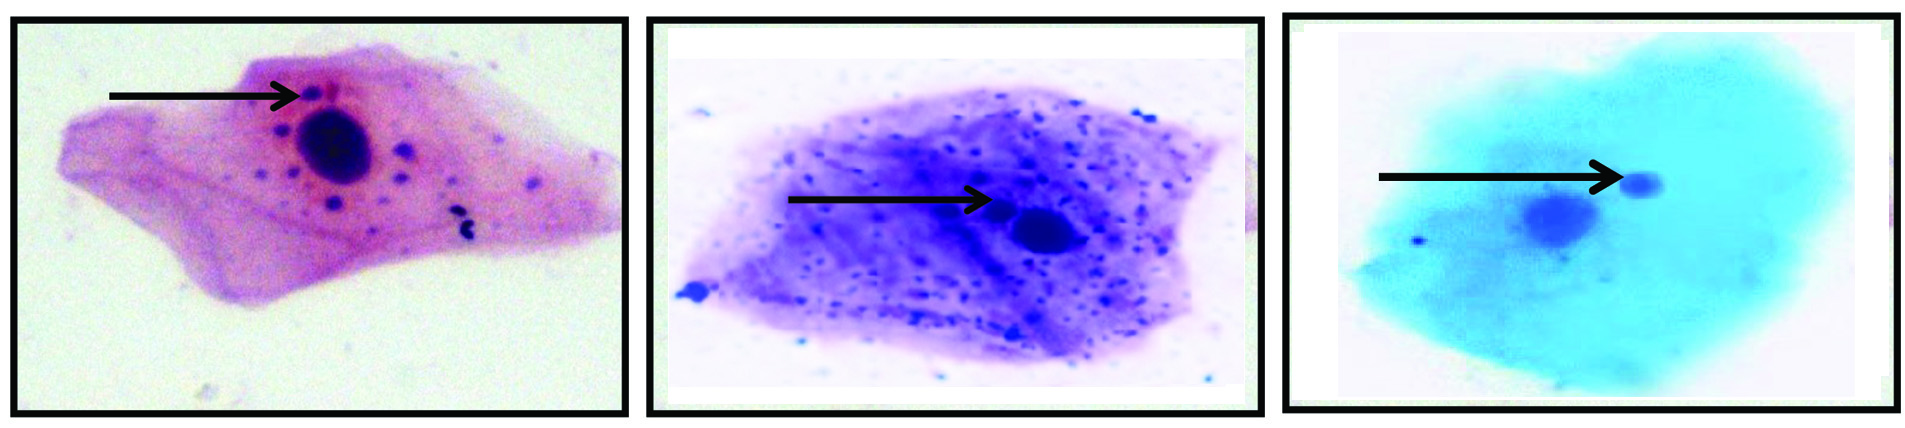
Photomicrograph representing epithelial squame with micronuclei: (a) PAP stain (40X); (b) MGG stain; 40X); (c) Feulgen stain; 40X).
Discussion
As MNi is considered as an upcoming marker for genotoxic damage, the present study was conducted to observe the biological potential of tobacco chewing and areca nut chewing on MNi using three different stains. However, staining methods themselves may cause significant variations [10]. The composition of stains and their methodology varies in different laboratories even in similar studies. The methods most commonly employed are Feulgen green (52.2%), MGG (23.9%), Acridine Orange (19.6%) and. PAP stain [11].
PAP stain was included in the present study as it is considered to be the best staining technique for cytological smears since it provides a polychromatic, transparent staining reaction with crisp nuclear and cytoplasmic features [12].
Almeida JD et al., also justified the use of PAP stain in exfoliative cytology because it permits the demonstration of differences between cells of various epithelial layers, in agreement with its indication for the early diagnosis of carcinoma and other diseases [13]. While evaluating PAP stain for the determination of MNi frequency the mean MNi count using PAP stain was higher in individuals with OPMDs and these findings were in similar range with the study conducted by Palve DH and Tupkari JV [14].
While for Giemsa stain it is said that “the stains applications likewise are diverse and numerous. To the hematologist, the Wright Giemsa stain is a sine qua non; its meticulous execution is critical to diagnostic accuracy. To the cytologist, it is a “revealer of secrets that expose hidden cellular details” [15]. Many authors like O’Driscoi MC et al., Mozdarani H et al., Fenech M et al., Sellappa S et al., supported the use of Giemsa stain for detection of MNi in cytological smears [16-19]. In the present study, the mean MNi count using MGG stain was higher in individuals with OPMDs. This finding was within similar range in normal and leukoplakia group in the study conducted by Desai SS et al., [20]. But the value in OSCC and even in leukoplakia, was found to be higher in the study conducted by Sivassankari PN et al., and Dindgire SL et al., [21,22]. These findings suggest that mean MNi count in MGG stain can significantly differentiate the tobacco chewers without oral leukoplakia from the tobacco chewers with oral leukoplakia and areca nut chewers with OSMF. Similar finding was in concordance with Bloching M et al., Halder A et al., [23,24], while discussing the justification of Giemsa and MGG staining for MNi evaluation a great confusion is always present so different stains are also tried for MNi evaluation [25].
Idris AA and Hussain MS compared the staining ability of PAP and Giemsa in cytological smear on the basis of four parameters [26]. In the result, PAP stain was found to be better and scored higher than Giemsa in all four parameters.
Though PAP and MGG stain were found to be efficient in detecting MNi and effectively differentiating normal group (control) from tobacco chewers without oral lesion and potentially malignant disorders, but these two stains are DNA non specific stains. For the proper assessment of MNi Thomas D et al., supported the use of DNA-specific fluorescent-based stains such as propidium iodide, DAPI Feulgen, Hoechst 33258 [27]. Thus, Feulgen stain was recommended as permanent slides can be obtained that can be viewed under both transmitted and/or fluorescent light conditions [27]. In this study, mean MNi count using Feulgen stain was higher in individuals with OPMDs. All the findings were supported by Casartelli G et al., Kamboj M and Mahajan S, Jois HS et al., [28-30].
Holland N et al., also admitted the fact DNA specific stains are preferred for staining nuclei, MNi and other nuclear abnormalities in buccal exfoliated cells [31]. Ayyad SB et al., and Bouter R et al., did not support the use of Feulgen stain for MNi analysis under field condition for the reason i.e., long staining time (>4 hours) and at the same time its method of fixation is more difficult [32,33]. The staining components are expensive and this stain alone can’t delineate the cytoplasm; it needs 1% light green to demarcate the cytoplasm and also the hydrolysis is the critical part in Feulgen staining.
While statistically assessing the efficacy of different staining techniques, it was found that for differentiation between apparently normal mucosa (both normal controls and tobacco chewers without oral leukoplakia) and potentially malignant disorders (tobacco chewers with oral leukoplakia and areca nut chewers with OSMF) PAP stain had maximum mean MNi count.
Though MGG was found to be statistically important for MNi analysis but the obtained values should be reconsidered because it is found in this study that MGG staining produces significant over count of the mean values of MNi when compared to DNA specific stain. To reason out Nyrsesyan et al., indicated the increased MNi frequencies were significantly associated with certain other nuclear abnormalities such as karyorrhexis [34]. karyolysis, binucleation and condensed chromatins. They also suggested that the formation of the keratin bodies and of the nuclear anomalies are adaptive response of cell and can cause overestimation of MNi formation with nonspecific stain like Giemsa and PAP. Over estimation of MNi count in exfoliated cytology using Giemsa and MGG stain was also supported by many other authors like Dias VM et al., Casartelli G et al., Nersesyan A et al., Hayashi M et al., [10,28,34,35].
Thus, on the frequency based analysis, PAP scored a very well acceptable position statistically. These values help us to draw an inference that general cytological slides stained with PAP stain can be evaluated for MNi count routinely and if significant alterations are found, these samples can be subjected to special DNA specific stains for MNi evaluation and further confirmation.
The increased MNi frequency observed with DNA nonspecific stains (PAP and MGG) can be due to misinterpretation of nuclear anomalies like karyorrhexis, karyolysis, condensed chromatin, and binucleates as MNi, formation of keratin granules that are found in degenerated cells with nuclear anomalies, contamination by the bacteria that are commonly found in the mouth can interfere with MNi scoring, small dye granules that may sometimes resemble MNi but usually have a slightly different refractility and colour intensity.
Limitation
Sample size of the study was small so a quantitative assessment of MNi count in various OPMDs using a larger sample size is necessary.
Conclusion
MNi is a potential biomarker for oral leukoplakia and OSMF as a significant increase in the count was observed from normal to potentially malignant disorders through tobacco chewers without oral leukoplakia in the exfoliated cells and the best staining quality for detecting MNi was found to be with PAP stain as on interstain comparison mean MNi frequency in all the four groups was higher with PAP stain followed by MGG stain and were least with Feulgen stain.
The order of efficacy to detect the presence of MNi of different stains in our study was:- PAP stain > MGG stain > Feulgen stain.
The mean MNi count was higher with DNA nonspecific stains that are PAP stain and MGG stain and this overcount can be attributed to nonspecific staining of cellular components such as inclusion bodies, bacterial components and even stain granules.
Therefore, a quantitative assessment of MNi count in various OPMDs using a larger sample size is necessary.
p-value<0.001p-value<0.05 is considered to be statistically significant.
p-value =0.02p-value < 0.05 is considered to be statistically significant.
p-value = 0.01p-value < 0.05 is considered to be statistically significant.
p-value < 0.05 was considered to be statistically significant.