Although, various contributing factors to crowding have been reported in literature like evolution, genetics, environment, clinical characteristics like teeth size [2-5] and shape [6], arch length, inter canine width, intermolar width [7-10] etc., but the condition is still not fully understood. Also, crowding is often related to arch dimensions, but only few studies evaluated the relationship between crowding and cephalometric measurements [11-13] and apparently, there are very few studies that evaluated the relationship between apical base length and dental crowding [14].
Determination of etiology of crowding could have a significant effect on treatment planning and prognosis of Class II malocclusion. Therefore, the aim of this study was to find possible factors associated with mandibular crowding in Class II div. 1 malocclusion.
Materials and Methods
Data Acquisition
The sample was retrospectively selected from the records of Department of Orthodontics and Dentofacial Orthopedics, College of Dental Sciences, Davangere, Karnataka, India. Pre-treatment lateral cephalograms and study models of 60 patients with Class II malocclusion were collected. Sample size was determined using G power 3.1.9.2 software (effect size-0.35, alpha error-0.05, power of the study-80%).
Selection Criteria
The inclusion criteria for the study sample where patients with chronological age between 11 to 18 years having Angle’s Class II div. 1 malocclusion, presence of all permanent teeth up to first molars, fully erupted occlusion without missing, impacted or supernumerary teeth and absence of any severe tooth attrition or large restorations that could compromise the mesiodistal dimension of a tooth. All the patients with Class II div. 2 malocclusions, open bite or cross bite, large carious lesions, dental anomalies of number, size and form and patients with any oral habits like thumb sucking, lip sucking etc. and with any orthognathic surgery, syndromes or significant asymmetries were excluded from the study.
Methodology
A total of 60 patients (29 males, 31 females) who satisfied the selection criteria were selected. Pre-treatment lateral cephalogram and dental casts of selected subjects were obtained from the record room of Department of Orthodontics and Dentofacial Orthopedics, College of Dental Sciences, Davangere, India. The lateral head films were selected on the basis of excellence of image quality and ability to locate landmarks with a considerable degree of accuracy. All the lateral head films were traced and measurements were performed on lateral head films and pre-treatment dental casts. All angular measurements on the tracings were performed with a protractor, with interpolation to 0.5° and all linear measurements were performed with an enlarged scale ruler that allowed measurements to 0.5 mm.
Dental Cast Measurements
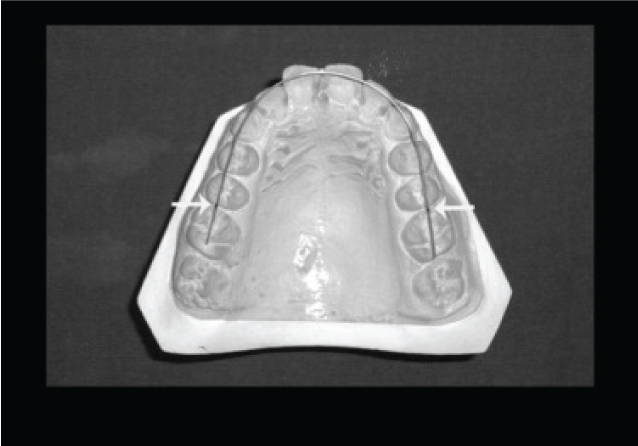
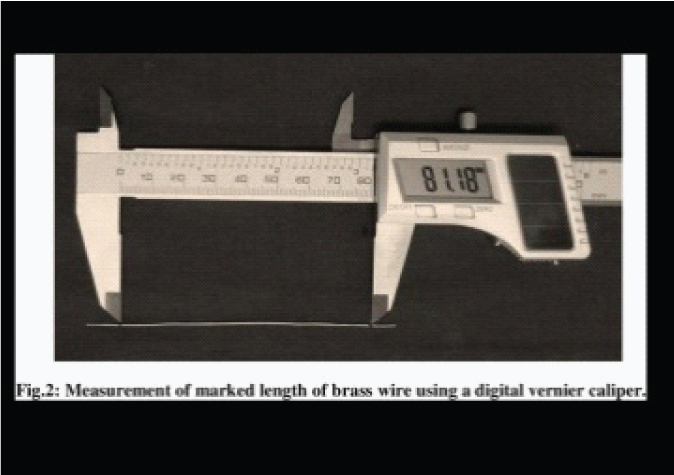
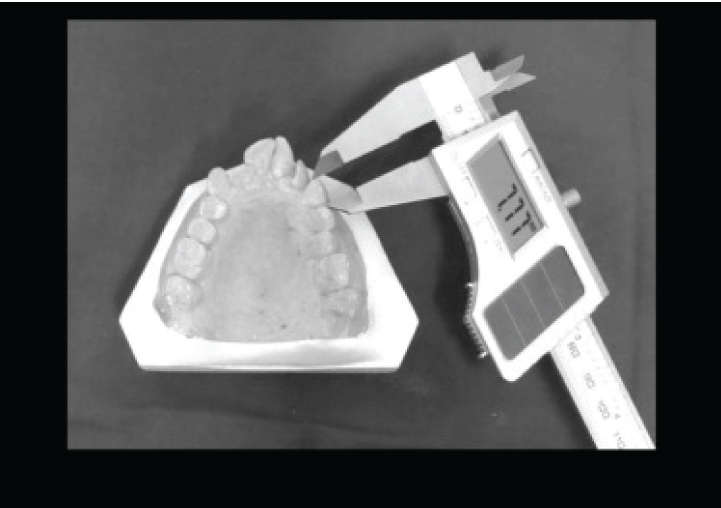
Mandibular and maxillary crowding were calculated as the difference between arch perimeter and the sum of tooth widths from the second premolar to the second premolar on the other side, in millimetres and calculated by a single examiner. Arch perimeter was measured using brass wire [Table/Fig-1], [Table/Fig-2] and tooth width measurement was done using a digital vernier caliper [Table/Fig-3].
Arch perimeter measurement using soft brass wire.
Measurement of marked length of brass wire using a digital vernier caliper.
Tooth width measurement using digital vernier caliper.
To minimize the measurement error on study models, duplicate measurements were made by a single calibrated examiner [15] by means of digital caliper to the nearest 0.1 mm. Second measurements were done after finishing with all the first measurements from right second premolar to left second premolar in each arch. In doing so, it was expected that the first measurement would not bias the second.
When first and second measurements differed by more than 0.2 mm, the tooth was remeasured and this third measurement was then registered. If the difference between both measurements was less than 0.2 mm, then the first measurement was registered.
Mandibular and maxillary crowding were calculated as the difference between arch perimeter and the sum of tooth widths from the second premolar to the second premolar on the other side, in millimetres and calculated by a single examiner. In a well-aligned arch, arch perimeter was equal to the sum of the tooth widths [16]. Negative values indicated crowding.
The sample was divided into two groups according to severity of pretreatment mandibular crowding.
Group I consisted of 30 patients (14 males, 16 females) with a mean age of 13.76 years (SD=1.89; range 11-18 years) and mandibular crowding ≥3 mm.
Group II consisted of 30 patients (15 males, 15 female) with a mean age of 13.85 years (SD=1.91; range 11-18 years) and mandibular crowding <3 mm.
Lateral Cephalogram Measurements
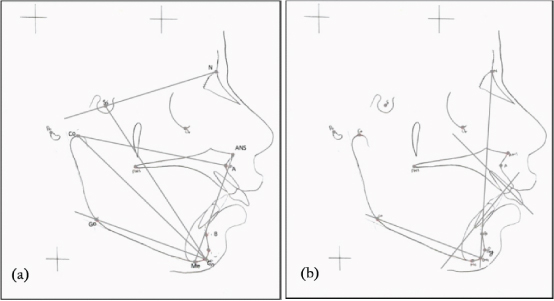
All lateral head films of the selected individuals were viewed under standardized conditions and traced on to acetate overlays with 0.3 mm HB lead pencil by hand by one observer. Reference points and planes were then recorded and measurements were made [Table/Fig-4a,b]. The landmarks used and their definitions [17] and variables measured are listed in [Table/Fig-5].
(a): Cephalometric variables measured; skeletal parameters: Co-A, Co-Gn, ANS-Me, Go-Gn to SN, Y- axis (N-S-Gn); (b): Cephalometric variables measured; dental parameters: L1 to NB, L1 to Go-Gn, interincisal angle (U1 to L1).
Landmarks used and variables measured.
| S. No. | Landmark | Name | Description |
|---|
| 1. | N | Nasion | The most anterior limit of the frontonasal suture. |
| 2. | S | Sella | The geometric center of the sella turcica. |
| 3. | Or | Orbitale | Lowest point on the inferior rim of the orbit. |
| 4. | Po | Porion | Most superiorly positioned point of external auditory meatus |
| 5. | ANS | Anterior nasal spine | The tip of the bony anterior nasal spine |
| 6. | Co | Condylion | The most superior point on the condylar head. |
| 7. | A | Point A | Most posterior midline point in the concavity between the anterior nasal spine and prosthion. |
| 8. | B | Point B | Most posterior midline point in the concavity of the mandible between the most superior point on the alveolar bone overlying the lower incisors (infradentale) and pogonion. |
| 9. | Go | Gonion | A point on the curvature of the angle of mandible located by bisecting the angle formed by the lines tangent to posterior ramus and inferior border of mandible. |
| 10. | Pg | Pogonion | The most anterior point on the chin. |
| 11. | Me | Menton | Lowest point on the symphyseal shadow of mandible seen in lateral cephalogram. |
| 12. | Gn | Gnathion | A point located by taking the midpoint between the anterior (pogonion) and the inferior point (menton) of bony chin. |
| Variables Description |
| Skeletal parameters measured- |
| 13. | Co-A | Effective maxillary length | Measured from condylion to point A |
| 14. | Co-Gn | Effective mandibular length | Measured from condylion to Gnathion |
| 15. | ANS- Me | Lower anterior face height (LAFH) | Measured from anterior nasal spine to menton. |
| 16. | Go-Gn to SN | Mandibular plane angle (MPA) | Angle between anterior cranial base (SN plane) and mandibular plane. |
| 17. | N-S-Gn | Y- axis | Angle between SN plane and S-Gn line. |
| Dental parameters measured- |
| 18. | L1 to NB | Axial inclination of lower incisor | Angle between long axis of lower central incisor and NB line. |
| 19. | L1 to Go- Gn | Inclination of lower incisor to mandibular plane | Angle between long axis of lower central incisor and GoGn plane. |
| 20. | U1 to L1 | Interincisal angle | Angle between long axis of maxillary and mandibular incisor. |
To determine the errors associated with measurements, 30 radiographs (15 of each group) were selected randomly. Their tracings and measurements were repeated four weeks after the first measurement and intraobserver reliability was determined using multi observer Kappa coefficients. Kappa coefficient value for different parameters measured is given in [Table/Fig-6]. Intraobserver reliability for different parameters ranged from 0.90-0.99 suggesting high degree of conformity in measurements within examiner.
Kappa coefficient value of the variables measured.
| Variables | Kappa Coefficient |
|---|
| Co-A | 0.92 |
| Co-Gn | 0.90 |
| MPA | 0.98 |
| Y axis | 0.97 |
| LAFH | 0.97 |
| L1 to NB | 0.99 |
| L1 to GoGn | 0.98 |
| U1 to L1 | 0.96 |
Statistical Analysis
Intergroup compatibility for age distribution was evaluated with t-test. The mean and standard deviations were computed for each measurement. Unpaired t-test was used to compare the measurements between two groups. Relationship between different measurements was investigated with Pearson correlation coefficient. All statistical analysis was performed using Statistical Package for Social Sciences software package (SPSS for Windows-Version 17.0).
Results
The groups were compatible in terms of age distribution [Table/Fig-7]. Mean age for Group I was 13.77±1.89 years and for Group II was 13.85±1.95 years. No statistical significant difference was found between the two groups (p=0.867).
Compatibility between the groups: age (t- test).
| GROUP I (n=30) Crowding ≥3 mm (males=14, females=16) | GROUP II (n=30) Crowding <3 mm (males=15, females=15) | |
|---|
| Mean | SD | Mean | SD | p-value |
| Age | 13.77 | 1.89 | 13.85 | 1.95 | 0.867 NS |
NS : Non significant,
*p < 0.05 (significant),
**p < 0.001(highly significant)
According to the selection criteria, there were highly significant intergroup differences in mandibular crowding [Table/Fig-8].
Intergroup comparison concerning the amount of crowding.
| Variables | Group I | Group II | | |
|---|
| Mean | SD | Mean | SD | Difference | p-value |
|---|
| Mandibular crowding | 6.21 | 2.66 | 1.11 | 0.96 | 5.1 | <0.001** |
| Maxillary crowding | 3.67 | 3.36 | 0.77 | 1.23 | 2.9 | <0.001** |
NS : Non significant,
*p < 0.05 (significant),
p < 0.001(highly significant)
Statistical Comparison of the Groups
Statistical comparison of the groups is shown in [Table/Fig-9] and [Table/Fig-10].
T-test intergroup comparison of the measured skeletal parameters.
| Variables | Group I | Group II | | |
|---|
| Mean | SD | Mean | SD | Difference | p-value |
|---|
| Maxillary length | 89.7 | 4.3 | 89.3 | 4.8 | 0.47 | 0.694 NS |
| Mandibular length | 104.8 | 3.7 | 108.38 | 5.1 | -3.58 | 0.004* |
| MPA | 27.75 | 6.75 | 26.17 | 5.4 | 1.58 | 0.32 NS |
| Y-Axis | 67.15 | 3.83 | 66.43 | 4.03 | 1.02 | 0.483 NS |
| LAFH | 65.43 | 5.6 | 64.5 | 3.6 | 0.93 | 0.53 NS |
NS: Non significant,
p<0.05 (significant),
**p<0.001(highly significant)
The t-Test intergroup comparison of the measured dental parameters.
| Variables | Group I | Group II | | |
|---|
| Mean | SD | Mean | SD | Difference | p-value |
|---|
| L1 to NB | 29.77 | 6.79 | 29.45 | 8.59 | 1.99 | 0.875 NS |
| L1 to Go-Gn | 106.37 | 7.93 | 107.2 | 6.88 | 1.92 | 0.665 NS |
| Interincisal angle | 112.23 | 12.65 | 112.05 | 12.97 | 0.183 | 0.956 NS |
NS: Non significant,
*p < 0.05 (significant),
**p < 0.001(highly significant)
Skeletal Parameters
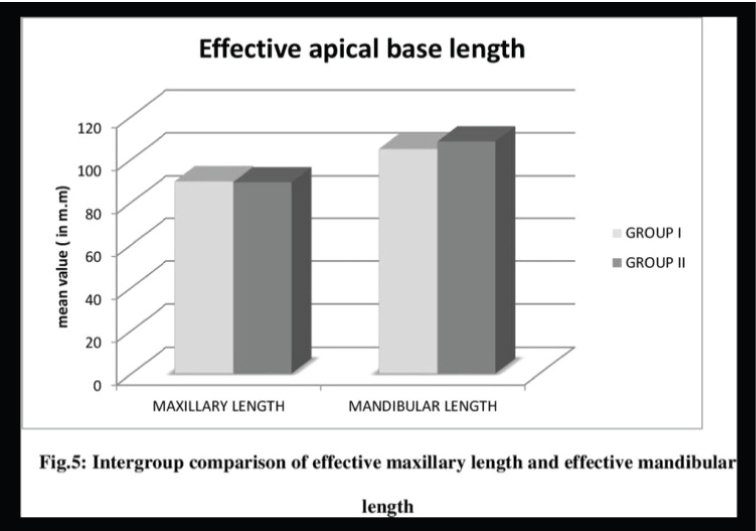
The mean, SD values, mean difference value, p value, of the all skeletal variables measured are shown in [Table/Fig-9]. Among the skeletal parameters measured, only effective mandibular length (Co-Gn) exhibited statistically significant difference between the groups at p<0.05 level. Group I showed smaller values of effective mandibular length (mean=104.8±3.7 mm) than Group II (mean=108.38±5.1 mm) [Table/Fig-11]. No statistical significant difference was found between the two groups (p>0.05) for effective maxillary length, Mandibular Plane Angle (MPA), Y- axis and Lower Anterior Face Height (LAFH). Mean value of effective maxillary length [Table/Fig-11] for Group I was 89.7±4.3 mm and for Group II was 89.3±4.8 mm. Even though the MPA for Group I (mean=27.750±6.750) was slightly higher than Group II (mean=26.170±5.40), it was not statistically significant. Similarly, mean value of Y- axis for Group I was 67.150±3.830 and for Group II was 66.430±4.030, which was also non-significant. LAFH was also found to be non-significant for the two groups with mean value of 65.43±5.6 mm and 64.5 mm±3.6 mm for Group I and Group II respectively.
Intergroup comparison of effective maxillary length and effective mandibular length.
Dental Parameters
The mean, SD values, mean difference value, p value, of the all dental variables measured are shown in [Table/Fig-10]. Mean value of L1 to NB for group I was 29.770±6.790 and for Group II was 29.450±8.590. Mean value of L1 to GoGn for Group I was 106.370 ±7.930 and for Group II was 107.20±6.880. Also, mean interincisal angle value for both the groups was almost same, with mean value of 112.230±12.650 for Group I and of 112.050±12.970 for Group II. No statistically significant difference was found between the two groups for any of the dental parameters (p>0.05).
Correlations of the Measurements
Correlations of the measurements are shown in [Table/Fig-12]. Significant inverse correlation was found between mandibular crowding and the effective mandibular length (r=-0.290; p<0.05). Inverse correlation was also found between maxillary crowding and effective mandibular length (r=-.193) but it is statistically insignificant (p=0.14). Also, moderate to strong positive correlations was found between maxillary and mandibular crowding and between maxillary and mandibular effective lengths which were highly significant (p<0.001). No correlation was found between facial growth direction parameters (MPA, LAFH, Y-axis) or any of the dental parameters and mandibular crowding.
Correlations between various parameters measured (Pearson Correlations).
| Parameters | r | P |
|---|
| Mand. Crowding X Max. length | 0.086 | 0.516 NS |
| Mand. Crowding X Mand. Length | -0.290 | 0.025* |
| Max. Crowding X Max. length | 0.075 | 0.567 NS |
| Max. Crowding X Mand. Length | -0.193 | 0.140 NS |
| Max. Crowding X Mand. Crowding | 0.640 | 0.001** |
| Max. length X Mand. Length | 0.555 | 0.001** |
| Mand. Crowding X MPA | 0.101 | 0.444 NS |
| Mand. Crowding X Y-axis | 0.041 | 0.756 NS |
| Mand. Crowding X LAFH | 0.117 | 0.372 NS |
| Mand. Crowding X L1 to NB | 0.010 | 0.939 NS |
| Mand. Crowding X L1 to Go-Gn | -0.057 | 0.663 NS |
| Mand. Crowding X Interincisal angle | 0.108 | 0.412 NS |
r : Pearson correlation coefficient.
NS : Non significant,
p < 0.05 (significant),
p < 0.001(highly significant)
Discussion
Crowding of the lower incisors is a problem encountered frequently in orthodontic practice. Successful therapy may depend on the orthodontist’s ability to evaluate factors contributing to the overall pattern. A review of the literature indicated numerous etiological factors of mandibular crowding. Crowding is often related to arch dimensions however; incisor crowding is not merely a tooth-arch size discrepancy, but a discrepancy among many variables. Only few studies have evaluated the relationship between crowding and cephalometric measurements and very few studies have correlated crowding in Class II malocclusion to various skeletal and dental parameters. Thus, it was the aim of this study to find out whether a relationship existed between mandibular crowding and various skeletal and dental parameters in Class II div.1 malocclusion.
Sample Selection
Group selection according to the severity of mandibular dental crowding used 3 mm crowding as a limit for group assignment as previously described in literature [14]. Only patients below 18 years were included in the study to exclude the age related late mandibular crowding as is described in previous literature [16,18]. All the patients below 11 years were excluded from the study as all the permanent teeth should be present to determine arch perimeter to calculate the amount of crowding in each case and for the same reason any patients with congenitally missing teeth were excluded from the study. Any tooth with abnormal shape or large proximal carious lesion or restoration and any transverse discrepancy like cross bite or scissor bite can alter the arch perimeter and can affect the correct calculation of amount of crowding, therefore those conditions were also excluded from the study.
The groups under investigation included only patients with bilateral Class II molar relationship so that Class II malocclusions could be clearly characterized. Only Class II div.1 patients were included in the study and all environmental factors that may cause crowding were excluded from the study like Class II div.2 malocclusions in which the lingual inclination of the upper incisors due to lip pressure forces lower incisors backward and causes crowding [19]. Also, any abnormal pressure habits like thumb sucking and lip sucking, were excluded from the study as they cause abnormal pressure on teeth and periodontium and results in crowding. All the parameters measured were those that have mostly been found to be related to crowding in previous literature.
To reduce the magnification error, all the radiographs taken from same x-ray machine under the standard settings, were selected.
Apical Base Effective Lengths
As patients with Class II div. 1 malocclusion in general have a reduced mandibular base length, both the groups in this study showed a reduced mandibular base length than normal but Group I with crowding ≥3 mm showed significantly smaller (p=0.004) effective mandibular length than Group II [Table/Fig-9]. This result is similar to the results of some previous studies with unspecified malocclusions [11,12,20]. Turkkahraman H and Sayin MO [13] compared Class I facial pattern patients with and without anterior crowding in the early mixed dentition and they found that the patients with incisor crowding showed a shorter maxillary and mandibular length. Also Janson G et al [14] in their study found that subjects with complete Class II malocclusion and moderate to severe mandibular crowding have significantly smaller effective maxillary apical base length and mandibular apical base lengths than subjects with the same malocclusion and slight mandibular crowding. However, in the present study no significant difference was found between the two groups for effective maxillary length [Table/Fig-9] unlike the study by Turkkahraman H and Sayin MO [13] and Janson G et al., [14]. In addition, a significant inverse correlation was found between the amount of mandibular crowding and mandibular effective lengths in the present study [Table/Fig-12], similar to that found in study by Janson G et al [14] (r=-0.317; p=0.004).
In the light of these findings, it can be concluded that shorter effective mandibular base lengths can be one of the etiological factors of severe mandibular crowding and that shorter the mandibular base lengths greater is the amount of mandibular crowding.
Growth Direction of the Mandible
Go-Gn to SN angle, Y axis and LAFH are used in this study to evaluate the growth direction of mandible and to relate it to crowding.
Bjork A [21] in 1969 suggested that extreme mandibular rotation could result in increased lower arch crowding. But, there have been only few studies in literature that have assessed the association between crowding and facial divergence. Nasby JA et al [22] and Leighton BC and Hunter WS [11] found that hyperdivergent subjects had more crowding than hypodivergent subjects. However, there have also been studies that have not found any association between crowding and facial divergence [13,23,24]. Similarly, in present study also, the mean values of Go-Gn to SN and Y axis are almost similar in Group I and Group II [Table/Fig-9] with statistically insignificant difference.
Also, LAFH mean values for both the groups is almost same and statisticaly non-significant [Table/Fig-9]. This result was in agreement with results of Miethke RR and Behm-Menthel A [25] and opposite to that by Rasul G et al [26] who found LAFH to be significantly higher in crowding than normal subjects in their study.
Therefore, we can conclude that although both forward and backward rotating underlying patterns may have a considerable effect on the environment for the alignment of the teeth, this study did not show any association between the growth direction of the mandible and the degree of mandibular anterior crowding in Class II div.1 malocclusion.
Incisor Inclination
Because orthodontics makes it possible to alter the dentoalveolar tooth position, it is very important to determine whether incisor position and inclination contribute to crowding. Retrusion of lower incisors has been found to be significantly correlated with mandibular anterior crowding. Leighton BC and Hunter WS [11] reported that cases with crowding had less protrusive lower incisors. Turkkahraman H and Sayin MO [13] also found that the patients with crowding had smaller values of lower incisor to NB angle but did not find any statistically significant difference in IMPA mean values.
However, in this study it was found that inclination of lower incisors is not associated with mandibular crowding in skeletal Class II cases.These results are similar to the results of Miethke RR and Behm-Menthel A [25] and Bishara SE et al., [27] who also found no relationship between lower incisor crowding and lower incisor position.
Interincisal Angle
The interincisal angle is very important in controlling continuous alveolar eruption of incisors. An increased interincisal angle is often associated with increased overbite. Class II div.1 patients in general, have a reduced interincisal angle due to increased incisor proclination in these malocclusions. So, in this study too, interincisal angle for both the study groups was reduced than normal, however no statistically significant difference was found between both the groups [Table/Fig-10]. This finding is in contrast to the results of Turkkahraman H and Sayin MO [13], who found that patients with crowding had larger values of the interincisal angle but they evaluated only skeletal Class I malocclusion. The results of this study suggest that there is no correlation between interincisal angle and lower crowding in Class II div.1 malocclusion [Table/Fig-12].
Thus, the results of this study suggests that mandibular apical base length is also a contributing factor to crowding of mandibular teeth and is one of the various factors [28,29] determining the necessity for extraction of teeth. Short apical base length is a possible limitation to the non-extraction treatment approach which is currently in trend in orthodontics [30].
CLINICAL IMPLICATION
If the dental crowding is severe and is not due to tooth size or arch dimension problem then it can be most likely due to deficient apical base length. In such cases, the best treatment option is extraction rather than interproximal stripping and/or expansion. This suggests that, camouflage treatment for such Class II div. 1 patient with mandibular anterior crowding with upper first premolar extractions and non-extraction approach in lower arch, will not yield stable results. Thus, the knowledge of etiology of dental crowding has a significant effect on orthodontic treatment planning and retention.
Limitation
In the present study, radiographs as well as study models were analysed manually which was more time consuming and would have led to some measurement errors.
Further studies need to be done with larger sample size, digitalized recording devices and 3D imaging techniques to have a clearer picture on this topic.
Conclusion
From this study, it can be concluded that crowding of the mandibular incisors in Class II div.1 malocclusion is not only a tooth arch size discrepancy, skeletal features also can be associated with this malalignment. Subjects with Class II div.1 malocclusion and moderate to severe mandibular crowding have significantly smaller effective mandibular base length than subjects with the same malocclusion and slight mandibular crowding. Also, lower crowding is not correlated with growth direction of mandible, lower incisor inclination or interincisal angle in Class II div. 1 cases.
NS : Non significant,*p < 0.05 (significant),**p < 0.001(highly significant)
NS : Non significant,*p < 0.05 (significant),
**p < 0.001(highly significant)