The quality standards laid down by National Accreditation Board for Hospitals and Healthcare Providers (NABH) have also emphasized the patient’s role in the improvement of laboratory services [1-3]. NABH has identified some important key indicators which include waiting time for phlebotomy service to monitor the management, process and outcome especially patient satisfaction, which are used as tools for continual improvement.
Patient satisfaction is the patient’s perception of care received compared with the care expected. Sometimes, phlebotomist is the first person a patient meets. Patient should be made comfortable before pricking. This could be achieved only when phlebotomists are humble; he/she should have answer to all the queries of the patients and should be able to collect the sample in one prick in a clean environment with minimal discomfort to the patients. In a neuropsychiatric hospital, technical staff has to be extra careful while dealing with patients and should be able to handle aggrieved and violent patients. Long waiting, poor communication, repeated pricks, bruising and other negative experience may influence patient’s perception of care [2].
Various methods by which patient’s satisfaction survey is conducted are phone surveys, written surveys, group discussions or personal interviews. Satisfactions surveys provide satisfaction ratings [3]. These ratings help us to find the deficient areas such as lack of universal safety precautions, technical skill and behaviour and long waiting time as found in few previous studies done by Dawar R et al., and Howanitz PJ et al., [2,4]. The ratings helped in improving quality of services by working upon deficient areas. This study was done to find out satisfaction ratings along with deficient areas causing dissatisfactions among patients.
The aim of the study was to assess the patient’s satisfaction particularly those attending Outpatient Departments (OPDs) with phlebotomy service in our hospital and to take necessary CAPA.
Materials and Methods
A prospective study was conducted in a tertiary care neuropsychiatric hospital on 1200 patients over a period of two months (June and July 2016).
The sample size was calculated by formula:

We had taken margin of error as 3%, cofidence interval of 96% so Z score was 2.056 and we had no preconceived idea of the value of the sample proportion, so we had used p^ as 0.50.
Patients were interviewed about phlebotomy services with help of self- structured questionnaire, both in Hindi as well as English languages and also filled questionnaire by themselves or with the help of their attendants. This questionnaire was self designed by senior pathologist in-charge of sample collection services with the help of one expert from NABH along with inputs from resident doctors, technical staff and previous studies [2,4,5].
Informed consent was taken from all the patients. Patient’s confidentiality was maintained. As per the policy of the Institutional Ethical Committee, such studies are exempted from ethical clearance. Questionnaire included ten parameters. All the selected patients or their attendants filled up this questionnaire. At the same time, they were also interviewed by phlebotomy staff about the same points included in the questionnaire. The results were compiled based on the both filled questionnaire and short interview. A 5 point Likert scale was used. Patients were asked to grade on scale of 1 to 5 on all parameters on a scale of 1 to 5: 1 being very good; 2 as good; 3 as satisfactory; 4 as poor; and 5 as very poor and needs improvements. Very good, good and satisfactory responses were considered as satisfied whereas very poor and poor responses were considered as dissatisfied [6,7]. If the questionnaire was filled by attendant, then question 6 was graded as per observation by phlebotomy staff for fainting/swelling and by inquiring patient for any pain /inconvenience.
Statistical Analysis
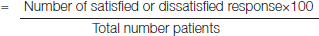
Data analysis was done using SPSS 16 software. The percentage of satisfaction or dissatisfaction was calculated by dividing the number of satisfied or dissatisfied responses by the total number of patients i.e., [6,7].
Percentage satisfaction or dissatisfaction
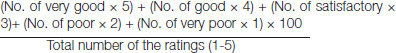
The overall rate of satisfaction by the Likert scale was calculated as (No. of very good × 5) + (No. of good × 4) + (No. of satisfactory × 3) + (No. of poor × 2) + (No. of very poor × 1) divided by the total number of the ratings (1-5) for the phlebotomy services as shown below.
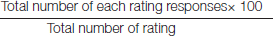
Percentage of each rating (very good, good, satisfactory, very poor, poor) was calculated by dividing the number of each rating responses by total number of rating (1-5).
Waiting time for phlebotomy implies the “time taken from the time that the patient comes to the phlebotomy room to the time taken in phlebotomy to be performed”. Ideally for blood collection, it should be less than 10 minutes [8-10].
Results
Out of 1200 patients who were included in the study, 630 were males and 570 were females and they were in the age group of 14–70 years.
The numbers of respondents with percentages and Likert score of the survey are presented in [Table/Fig-1].
Table showing likert score for each parameter, percentage of each rating and percentage of satisfaction or dissatisfaction.
| S No | Parameter | Very good | Good | Satisfactory | Poor | Very poor | Rate of satisfaction |
|---|
| 1. | The sample collection room was easy to find? | 546 (45.5%) | 372 (31%) | 176 (14.7%) | 106 (8.8%) | 00 | 4.13 |
| 2. | Whether the waiting time of your turn was satisfactory? | 330 (27.5%) | 558 (46.5%) | 194 (16.2%) | 68 (5.6%) | 50 (4.2%) | 3.88 |
| 3. | Whether the technician of this room gives information about blood collection? | 384 (32%) | 462 (38.5%) | 276 (23%) | 78 (6.5%) | 00 | 3.96 |
| 4. | Whether the collection room staff was in complete uniform? | 266 (22.2%) | 504 (42%) | 312 (26%) | 56 (4.7%) | 62 (5.1%) | 3.72 |
| 5. | Whether the respect of your privacy was maintained by technician of this room? | 432 (36%) | 414 (34.5%) | 354 (29.5%) | 0 | 0 | 4.07 |
| 6. | Whether you felt any inconvenience/swelling formation/ fainting attack/ persistent pain during bloodcollection?* | - | 852 (71%) | 348 (29%) | 0 | 0 | 4.01 |
| 7. | Whether sample was collected: in a single prick-Very good, 2 pricks-Good, 3 pricks-Satisfactory, 4 pricks-Poor, ≥ 5 pricks- Very poor.4 | 330 (27.5%) | 528 (44.1%) | 332 (27.6%) | 06 (0.5%) | 04 (0.3%) | 3.98 |
| 8. | Are you satisfied with the cleanliness of this room? | 304 (25.3%) | 492 (41%) | 298 (24.83%) | 56 (4.7%) | 50 (4.2%) | 3.79 |
| 9. | Are you satisfied with the behavior of this sample collection room staff? | 294 (24.5%) | 544 (45.3%) | 254 (21.2%) | 62 (5.2%) | 46 (3.8 %) | 3.82 |
| 10. | How was your overall experience with this sample collection room? | 360 (30%) | 486 (40.5%) | 282 (23.5%) | 48 (4 %) | 24 (2%) | 3.93 |
* No complaint = Good; Any inconvenience or swelling = satisfactory; Fainting attack or persistent pain during blood collectiob = Poor
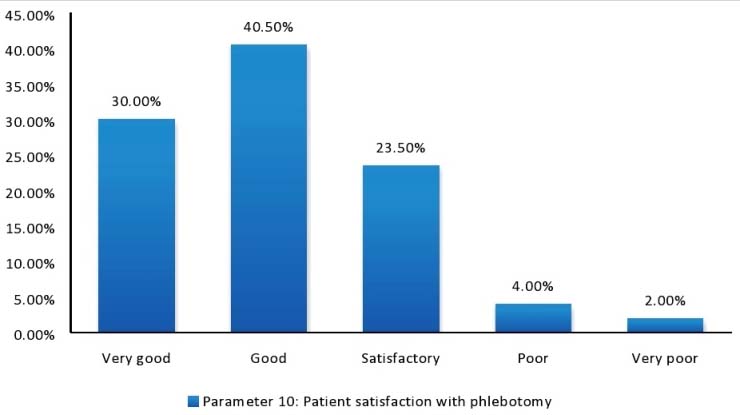
Satisfaction or dissatisfaction: In Likert scale, the mean rate of satisfaction of patients with the phlebotomy services was 392. Highest mean rating of satisfaction was obtained for parameter 1 (ease to find collection room) i.e., 4.13. Parameter 4 i.e., staff’s wearing proper uniform (protective gear) was given the lowest rating of 3.72. For the parameter 10, majority (40.50%) found it to be good [Table/Fig-2].
Parameter 10 patient satisfaction with phlebotomy.
Overall patient satisfaction with phlebotomy services was high, 1,128/1200 (94%) patients were satisfied (very good, good and satisfied) with the services and only 72/1200 patients i.e., 06% were dissatisfied (poor and very poor).
Discussion
In our study, access to sample collection services and safeguarding of patient privacy were outstanding but technical staff behaviour and skills including adoption of universal safety precautions were key deficient areas that need improvement along with aiming for lesser turnaround time for collection.
Parameter no.1 i.e., ease to find sample collection room received the highest scoring. Waiting time for phlebotomy which is parameter no.2 in the questionnaire is also a key indicator covered under NABH continual quality improvement. This parameter received intermediate scoring in our study. Overall degree of patient satisfaction with phlebotomy services in the present survey was high (94%). One of the studies by Bhogale AL et al., also calculated patient perception and satisfaction by using analogous parameters and Likert scoring for laboratory diagnosis of malaria [11].
After knowing gaps/deficiency in phlebotomy services, root cause analysis was done to fill in the gaps especially for parameters number 2, 3, 4, 6, 7, 8 and 9 which received intermediate to low scores from patient’s feedback and need to be improved. A comparison between our study and previous studies highlighting different deficient areas is shown in [Table/Fig-3].
A comparison between our study and previous studies conducted.
| S No | Studies | Reference number | Satisfaction rate | Deficient Areas which need improvement |
|---|
| 1. | Our Study | - | Good- 70.50%Satisfactory: 23.50%Needs Improvements: 6% | Proper uniform, skills and behaviour of the staffWaiting time for sample collectionCleanliness of the collection room |
| 2. | Dawar R et al (2015) | [2] | Good- 69%Satisfactory: 24%Needs Improvements: 7% | Ability of the phlebotomist to put patient at ease and to answer questionsToilet cleanliness and comfortAvailability of all the tests requested by physicianSample collection technique. |
| 3. | Koh YR et al (2014) | [1] | Agree: 80.4%Average: 17.3%Disagree: 2.3% | Sample collection & delivery procedureCost of the testsExplanation of phlebotomy procedure |
| 4. | Teklemariam Z et al (2013) | [6] | Overall Satisfaction: 87.6%Excellent:4.5%Very Good: 51.6%Good: 31.5%Fair: 8.8%Poor : 3.6% | Cleanliness and location of toiletsInformation provided and behaviour of staffLocation of laboratory |
| 5. | Howanitz PJ et al (1991) | [4] | --- | Patient discomfort during sample collection |
For parameter 2 and 9 (waiting time for phlebotomy and behaviour of the phlebotomy staff), various root causes were observed. These were: 1) Inadequate sitting arrangement for patients leading to chaos and scuffle for their turn; 2) Lower strength of phlebotomy staff due to which work load of patients/technical staff was more, which in turn reduced the quality of the services provided (only two phlebotomy stations were there to collect sample for an average patient load of 100 patients per day); 3) There was manual system of maintaining records instead of digital record maintenance i.e., barcoding, which was time consuming, cumbersome and having increased possibility of errors.
For parameters 3, 6, and 7 (whether the technician of this room gives information about blood collection, whether you felt any inconvenience/swelling formation/fainting attack/persistent pain during blood collection and whether sample was collected in a single prick) main root cause for low scoring was found to be inadequate training of phlebotomy staff about phlebotomy techniques and patients dealing. The usual practice followed in the hospital was to provide training to technical staff at every six months interval but that appeared insufficient and that needs to be more frequently held. The samples were collected using different vacutainers in serial order of draw with the help of vacutainer holder and 22 gauge vacutainer needle. Other causes observed were frequent rotation of laboratory staff and need of regular training for new as well as old staff along with timely review of their knowledge and skill by in-charge for continuous improvement was felt.
For parameters 4 and 8 (whether the collection room staff was in complete uniform and are you satisfied with the cleanliness of this room) root cause was found to be lack of awareness about universal safety precautions and cleanliness among phlebotomy staff. Frequent change of phlebotomy staff and irregular training were the reasons noticed for lack of awareness as most of the technical staff was recruited on contractual basis with no previous experience. Technical staffs were trained by conducting regular in-house training programmes according to NABH requirements and giving them opportunity to participate in conferences and workshops.
The root causes were discussed in review committee after every three months comprising of senior administrative officers, senior doctors, concerned in-charge and clinical staff as per NABH requirement. At the same time corrective and preventive actions were formulated with effective implementation in the respective areas. Various CAPA measures taken for parameters no 2, 3, 4, 6, 7, 8 and 9 were summarized in [Table/Fig-4]. As suggested by few patients, a female phlebotomist was also deployed at the phlebotomy room.
Corrective and Preventive Actions (CAPA) taken for phlebotomy service.
| Parameter No | Parameters | Root cause analysis | Corrective action taken | Preventive action taken |
|---|
| 2 | Whether the waiting time of your turn was satisfactory? | Manual system of entry.Lower manpowerMismanagement and inadequate sitting arrangement for the patients leading to chaos and confusion | Token system started, staff increased, preferably one female technician especially for female patients, proper sitting arrangements with comfortable chairs in the waiting area were made | Regular surprise inspectionTraining programme at regular intervals to be continued |
| 34679 | Whether the technician of this room gives information about blood collection?Whether the collection room staff was in complete uniform?(gloves, aprons, masks, caps)Whether you felt any inconvenience/swelling formation/ fainting attack/ persistent pain during blood collection? Whether sample was collected in a single prick?Are you satisfied with the behaviour of this sample collection room staff? | Phlebotomist not well informed as well as not trained properlyFrequent change of posting | Phlebotomists trained to listen and answer to patients all query. If they did not know the answer, they referred the patient to the senior resident or in-charge.Training conducted at regular interval for both old and new staff Orientation training for new staff along with regular review of their knowledge and skill by in-charge.Staff posting in phlebotomy room for at least six months ensured. |
| 8 | Are you satisfied with the cleanliness of this room? | Phlebotomist not well trained and well informed about universal safety precautions and cleanliness. | Phlebotomist instructed to keep the sample collection room tidy and to clean the working area, either after collection of every 20 samples or every two hourly whichever is suited. |
In our study, 70.50% of the patients found our phlebotomy services to be good and another 23.5% found them to be satisfactory and 6% wanted improvement in the phlebotomy services. This finding was in concordance with a study done by Dawar R et al., concluded that 69% of the respondents found the phlebotomy services to be good, 24% found them to be satisfactory and rest 7% wanted improvement in the phlebotomy services [2].
A similar study done by Koh YR et al., found that patients were most dissatisfied by the explanation of the phlebotomy procedure given by doctor, nurses and phlebotomist. However, in our study patients, 188 (94%) were satisfied with the explanation to the patient about the sample collection procedure [1].
For certain key parameters such as waiting time and adequate manpower for phlebotomy services, few previous studies were done to optimize waiting time and manpower effectively. Jeon BR et al., did a study on reducing waiting time period in phlebotomy services by adopting active-phlebotomist phlebotomy system, in which a phlebotomist went to patients actively instead of patients going to phlebotomists [12]. A study done by Mijailovic AS et al., concluded that efficacy and accuracy of phlebotomy staffing could be improved in outpatient department by using a simple tool of patient waiting time, patient venipuncture volumes to derive the estimated capacity and satisfaction survey [13].
Being a neuropsychiatric tertiary care hospital, special precautions were taken to deal with patients having special and extra needs. Those extra precautions were: 1) Phlebotomists were trained to be extra gentle in handling aggrieved and violent patients; 2) Security guard was posted at the phlebotomy room for managing psychiatric patients during collection; 3) Preference for phlebotomy was given to senior citizens and person with disabilities. Training and teaching programmes were already going on but efforts were made to organize them in a regular manner after a definite time frame ensuring maximum participation of technical staff.
Limitation
Small sample size and the questionnaire did not include certain parameters such as availability and cleanliness of toilet, how to and when to collect laboratory test result, specific waiting time for phlebotomy such as <10 min, 10-30 min, >30 min and turnaround time [2,3].
Further study with larger sample size and introduction of more factors in the questionnaire, is needed to judge the deficiency in the other areas and to have a broader outlook of patients about phlebotomy services.
Based on survey, few recommendations were made such as adoption of barcode system and Hospital Information System (HIS) patient feedback survey to be conducted routinely including more elaborative questionnaire by inclusion of more parameters and to provide toilets facilities near phlebotomy room with proper maintenance.
Conclusion
Our goals were to improve the overall patient experience and optimize the blood collection process. Steps involved are firstly to identify deficiencies, to plan the appropriate changes, secondly to make the changes, thirdly to collect information about the effects of the changes and then act on the information about the changes and lastly keep on repeatedly doing all the steps over and over again at regular interval and therefore in-charge along with phlebotomy staff and hospital administration should work harder to solve identified problems by taking appropriate corrective and preventative action.
* No complaint = Good; Any inconvenience or swelling = satisfactory; Fainting attack or persistent pain during blood collectiob = Poor