Statistical Significance is Prerequisite in Study
Himel Mondal1, Shaikat Mondal2
1 Postgraduate Student, Department of Physiology, MKCG Medical College, Ganjam, Odisha, India.
2 Postgraduate Student, Department of Physiology, Medical College and Hospital, Kolkata, West Bengal, India.
NAME, ADDRESS, E-MAIL ID OF THE CORRESPONDING AUTHOR: Dr. Himel Mondal, Postgraduate Student, Department of Physiology, MKCG Medical College, Ganjam-760004, Odisha, India.
E-mail: himelmkcg@gmail.com
Alpha, Confidence interval, Hypothesis, p-value, Statistical significance
Correspondence: Impact of Nutritional Status on Cognition in Institutionalized Orphans: A Pilot Study.
Dear Editor,
We have gone through an original article contributed by Kamath SM et al., in your reputed journal in March 2017 issue [1]. The aim of the study and results were comprehensible. However, the results of the study lack perfection statistically. Some precautionary steps in setting statistical significance could make the research perfect. Hence, we intended to share it with journal readers, especially new researchers.
According to the STROBE statement, detailed statistical method is an essential part of the cross-sectional study [2]. In biomedical researches, often statistical methods are used after completion of the data collection. However, stating the null hypothesis and alternative hypothesis and level of statistical significance is prerequisite if authors plan to test the hypothesis statistically.
Type I error for any study is the probability of rejecting null hypothesis when actually it is true in the study population. This probability of Type I error is determined by α. If we set α=0.05, probability of rejecting null hypothesis, when it is true in population, is 5% (1 in 20) [3]. This is the most commonly used level of α. Though, this level of α is being used in majority of the studies, investigator can use any level of α according to the nature of the study. However, it should be clearly declared before data collection for the study.
For the study of our discussion, authors used t-test to compare mean of two groups and found p-value=0.05 and considered it statistically significant. Assuming common practice of using α=0.05, authors’ concept was correct that statistical significance is at p-value as small or smaller than α [4]. However, we need to remember that p should be equal to 0.05 exactly or less than that. Hence, it is wise to declare the confidence interval as 95%, and p-value less than 0.05 to be statistically significant [5]. To get a clear view about authors interpretation, we calculated the p-value by carrying out unpaired t-test from the mean, standard deviation and number of subjects data available from the paper. For block design cognition test, calculated p was 0.0546 when we carried out t-test in GraphPad Prism (version 6.01, 2012) Windows PC based software with α=0.05. Hence, authors’ interpretation of statistical significance was an overlooked matter. However, if α was set at a level less than 0.0546, then the interpretation would be justified.
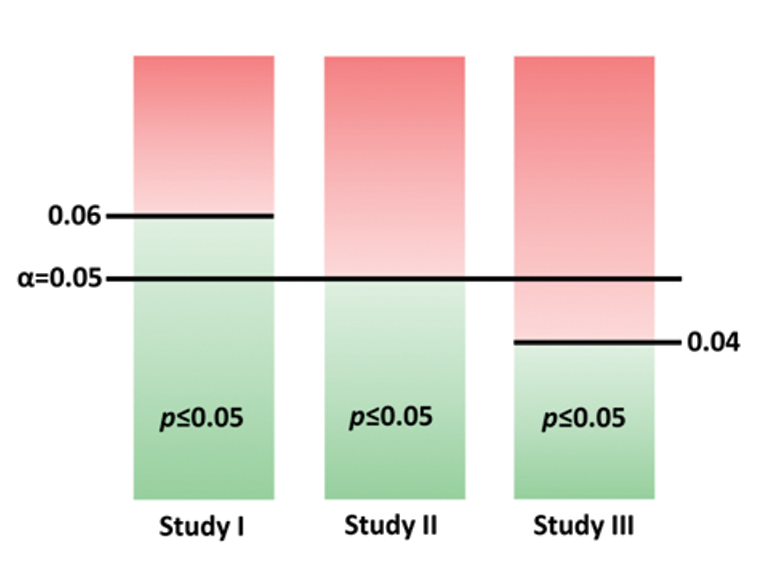
An example is presented in [Table/Fig-1]. In study II, α=0.05 and a p≤0.05 is statistically significant. This level of p is not significant in study III where α is set at 0.04 (p≤0.04 is significant in this case). In study I, even a p-value more than 0.05 (and ≤0.06) is considered statistically significant as α is set at 0.06.
The p=0.05 in study II is statistically significant, p=0.05 is not significant in study III. The p>0.05 (and ≤0.06) is significant in study I.
[1]. Kamath SM, Venkatappa KG, Sparshadeep EM, Impact of Nutritional Status on Cognition in Institutionalized Orphans: A Pilot StudyJ Clin Diagn Res 2017 Mar Vol-11(3):CC01-CC04. [Google Scholar]
[2]. von Elm E, Altman DG, Egger M, Pocock SJ, Gøtzsche PC, Vandenbroucke JP, STROBE Initiative. The Strengthening the Reporting of Observational Studies in Epidemiology (STROBE)statement: guidelines for reporting observational studiesLancet 2007 370(9596):1453-57. [Google Scholar]
[3]. Hulley SB, Cummings SR, Browner WS, Grady DG, Newman TB, Getting Ready to Estimate Sample Size: Hypotheses and Underlying PrinciplesIn: Designing Clinical Research 2001 3rd edPhiladelphia, PALippincott Williams & Wilkins:55-59. [Google Scholar]
[4]. Moore DS, McCabe GP, Craig BA, Tests of SignificanceIn: Introduction to the Practice of Statistics 2009 6th edNew YorkW.H. Freeman and Company:372-81. [Google Scholar]
[5]. Kirkwood BR, Sterne JAC, Using p-values and confidence intervals to interpret the results of statistical analysesIn: Essential Medical Statistics 2003 2nd edUSABlackwell Science Ltd:71-79. [Google Scholar]