HCV plays a major role in liver disease with over 170 million chronically infected people worldwide [1]. By natural course CHC can progress to liver cirrhosis and hepatocellular carcinoma [2]. Determination of fibrosis stage is necessary for therapy and follow-up consideration [3]. Liver disease in CHC also manifests with necroinflammation and hepatic steatosis (steatosis). Lipid disturbances, insulin resistance, an increased risk of Diabetes Mellitus Type 2 (DMT2) and atherosclerosis have been associated with chronic HCV infection [4].
HCV’s life cycle depends on interactions with host lipids. The viral particles enter cells by binding to Low-Density Lipoprotein Receptor (LDLR), scavenger receptor class BI and clathrin mediated endocytosis. Lipids act as an immune escape mechanism for HCV and formation of Lipoviroparticles (LVP) is essential for infectivity [5,6]. Translation of HCV RNA in the endoplasmic reticulum and replication, in a membranous web at the surface of Lipid Droplets (LD), require interaction of host proteins with HCV core and nonstructural proteins [7,8]. Turnover of LDs is suppressed by viral proteins in HCV genotype 3 (G3) and by insulin resistance in HCV genotype 1 (G1) infection, leading to steatosis [9,10]. Reduced expression of hepatic triglyceride lipase and higher levels of serum cholesteryl ester transfer protein in CHC promote redistribution of Triglycerides (TG) between lipoproteins rather than hydrolysis [11,12]. Increased TG content in lipoproteins of higher density (HDL, LDL) instead of Very Low-Density Lipoprotein (VLDL) has been noted in HCV G1 and genotype 2 (G2) patients. Advanced fibrosis is associated with higher TG content in LDL, HDL and small VLDL [13,14]. Nascent LVP need to resemble VLDL to be exported [15]. Despite its Apolipoprotein B (Apo B) and LDL-like structure, lipoprotein (a) {Lp(a)} levels are not regulated by binding to LDLR [16].
There are reports of direct association between HCV RNA and lipid compounds: serum TG in G1; plasma TG and LDL in G1; inverse with Apo B in non-G1 patients [17-19]. In a comparative study between G1 and G2, Total Cholesterol (TCh) correlated with HCV RNA in G2 patients [20].
Detection of advanced fibrosis (F≥3) and liver cirrhosis (F4) stages is clinically important. Forns index was validated to exclude significant fibrosis in non-G3 patients [21]. The index could predict F≥3 and F4 as accurately as the Aspartate Aminotransferase (AST) to platelet ratio index (APRI). FIB-4 was a good predictor of F≥3, while AST to Alanine Aminotransferase (ALT) ratio (AST/ALT) had lower performance for F≥3 and F4 [22-25]. The significance of serum lipids for liver disease assessment in CHC is not clearly established yet.
Our study aimed to explore TCh, TG, HDL, LDL, VLDL, Lp(a) levels and ratios with regard to steatosis, liver fibrosis and cirrhosis and elucidate the significance of lipids for CHC.
Materials and Methods
The single-centre cross-sectional study was carried out among patients with HCV related chronic liver disease admitted to University Hospital “St.Ivan Rilski”, Medical University - Sofia. The study was approved by the University’s Scientific Ethical Committee. Patient samples and data were collected from October 2014 until December 2015. Inclusion criteria were: CHC, age over 18 years and written informed consent. Exclusion criteria were: current antiviral treatment, decompensated liver cirrhosis (including history of variceal bleeding and hepatocellular carcinoma), malignancy, excessive alcohol intake, current illicit drug use, Human Immunodeficiency Virus (HIV) co-infection, dominant Hepatitis B Virus (HBV) co-infection, hypo-or hyperthyroidism, primary hyperlipidaemia and lipid lowering medication. Approximately 50% of screened patients matched the criteria and were consecutively offered participation - less than 3% refused. A total of 112 patients with CHC, 98 genotype 1 (G1) and 14 genotype 3 (G3), were studied (Caucasian, 54 - male, 58 -female, aged 48.6±13.7 years). CHC was established with positive serology and viral load (HCV RNA IU/ml transformed into common logarithm) by real-time reverse transcription polymerase chain reaction. Liver cirrhosis (F4) was diagnosed in 31 cases based on laboratory criteria, liver biopsy and endoscopic screening for varices. Ultrasound was done universally and steatosis was present in 75 patients. Liver biopsy was done in 65 patients and histology showed steatosis in 28, stages of mild to severe fibrosis (F1-F3) in 56 and F4 in 9 patients (METAVIR). Liver biopsy was omitted when refused or contraindicated: refusal of standard of care interferon based treatment, patients over 65 years of age, three patients with haemophilia, two on oral anticoagulant. Patients with obesity, DMT2, prediabetes and metabolic syndrome were defined by International Diabetes Federation criteria and included in the study. Two patients were hepatitis B surface antigen positive with undetectable HBV DNA and negative hepatitis D tests - liver disease dominated by HCV. Ten participants had an estimated 20 to 40 g of daily alcohol intake. Laboratory panel included complete blood count, liver tests and fasting serum lipid levels (TCh, HDL and TG in mmol/l; Lp(a) in nmol/l). Non-HDL, LDL and VLDL levels were estimated according to the Friedewald equation and ratios were calculated. Indirect noninvasive fibrosis scores FIB-4, APRI, Forns index and AST/ALT were calculated.
Statistical Analysis
Statistical analysis was done with Statistical Package for the Social Sciences (SPSS) version 19.0. For descriptive analysis; Kolmogorov-Smirnov (K-S) and Shapiro-Wilk (S-W) normality tests; Chi-squared test (χ2) for distribution of categorical variables; nonparametric tests for correlations {Spearman’s rho (S-rho)} and group comparison {Mann-Whitney U test (M-W)}; ROC curve with analyses split by genotype and presence of steatosis. Area Under the ROC curve (AUROC) was paralleled between scores. Fibrosis stage was analysed as an ordinal (F1 to F4 stages) and as a categorical variable (F1-F3 versus F4 stages). Steatosis was analysed as a categorical (present or not) and as a continuous variable (histological percent of fatty hepatocytes). Prediabetes and DMT2 were united in one category (present or not). Probability levels (p) of less than 0.05 were considered for significance.
Results
Distribution of numerical data significantly differed from the normal curve (K-S, S-W). Laboratory parameters were displayed in [Table/Fig-1].
Mean values ± Standard Deviation (SD) of laboratory parameters in patients with CHC regarding stage of fibrosis and presence of steatosis.
| Values | Without steatosis | With steatosis | Stage F1-F3 | Stage F4 |
|---|
| Parameter | Mean | ±SD | Mean | ±SD | Mean | ±SD | Mean | ±SD |
|---|
| TCh | 3.83 | 0.59 | 4.5 | 1.13 | 4.54 | 1.15 | 3.72 | 0.55 |
| HDL | 1.33 | 0.49 | 1.42 | 0.41 | 1.47 | 0.42 | 1.24 | 0.34 |
| LDL | 2.07 | 0.49 | 2.62 | 0.99 | 2.63 | 1.06 | 1.99 | 0.41 |
| VLDL | 0.44 | 0.16 | 0.46 | 0.18 | 0.44 | 0.18 | 0.49 | 0.16 |
| TG | 0.97 | 0.34 | 1.02 | 0.39 | 0.98 | 0.4 | 1.09 | 0.35 |
| Non-HDL | 2.51 | 0.51 | 3.08 | 1.04 | 3.07 | 1.12 | 2.47 | 0.47 |
| Lp (a) | 21.86 | 28.92 | 29.19 | 37.28 | 31.44 | 40.09 | 20.74 | 29.1 |
| TG/LDL | 0.49 | 0.19 | 0.43 | 0.21 | 0.42 | 0.21 | 0.56 | 0.18 |
| FIB-4 | 4.1 | 3.48 | 1.74 | 1.4 | 1.3 | 1.01 | 4.71 | 3.48 |
| APRI | 1.99 | 2.02 | 0.87 | 0.68 | 0.71 | 0.63 | 2.19 | 2.02 |
| Forns index | 7.45 | 2.27 | 5.13 | 2 | 4.51 | 1.66 | 8.18 | 1.96 |
| AST/ALT | 0.96 | 0.31 | 0.82 | 0.3 | 0.72 | 0.24 | 1.02 | 0.34 |
| Platelets 109 /l | 157.36 | 68.93 | 217 | 66.23 | 234 | 59 | 136 | 67 |
| AST | 76.8 | 49.53 | 57.53 | 38.57 | 50.67 | 29.9 | 79.45 | 47.11 |
| ALT | 86.75 | 63.69 | 80.94 | 59.03 | 82.28 | 61.4 | 85.48 | 58.48 |
I) Distribution, Group Comparison and Correlation Analysis
G3 patients were younger (p<0.001) and had lower viral load (p=0.006) than G1 patients (M-W). Steatosis was more prevalent in G3 patients than in G1 patients (p=0.028). Among patients staged F4 there were less cases of steatosis (p<0.001) and the group without steatosis gathered more cases of F3 and F4 (p=0.006) (χ2).
Patients with steatosis were younger (p<0.001). Their TCh levels (p=0.009) and platelet count (p<0.001) were higher than in patients without steatosis (M-W). The presence of steatosis correlated with necroinflammatory grade in liver biopsy (r=0.320, p<0.001) but its correlation with fibrosis scores was inverse: FIB-4 (r=-0.421, p<0.001), APRI (r=-0.295, p=0.002), Forns index (r=-0.452, p<0.001), AST/ALT (r=-0.232, p=0.014) (Undivided by genotype, S-rho).
Analyses were run in subgroups divided by genotype and presence of steatosis. There was an inverse correlation between stage F4 and LDL levels (r=-0.419, p=0.010) in patients without steatosis. TG and VLDL levels correlated with FIB-4 (r=0.330, p=0.046) and Forns index (r=0.392, p=0.016) in the same group (Undivided by genotype, S-rho).
Fibrosis stage inversely correlated with LDL levels (r=-0.281, p=0.015) when steatosis was present. TG and VLDL levels correlated with FIB-4 (r=0.280, p=0.015) and Forns index (r=0.319, p=0.005). The value of TG to LDL ratio (TG/LDL) correlated with stage F4 (r=0.366, p=0.026) in patients without steatosis and with fibrosis stage (r=0.419, p<0.001) in patients with steatosis (Undivided by genotype, S-rho).
TCh (p=0.002) and LDL (p=0.003) levels were higher when steatosis was present in G1 patients. Undivided by presence of steatosis, TCh (p<0.001), HDL (p=0.018) and LDL (p=0.003) levels were lower and TG/LDL (p=0.001) was higher in F4 than in F1-F3 staged G1 patients. When data were split by presence of steatosis, TCh (p<0.001) and LDL (p=0.003) levels were lower in F4 than F1-F3 staged patients without steatosis. HDL levels (p=0.049) were lower in F4 than in F1-F3 staged patients with steatosis. TG/LDL was higher in F4 than in F1-F3 staged patients with (p=0.024) and without (p=0.001) steatosis respectively (M-W).
The F4 stage correlated with LDL levels (r=-0.417, p=0.011) and TG/LDL (r=0.387, p=0.020) in G1 patients without steatosis. TG and VLDL levels correlated with FIB-4 (r=0.364, p=0.029), APRI (r=0.333, p=0.047) and Forns index (r=0.423, p=0.010) in this subgroup (S-rho).
Correlation between fibrosis stage and LDL levels was lost in G1 patients with steatosis, but correlation between TG/LDL and F4 stage (r=0.315, p=0.010) remained. TG and VLDL levels correlated with Forns index (r=0.261, p=0.040) in this subgroup analysis. Viral load correlated with TG and VLDL levels (r=0.330, p=0.009) only in G1 patients with steatosis (S-rho).
Lp(a) levels correlated with TCh and LDL (r=0.292, p=0.021), non-HDL (r=0.200, p=0.048) levels and platelet count (r=0.307, p=0.002) in G1 patients with steatosis. Correlation was inverse between Lp(a) levels and F4 stage (r=-0.211, p=0.037), fibrosis scores - FIB-4 (r=-0.293, p=0.003), APRI (r=-0.273, p=0.006), Forns index (r=-0.325, p=0.001). No correlation was found between Lp(a) levels and fibrosis scores in patients without steatosis (S-rho).
Correlation results in G3 patients were inconsistent with the undivided group and not significant. Steatosis was present in 13 of 14 patients, while prevalence of glucose abnormalities was low (one patient with DMT2 and one with impaired fasting glucose). Correlation was found between histological percent of fatty hepatocytes and HCV RNA (r=0.585, p=0.028). Viral load did not correlate with any of the serum lipids (S-rho).
Low to moderate alcohol intake was not a determinant of steatosis. Glucose abnormalities were equally distributed among G1 patients with and without steatosis irrespective of fibrosis stage. There were more cases of DMT2 and prediabetes among patients with F4 stage of fibrosis (p=0.043) than in the F1-F3 staged patient group (χ2). The presence of prediabetes or DMT2, undivided by genotype and presence of steatosis, correlated with the stage of fibrosis (r=0.257, p=0.011), Forns index (r=0.327, p=0.001), TG and VLDL levels (r=0.241, p=0.017), inversely with TCh (r=-0.299, p=0.003) and HDL (r=-0.334, p=0.001) levels. Prediabetes or DMT2 correlated with TG and VLDL levels (r=0.524, p=0.001) and with F4 stage (r=0.346, p=0.039) in G1 patients without steatosis (S-rho).
II) ROC Curve Analysis
Results for G3 patients were not significant. Platelet count, total cholesterol, TG/LDL, FIB-4, Forns index, APRI, AST/ALT were analysed by ROC curve. The study group was divided by presence of steatosis and genotype to test for F≥3 and F4 [Table/Fig-2,3].
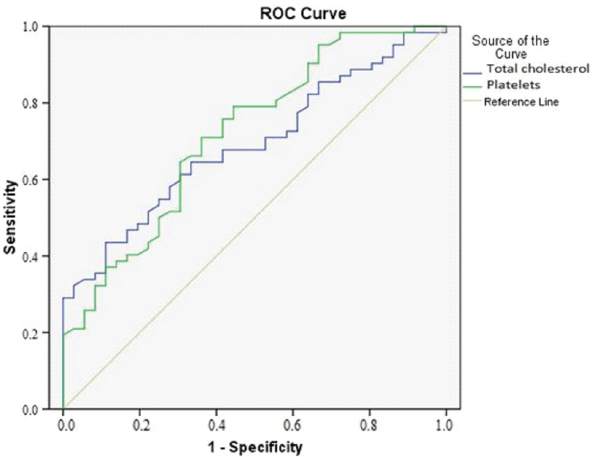
AUROC of platelet count and Total Cholesterol for steatosis.
| Valkov et al. | AUROC |
|---|
| Platelet count | Total cholesterol |
|---|
| All* | 0.719 (p<0.001) | 0.652 (p=0.009) |
| G1† | 0.719 (p<0.001) | 0.691(p=0.002) |
Undivided by genotype;
Genotype 1
AUROC of TG/LDL for F≥3 and F4 in the undivided group and in G1. AUROCs of fibrosis scores in G1, with and without steatosis: a) TG/LDL; b) APRI score; c) Forns index; d) FIB-4 score; e) AST/ALT ratio [22-25].
| a) TG/LDL |
| Valkov et al., | AUROC |
| F≥3 | F≥3, S§ | F4 | F4, S |
| All* | 0.821(p=0.008) | 0.610NS‡ | 0.856(p=0.003) | 0.722(p=0.023) |
| G1† | 0.871(p=0.004) | 0.649NS | 0.900(p=0.001) | 0.743(p=0.025) |
| b) APRI |
| Authors | AUROC |
| F≥3 | F≥3, S | F4 | F4, S |
| Valkov et al., | 0.653(NS) | 0.904(p<0.001) | 0.644NS | 0.936(p<0.001) |
| Adler et al., | 0.886 | 0.915 |
| Martinez et al., | 0.860 | 0.860 |
| Li et al., | 0.826 | 0.810 |
| c) Forns index |
| Authors | AUROC |
| F≥3 | F≥3, S | F4 | F4, S |
| Valkov et al., | 0.837(p=0.009) | 0.859(p<0.001) | 0.844(p=0.005) | 0.959(p<0.001) |
| Adler et al., | 0.902 | 0.877 |
| Martinez et al., | 0.850 | 0.870 |
| d) FIB-4 |
| Authors | AUROC |
| F≥3 | F≥3, S | F4 | F4, S |
| Valkov et al., | 0.810(p=0.016) | 0.924(p<0.001) | 0.794(0.017) | 0.956(p<0.001) |
| Adler et al., | 0.898 | 0.925 |
| Martinez et al., | 0.870 | 0.890 |
| Li et al., | 0.854 | 0.860 |
| AST/ALT |
| Authors | AUROC |
| F≥3 | F≥3, S | F4 | F4, S |
| Valkov et al., | 0.724NS | 0.698(p=0.025) | 0.716NS | 0.787(p=0.008) |
| Li et al., | 0.667 | 0.716 |
Undivided by genotype;
Genotype 1;
NS- no significance;
S- steatosis;
1. Analysis of steatosis predictors: Platelet count predicted the presence of steatosis by an AUROC 0.719 (p<0.001) irrespective of genotype. TCh levels had an AUROC 0.652 (p=0.009) undivided by genotype and AUROC 0.691 (p=0.002) when limiting analysis to G1 patients [Table/Fig-2,4].
ROC curve of platelet count and total cholesterol for steatosis in G1 patients.
2. Analysis of advanced fibrosis and cirrhosis predictors: ROC curve analysis of TG/LDL showed an AUROC 0.856 (p=0.003) for predicting F4 stage in patients without steatosis undivided by genotype. AUROC reached 0.900 (p=0.001) when limited to G1 patients [Table/Fig-3a,5a]. When steatosis was present, F4 stage was predicted by AUROC 0.722 (p=0.023) undivided by genotype and by AUROC 0.743 (p=0.025) in G1 patients [Table/Fig-3a,5b].
ROC curve of fibrosis scores and TG/LDL for F≥3 and F4 divided by presence of steatosis.
a) F4 without steatosis; b) F4 with steatosis; c) F≥3 without steatosis.
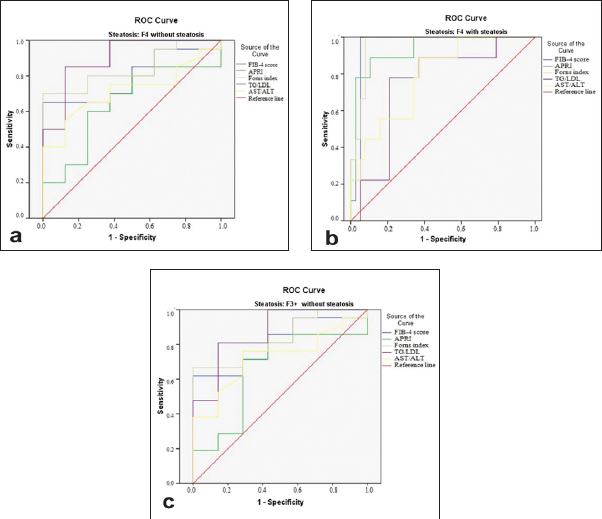
Analysed for F≥3 (F3 and F4 staged patients), AUROC was 0.821 (p=0.008) in patients without steatosis undivided by genotype and AUROC 0.871 (p=0.004) when limited to G1 patients [Table/Fig-3a,5c]. TG/LDL was not significantly predictive of F≥3 when steatosis was present irrespective of genotype.
ROC curves for APRI, Forns index, FIB-4, AST/ALT were analysed alongside TG/LDL for F≥3 and F4 stage in G1 patients. Results were divided with respect to steatosis and expressed with AUROC. Results from validation studies, where steatosis was not separately accounted for, were used for comparison [Table/Fig-3] [22-25].
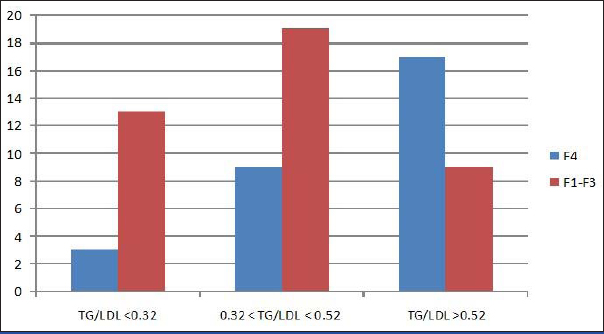
TG/LDL predicted F4 stage in G1 patients without steatosis with an AUROC 0.900 (p<0.001). Two cut-off points of TG/LDL provided useful levels of sensitivity and specificity for end point states relevant to the ROC curve analysis. Sensitivity was high at TG/LDL < 0.32 giving it a high Negative Predictive Value (NPV) for F4. Likelihood ratio negative {LR (-)} for F4 was lowest without steatosis and 90% of F4 cases were above that threshold. Specificity for F≥3 and F4 stage without steatosis was high at TG/LDL≥0.52 and likelihood ratio positive {LR (+)} was strongly increased. Low sensitivity provided for a modest Positive Predictive Value (PPV) when steatosis was not accounted for. Specificity for F4 stage dropped to 76% when steatosis was present and LR (+) for F4 was diminished to 3.25 [Table/Fig-6,7]. The two cut-off points, irrespective of steatosis, demonstrated three groups with proportionally growing numbers of F4 cases [Table/Fig-8].
Cut-off points, sensitivity, specificity and likelihood ratios of TG/LDL for F≥3 and F4 in CHC G1 with and without steatosis.
| TG/LDL | Percent % | End point state |
|---|
| F≥3 | F≥3, S* | F4 | F4, S |
|---|
| 0.32 | Sensitivity | 86 % | NS† | 90 % | 89 % |
| Specificity | 57 % | 68 % | 26 % |
| LR‡ (+) | 2 | 2.57 | 1.2 |
| LR (-) | 0.25 | 0.15 | 0.42 |
| 0.52 | Sensitivity | 66 % | 50 % | 78 % |
| Specificity | 100 % | 100 % | 76 % |
| LR (+) | 66 | 50 | 3.25 |
| LR (-) | 0.40 | 0.51 | 0.22 |
S- steatosis;
NS- no significance;
LR - likelihood ratio
Predictive value of TG/LDL for F≥3 and F4 in CHC G1.
| Predictive value of TG/LDL |
|---|
| Fibrosis stage | Cut-off point | PPV | Cut-off point | NPV |
| F≥3 | > 0.32 | 0.54 | < 0.32 | 0.61 |
| F4 | 0.46 | 0.83 |
| F≥3 | > 0.52 | 0.68 | < 0.52 | 0.59 |
| F4 | 0.64 | 0.73 |
Number of CHC G1 F4 and F1-F3 patients according to the cut-off points of TG/LDL.
III) Comparative Analysis of Noninvasive Fibrosis Scores and TG/LDL Performance in CHC G1
Correlation was inverse between fibrosis scores and steatosis. Scores based on serum enzyme activity, platelet count and age were not impaired by steatosis, AUROC being a measure of performance. On the opposite, TG/LDL was influenced by steatosis, losing of its specificity. We speculated that FIB-4, APRI and TG/LDL could detect different cases of F4. Cut-off points of FIB-4 ≥ 5.88 and APRI ≥ 2 were used for detection of F4 stage in G1 patients irrespective of steatosis [24,25]. A cut-off point of TG/LDL ≥ 0.52 was set for F4 stage. Of 29 F4 cases, 7 (25%) were not detected by any of the scores or TG/LDL. Ten cases of F4 were detected by TG/LDL and missed by FIB-4 and APRI. Six cases were detected by FIB-4 and APRI and missed by TG/LDL, of which 5 were detected by APRI. Together TG/LDL and APRI detected 20 (69%) of F4 cases, only 5 of which were concordant. Nine cases of F≤3 had TG/LDL ≥ 0.52 and none of them were misclassified as F4 by APRI. Three cases of F4 had TG/LDL < 0.32 and were not detected by any score. Steatosis was present in 11 of these 12 discordant cases. When a cut-off point of FIB-4 ≥ 3.25 was used 20 of the 37 cases of F≥3 were detected, underestimating 11 cases of F4 with FIB-4 < 5.88. AST/ALT ≥ 1 detected 16 of 37 cases of F≥3 without discriminating between F3 and F4. Forns index had a significant AUROC for F4 stage but the lack of a defined cut-off point for F≥3 and F4 precluded comparison.
Discussion
Cholesterol and LDL depletion in serum was confirmed in our results related to cases of advanced fibrosis and cirrhosis [26]. There have been reports on lipids with regard to advanced liver fibrosis in CHC: of a decrease in TCh and LDL, or in HDL and TG. Disturbances in lipid metabolism are known to occur as early as acute HCV infection, where fibrosis is not featured [14,27]. High TG levels were associated with higher fibrosis scores but not directly with stage of fibrosis or steatosis.
Lp(a) was studied because of its Apo B content. Its levels were associated inversely with clinical and laboratory signs of advanced liver fibrosis. Lp (a) correlation pattern was similar to non-HDL and LDL levels in G1 patients with steatosis but was not a promising predictor of steatosis or F4 stage.
TCh, HDL, LDL have been reported to be lower in CHC than in healthy subjects and viral load to correlate with steatosis in CHC G3 [28]. Our results of 14 patients supported the notion that HCV G3 interacts mainly with intracellular lipids, contributing to steatosis that correlates with viral load. Inconsistency of results for G3 patients can be also owing to high prevalence of steatosis and small number of patients. HCV G1 is associated with serum lipids showing correlation between viral load and TG and VLDL. Previous studies logarithmically transformed TG levels in mg/dl and HCV RNA for distribution normality [17-19]. Our serum lipids measurements were in mmol/l, Lp(a) in nmol/l. HCV RNA in IU/ml was logarithmically transformed and correlations were nonparametric.
Steatosis in G1 patients was marked by higher platelet count and total cholesterol but their possible predictive value was modest. Steatosis influences serum lipid levels and fibrosis assessment; therefore it needs to be separately accounted for. We observed a different pattern of liver damage in HCV G1 and G3. In G1 there was a gradual involvement by necroinflammation, steatosis and fibrosis until F4 stage is reached. In G3 liver disease was dominated by steatosis, which promoted necroinflammation and fibrosis and correlated with the viral load.
High rate of cell cholesterol import and high export of TG rich particles benefit HCV’s life cycle, thereby reducing serum cholesterol at a relative increase in serum TG and VLDL levels. The effect is enhanced in F4 staged CHC G1 due to overlapping with reduced cholesterol synthesis. TG/LDL mathematically exposed this disproportion and best accounted for the presence of advanced fibrosis and cirrhosis. That state of hypocholesterolaemia with relative hypertriglyceridaemia was not masked by glucose abnormalities. DMT2 in our group was associated with high TG, low HDL and low TCh levels instead of combined hyperlipidaemia. Exclusion criteria for the study were not rigorous regarding the extrahepatic milieu of CHC as for glucose abnormalities. The latter contributed to higher serum TG and fibrosis parameters but not to steatosis. The magnitude of this confounding factor cannot be determined. Glucose abnormalities are prevalent in patients with chronic HCV infection. Excluding them would create a selection effect and leave a considerable disease affected subpopulation unaccounted for.
The coexistence of fibrosis and steatosis reduces the specificity of TG/LDL for predicting fibrosis stage because of steatosis’ independent effect on serum lipids and correlation with TCh and LDL. APRI and FIB-4 scores performed well in our group irrespective of steatosis. TG/LDL combined with APRI identified greater number of F4 cases than any other score combination. APRI and TG/LDL could be used together with additive effect, as TG/LDL can expose cases of F4 that are not detected by APRI when platelet count and AST are normal.
Limitation
The lack of precise fibrosis stage in 25 patients and their exclusion from analysis regarding fibrosis resulted in 35% prevalence of F4 cases. At inclusion, some patients were initiating therapy and had liver fibrosis already staged. For the rest, staging was done at inclusion time point or following within the duration of the study. Missing data were analysed pair-wise. We observed a correlation between HCV RNA and histological percent of fatty hepatocytes in G3 patients. However, analyses of G3 were underpowered and results inconsistent for conclusions to be made. TG/LDL was not validated by this study as a marker of F4 stage in CHC G1.
Conclusion
Serum lipid levels in CHC depend on genotype, advanced fibrosis or cirrhosis and steatosis. HCV RNA correlated with TG and VLDL in G1 patients with steatosis but not in G3 patients. Characteristics and degree of liver damage were reflected by serum lipid levels. Steatosis in CHC G1 patients was associated with higher TCh than liver fibrosis or cirrhosis alone. Low cholesterol and relatively high TG levels make TG/LDL > 0.52 a potential marker of liver cirrhosis in CHC G1 patients. At TG/LDL below 0.32 liver cirrhosis could potentially be ruled out. TG/LDL can add to APRI’s performance to improve cirrhosis identification in CHC G1 patients. In the presence of steatosis, the specificity of TG/LDL was lost for F≥3 and was reduced for F4.
Financial Support: This study was funded by a research grant from Medical University – Sofia.