Materials and Methods
A cross-sectional study was conducted in the service area of an Urban Health Centre (UHC) and its neighbouring areas that had a population of approximately 35,000 people. This area is administratively divided into 4 regions- Kuruchikuppam, Vaithikuppam, Vazhaikulam and Chinnayapuram. The sample size was calculated using OpenEpi software based on the study done in Tamil Nadu, considering the prevalence of proteinuria as 12% [4], with 95% Confidence interval and a non-response rate of 10%. The estimated sample size was 180. However, we enrolled 248 study respondents of which 14% were non-responders. All adults aged above 18 years and residing for at least a year in Puducherry were included in the study. We got informed consent from 215 study participants. Interviews of the participants were taken after explaining the study procedure and obtaining the informed written consent. Confidentiality of the records was maintained.
The study was conducted over a period of four months from July 2015 to October in 2015. The protocol was approved by JIPMER Scientific Advisory Committee (JSAC) and by the Institute Ethics Committee (human studies), before the start of the study. Assuming that the population of the four regions is equally distributed and this assumption was concurrent with health centre annual data, 53 respondents from each region were randomly selected by systematic random sampling technique. Each of the four regions had approximately 1000 to 1500 houses. First house was selected randomly and after that every tenth house was chosen till the required sample size was fulfilled. In case a house was locked, it was revisited and if it was still locked the next house was chosen. One individual was selected from each house randomly. Informed written consent was obtained from the study respondent and a survey using a pre-designed, pre-tested proforma was conducted. Proteinuria was estimated by using visually read dipstick method. The participant was asked to collect their urine in a container and the dipstick was immersed in it. Based on the colour change, the results were graded as negative, trace (15 to 30 mg/dL), 1+ (30 to 100 mg/dL), 2+ (100 to 300 mg/dL), 3+ (300 to 1000 mg/dL) or 4+ (more than 1000 mg/dL). Negative and trace urinary proteins were classified as ‘no proteinuria’ and others depending on the amount of urinary proteins based on the colour coding were classified as 1+, 2+, 3+ and 4+ ‘proteinuria’ [6]. The variables included in the data collection proforma were sociodemographic variables like name, age, gender, history of high blood pressure, diabetes, tobacco and alcohol use; under physical examination: height, weight and blood pressure; under lab investigations: grade of proteinuria and glycosuria. Body Mass Index (BMI) was calculated by dividing weight in kg by square of height in metre. Blood Pressure (BP) was measured by Omron blood pressure apparatus and according Joint National Committee (JNC) guidelines, individuals was diagnosed with hypertension if systolic BP>140 mmHg and/or diastolic BP>90 mmHg on at least two occasions. History of diabetes was confirmed by case sheets, treatment card or medicines that the patient was taking and according to American Diabetic Association (ADA) guidelines, two abnormal blood sugar values (fasting blood sugar≥126 mg/dl or post-prandial blood sugar≥200 mg/dl) or random blood sugar≥200 mg/dl with classical symptoms of diabetes (polyphagia, polyuria, polydipsia) was diagnostic of diabetes.
Statistical Analysis
The data collected were entered in MS Excel and analysis was done using statistical software IBM SPSS version 20.0. All the categorical variables were described as proportions. Chi square test was done to compare between two proportions. Univariate analysis was done to estimate the OR with 95% CI.
Results
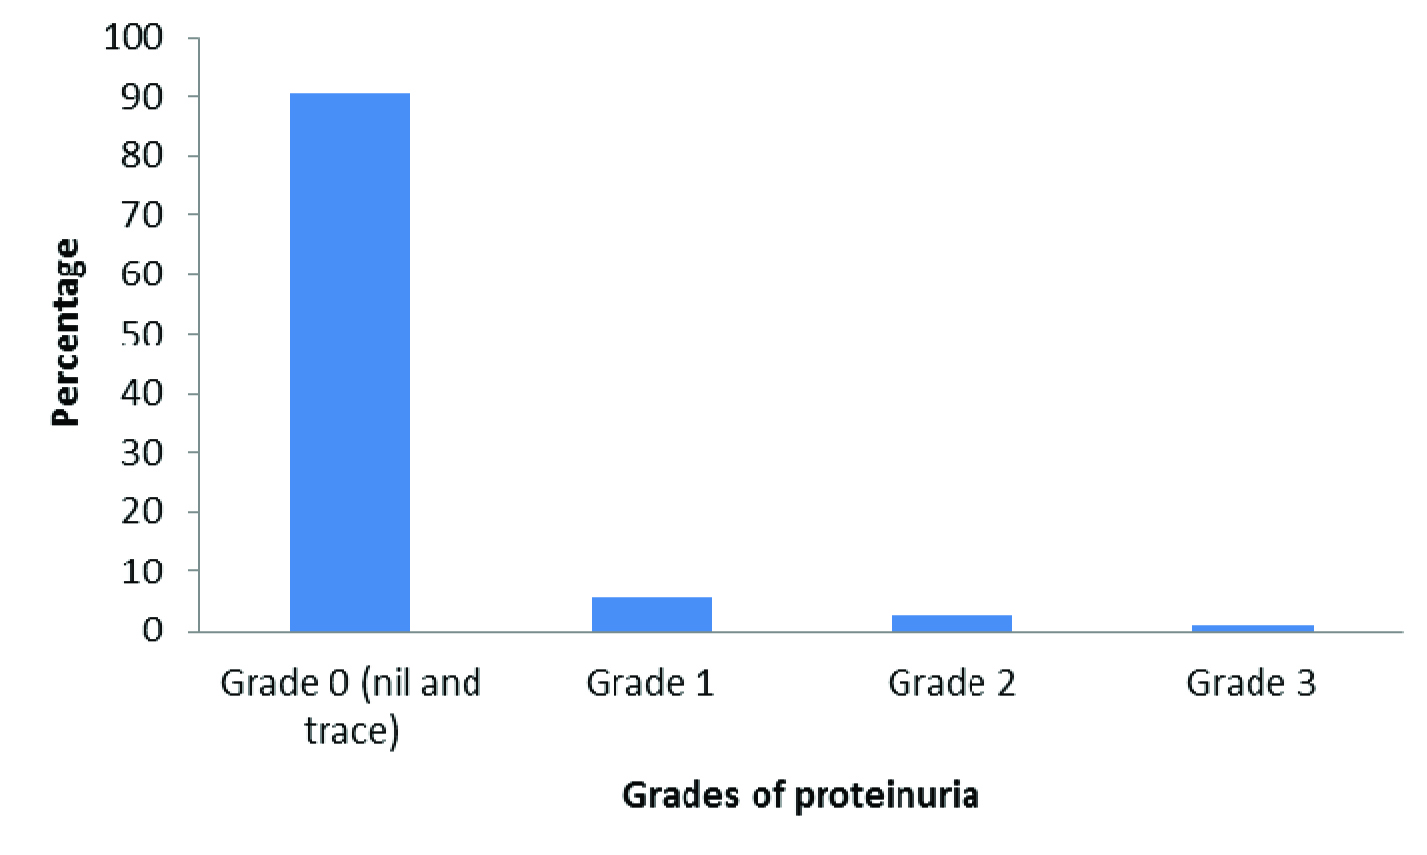
A total of 215 participants were interviewed. The mean age of the study participants was 38.5±12.8 years. The maximum proportion of study participants were from the age group of 18-30 years (30.7%) followed by the age group of 31-40 years (28.8%) while only 17.2% were from the age group of more than 50 years. With respect to gender, majority, 145 (67.4%) of the study participants were females. While 4.7% and 11.2% of participants used tobacco and alcohol respectively, 13.5% and 27.9% had diabetes mellitus and hypertension respectively [Table/Fig-1]. The prevalence of proteinuria was 9.3% (95% CI: 5.9-13.7). Out of the 20 study participants who had proteinuria, 12 of them had Grade 1, six of them had Grade 2 while two of them had Grade 3 proteinuria [Table/Fig-2]. The prevalence of glycosuria was found to be 13.5% (95% CI: 9.6-18.7). [Table/Fig-3] shows the bivariate analysis showing association between proteinuria with selected risk factors. In our study, there was no significant association found between gender, tobacco use, and alcohol use and BMI with proteinuria. In our study, we found that age more than 50 years is a risk factor for proteinuria {OR: 4.88, 95% CI: 1.67-14.19}. Similarly, we found that diabetes mellitus was also found to be a risk factor for proteinuria {OR: 12.02, 95% CI: 4.40-32.85} and participants with hypertension also had a higher odds of proteinuria {OR: 4.59, 95% CI: 1.77-11.90}.
Sociodemographic characteristics of participants.
| Variable | Number (%)(n= 215) |
|---|
| Age category (in years)<3031-4041-50>50 | 66 (30.7)62 (28.8)50 (23.3)37 (17.2) |
| GenderFemaleMale | 145 (67.4)70 (32.6) |
| Risk Factors:SmokingPresentAbsentAlcoholicPresentAbsentHypertensionPresentAbsentDiabetes MellitusPresentAbsent | 10 (4.7)205 (95.3)24 (11.2)191 (88.8)60 (27.9)155 (72.1)29 (13.5)186 (86.5) |
Grade of proteinuria among study participants (n=215)
Association of proteinuria with selected risk factors in study participants.
| Variable | PresentNumber (%) | AbsentNumber (%) | p-value | Odds RatioWith 95% CI |
|---|
| Age> 50< 50 | 9 (24.3)*11 (6.2) | 28 (75.7)167 (93.8) | 0.005** | 4.881 | 1.67 | 14.19 |
| GenderMalesFemales | 8 (11.4)12 (8.3) | 62 (88.6)133 (91.7) | 0.24 | 1.431 | 0.56 | 3.68 |
| SmokerPresentAbsent | 2 (20.0)18 (8.8) | 8 (80.0)187 (91.2) | 0.11 | 2.601 | 0.51 | 13.17 |
| AlcoholicPresentAbsent | 4 (16.7)16 (8.4) | 20 (83.3)175 (8.4) | 0.17 | 2.191 | 0.67 | 7.19 |
| Diabetes MellitusPresentAbsent | 11 (37.9)9 (4.8) | 18 (62.1)177 (95.2) | 0.001** | 12.021 | 4.40 | 32.85 |
| HypertensionPresentAbsent | 12 (20.0)8 (5.2) | 48 (80.0)147 (94.8) | 0.001** | 4.591 | 1.77 | 11.90 |
| Body Mass IndexOverweight (BMI ≥ 23)Normal (BMI < 23) | 12 (12.1)8 (6.9) | 87 (87.9)108 (93.1) | 0.41 | 1.521 | 0.56 | 4.13 |
*Figures in parenthesis are row percentages. Chi square test was applied to compare the proportions, **p-value less than 0.05 is considered statistically significant.
Discussion
The prevalence of proteinuria in our study population was 9.3%. Similarly a cross-sectional study carried out in a coastal area of Villupuram district of Tamil Nadu, showed a prevalence of 12.3% [4]. The latter study was done in an area with predominant Muslim peri-urban population where the risk of CKD was more; therefore in our present study, we find relatively less prevalence of proteinuria. A cross-sectional survey was carried out at certain selected slum areas of Mirpur at Dhaka city in Bangladesh which showed proteinuria prevalence of 7.7% by the dip stick method [7] which is low compared to our study. It could be due to the fact that the other study was conducted among a younger population as the mean age of their study population was 34.4 years while the mean age of our study population was 38.5 years.
Our study also observed the proportion of participants with diabetes mellitus and hypertension were 13.5% and 27.9% respectively. Similarly, a cross-sectional study done in Villupuram district of Tamil Nadu reported the prevalence of diabetes mellitus and hypertension to be 18% and 24.3% respectively [4] and a study done by Singh NP et al., showed that the study population had 31.2% prevalence of hypertension and 7.3% prevalence of diabetes mellitus [8], while a study carried out by Gupta SK et al., had 23.3% prevalence of hypertension [5]. Our study also focussed on the determinants of proteinuria. In the present study, the prevalence of proteinuria increased with increase in age. Studies conducted by Singh NT et al., showed a similar pattern [8]. According to the studies done by Modesti PA et al., and Ishigami T et al., the prevalence of proteinuria was more in men as compared to women similar to the present study finding [9,10]. Though in our study, smoking was not found to be a significant predictor of proteinuria, few studies conducted by Yamada Y et al., and Briganti EM et al., showed that cigarette smoking is a risk factor for proteinuria [11,12]. The study by Ishigami T et al., showed that subjects with higher serum Gamma-Glutamyl-Transpeptidase (GGT) level had a higher probability of proteinuria irrespective of alcohol consumption [10]. While study done by Cheungpasitporn W et al., showed no significant association between high alcohol consumption and risk for developing proteinuria similar to the observation in our study [13]. The present study showed that diabetes mellitus and hypertension were significant risk factors for proteinuria. Studies done by Modesti PA et al., and Yamada Y et al., also show the same [9,11]. The findings in this study and other similar studies across India show that the prevalence of risk factors for CKD is strikingly increasing day by day across the country. Individuals with these comorbidities are more prone for CKD compared to the general population. The participants who had proteinuria, hypertension and diabetes mellitus were counselled and further referred to higher health facilities for diagnosing kidney diseases and for their due treatment.
Limitation
Though dipstick method is easy and rapid, false negative and false positive results are unavoidable and limit its utility. The study was carried out among adult population in service area of a tertiary care institute in Puducherry, India. So the study result cannot be generalised to the entire population of Puducherry as the study population (35,000) is very small as compared to the total population of Puducherry (around 13 lacs). We need more population based studies to generalise the result.
Conclusion
The prevalence of proteinuria was high in our study population and was found to be 9.3% (95% CI: 5.9 to 13.7). The study concludes that diabetes mellitus, hypertension and age more than 50 years were found to be statistically significant risk factors for proteinuria. Due to the high burden of CKD prevailing in the community, early detection of kidney disease through simple screening technique like urine dipstick method which is an easy and an economical way to screen for kidney disease in primary healthcare setting can prove to be of immense help in early diagnosis of CKD. Further research can help in exploring the strategies that can be recommended in various settings to bring down the rising burden of CKD.
*Figures in parenthesis are row percentages. Chi square test was applied to compare the proportions, **p-value less than 0.05 is considered statistically significant.