Childhood obesity has reached alarming proportions in many countries causing serious public health concerns and is posing an urgent and serious challenge to basic healthcare delivery. The prevalence of obesity in infants, children and adolescents is rising around the world. Approximately, 41 million children under five years of age are affected by overweight or obesity. The calculated global prevalence of overweight (including obesity) in children aged 5-17 years is 10%, and the prevalence varies from over 30% in America to <2% in Sub-Saharan Africa [1].
Body Mass Index (BMI) for age is recommended internationally as a simple measure to identify obesity in children and adolescents [2]. However, there are several practical barriers associated with this method particularly in resourcepoor settings, therefore, a more cost-effective and practical alternative to BMI would be helpful. Such an approach may help to increase clinical assessment and public health surveillance of obesity in developing countries, like India, where the epidemic of obesity is emerging.
A cost-effective and more practical alternative to BMI could be MUAC. MUAC is an easy, quick and inexpensive anthropometric tool used in the assessment of nutritional status [3,4]. Although, not much is known on the potential for MUAC as a screening tool for measuring obesity in children, recent studies have suggested that MUAC can be accurately used to identify overweight and obesity in children [5-8]. However, no similar study has been reported from India and thus, this study provides an opportunity to determine MUAC as a practical alternative screening measure for overweight and obesity in children.
The objective of this study was to determine whether MUAC could be used to identify BMI-defined overweight and obesity in children and adolescents.
Materials and Methods
This cross-sectional study was conducted in public and private schools of Bareilly district in Uttar Pradesh, India. The schools were selected by simple random sampling from a list of all the schools in Bareilly district. There were a total of 138 schools in the list and they were divided into private and public schools and a total of 4 schools were selected with 2 schools in each category. Permission was obtained from the Institutional Ethics Committee of Rohilkhand Medical College and Hospital Bareilly, Uttar Pradesh, India and also from the respective school authorities. An informed written consent was obtained from one of the child’s parents and in addition assent was obtained from the child before conducting the study.
The study was conducted from October 2014 to November 2015. The study population consisted of children aged 5-14 years. The sample size was calculated based on an estimated prevalence of obesity of 10%, 95% confidence level and an estimated precision of 3% to obtain an age and gender-specific representative sample of children. The formula used was: n = (Z2 x P(1 - P))/d2. Based on the above calculation a total of 875 children (436 males and 439 females) were included in the study. Demographic data including name, age and sex was collected from the subjects in a questionnaire. Anthropometric details including height, weight and MUAC were recorded from all the subjects by a team of five 2nd year pediatric residents who were trained in anthropometry.
Anthropometric measurements: Standing height was measured to the nearest centimetres (cm) using a Stadiometer with the subject standing erect on a horizontal resting plane, bare footed and with the palms of the hands facing forward and the fingers pointing downwards. The height was measured keeping each subject’s head in the Frankfurt plane. The measurements were taken from the sole of the feet to the vertex of the head.
The weight of the patients was taken using the Omron HBF-212 Body Composition Monitor (Omron Corporation, Kyoto, Japan). The weight was measured to the nearest 0.1 kg according to the standard procedures. BMI was calculated by dividing weight (kg) by converted height (M2). The MUAC was measured to the nearest centimeter using a calibrated non-stretch tape with the left arm hanging relaxed and was taken midway between the tip of acromion and olecranon process. MUAC was measured with the child wearing light clothing and the sleeves rolled up.
The measurements and readings from each subject were taken twice and the average was used for analysis. For height and MUAC, two more measurements were obtained if the first two measurements were greater than 0.5 cm apart, and the average of the two closest measurements was used for analysis. For weight, two more measurements were obtained if the first two measurements were greater than 0.5 kg or 500 g apart and the closest two were averaged for analysis [8].
Definition of overweight and obesity: Overweight was defined in the present study using the revised IAP growth charts for height, weight and BMI for 5 to 18 year old Indian Children where Risk for overweight is defined as BMI falling between 23rd and 27th adult equivalent. risk for obesity is defined as BMI falling above the 27th adult equivalent [9].
Statistical Analysis
Data was analysed by SPSS software (version 23.0, SPSS Inc., Chicago, IL). Means and SDs of descriptive characteristics were calculated for participants of each sex with complete measurements. Differences between boys and girls were determined using unpaired t-tests for continuous variables and Chi-squared tests for categorical variables. ROC analysis was used to test the ability of MUAC to determine those children and adolescents identified as overweight by BMI for age. The participants were divided into sex-specific (male and female) and age-specific child (five–nine years) and adolescent (10–14 years) groups for analysis, these age groups were chosen based on WHO guidelines which were published previously [10]. The AUC is considered a measure of the use of the predictor variable and represents the compromise between the correct identification of high-risk (overweight) individuals (sensitivity) and the correct identification of low-risk (non-overweight) individuals (specificity). An AUC of 1 indicates the ability to perfectly distinguish between overweight and non-overweight participants (perfect test), whereas an AUC of 0.5 indicates that these results were experienced due to chance alone (worthless test). The categories used to summarize accuracy of AUC in ROC analysis were as follows: excellent (0.9–1), good (0.8–0.9), fair (0.7–0.8), poor (0.6–0.7) and fail (0.5–0.6). A test with an AUC ≥0.85 is generally considered an accurate test [11]. The optimal threshold was determined from the Youden index, which is the maximum value of J:
J = sensitivity + specificity – 1: The Youden index signifies the optimal sensitivity and specificity values yielding the maximum sums from the ROC curves.
Results
Descriptive characteristics of the sample are shown in [Table/Fig-1]. Overall, boys and girls did not significantly differ in mean height, weight, BMI or MUAC.
Descriptive characteristics of participants.
| Age group (years) | Sex | n | Age (years) Mean (SD) | Height (m)Mean (SD) | Weight (Kg)Mean (SD) | BMI (Kg/m2)Mean (SD) | MUAC (cm) Mean (SD) |
|---|
| 5-9 | Males | 222 | 7.0 (1.3) | 1.2 (0.06) | 24.0 (3.5) | 16.4 (0.7) | 17.6 (0.6) |
| Females | 221 | 6.9 (1.3) | 1.2 (0.07) | 23.5 (4.0) | 16.2 (0.9) | 17.7 (0.8) |
| p-value* | | 0.569 | 1 | 0.524 | 0.244 | 0.142 |
| 10-14 | Males | 214 | 11.9 (1.3) | 1.4 (0.06) | 37.7 (5.2) | 18.7 (1.1) | 20.3 (1.04) |
| Females | 218 | 11.9 (1.4) | 1.4 (0.05) | 38.1 (4.9) | 18.8 (1.5) | 20.5 (1.3) |
| p-value* | | 1 | 1 | 0.492 | 0.124 | 0.126 |
*- Mean differences between sexes were tested using unpaired t-test.
*- p-value <0.05 was considered significant.
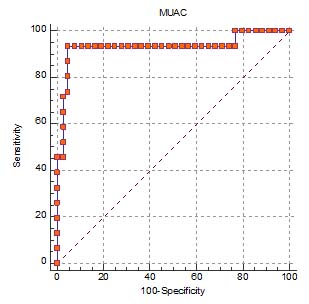
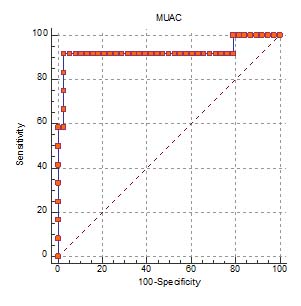
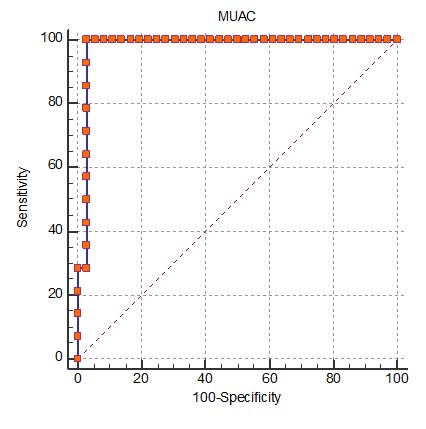
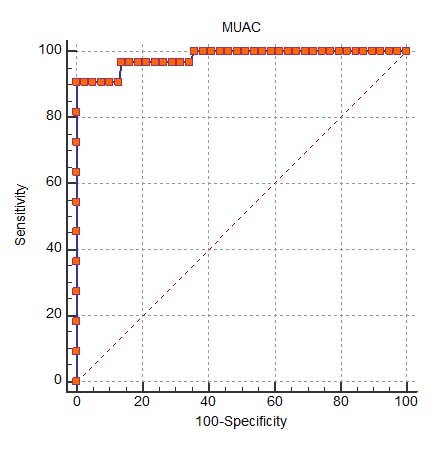
ROC curve depicting ability of MUAC to classify overweight in 5-9 year old males and females and 10-14 year old males and females are shown in [Table/Fig-2,3,4 and 5]. The results of the ROC curve analyses are presented in [Table/Fig-6]. AUC results were excellent for boys and girls in both the age groups (0.92-0.98). Sensitivity and specificity were high for both sexes (90–100%). The MUAC cut off to identify BMI-defined obesity was 18.8 cm and 19.4 cm for boys and girls of 5-9 age group; 23 cm and 23.3 cm for boys and girls of 10-14 age group.
ROC curve depicting ability of MUAC to classify overweight in 5-9-year-old males.
ROC curve depicting ability of MUAC to classify overweight in 5-9-year-old females.
ROC curve depicting ability of MUAC to classify overweight in 10-14-year-old males.
ROC curve depicting ability of MUAC to classify overweight in 10-14-year-old females.
Results of ROC curve analyses for the association between mid-upper arm circumference and overweight (including obesity) in children.
| MUAC (in cm)(at 95% CI) | AUC (95% CI) | Youden index | Sensitivity %(95% CI) | Specificity %(95% CI) | Correctly classified(%) | +LR | -LR |
|---|
| Males 5-9 years18.8(18.65-18.98) | 0.93 (0.87-0.96) | 0.97 | 93.4(82.1-98.6) | 95.1(89.1-98.4) | 94.5% | 19.44 | 0.06 |
| Females 5-9 years19.4(19.05-19.85) | 0.92(0.87-0.96) | 0.91 | 91.6(77.5-98.2) | 97.3(92.5-99.5) | 96.2% | 34.83 | 0.08 |
| Males 10-14 years23.0(22.84-23.47) | 0.98(0.94-0.99) | 0.93 | 100(91.6-100) | 97.22(92.1-99.4) | 98.4% | 36 | 0 |
| Females 10-14 years23.3(22.94-23.80) | 0.98(0.94-0.99) | 0.95 | 90.9(75.7-98.1) | 100(96.9-100) | 98.6% | 36 | 0.09 |
AUC, area under the curve; CI, confidence interval; ROC, receiver operating characteristic; LR, likelihood ratio.
Discussion
Exhaustive literature search reveals that this study is the first to examine if MUAC can be a useful, alternative and practical screening tool for obesity in a sample of children from India.
Findings of this study reveal that the simple and inexpensive MUAC is an accurate measuring tool to identify obesity in school children aged 5–14 years. Overall AUC results of 0.92-0.98 are consistent with excellent diagnostic accuracy and indicate that measurement of MUAC has a powerful ability to identify children who are classified as overweight/ obese by their BMI centiles, an accepted criterion for obesity and its associated cardiometabolic risk factors. Also, the sensitivity and specificity were in the range of 90-100%. The positive likelihood ratio ranged from 19-36 which again highlights the strong correlation between having a high MUAC and a high BMI.
Results of this study are consistent with previous investigations. Mazıcıolu MM et al., reported an AUC ranging from 0.64 to 0.94 for boys and girls aged between 6-17 years (MUAC vs. overweight/obesity) [5]. Similarly, Lu Q et al., found AUC values ranging between 0.93 and 0.98 for MUAC predicting overweight/obesity in a sample of Han children aged 7–12 years [6]. Also, Craig F et al., showed ROC-AUC values between 0.90 and 0.97 for MUAC predicting overweight/obesity in a sample of Black South African children and adolescents aged 5–14 years [7]. Finally, Chaput JP et al., found high accuracy level of MUAC for identifying obesity (overall AUC of 0.97). The optimal MUAC cut off values to identify overweight/obesity ranged between 23.2 and 26.2 cm depending on the country [8].
Measurement of MUAC has been used as a practical proxy for undernutrition, but the present study suggests that it might have future potential for public health surveillance of obesity, and as a screening tool to identify children or adolescents requiring further assessment and/or clinical management of obesity and its associated comorbidities. Traffic light colours of red (obese), amber (overweight) and green (normal weight) may be considered by field workers for the purpose of screening of children in developing countries [8]. Similar studies need to be conducted with other age groups to determine optimal MUAC thresholds. Adjustments may be necessary for pubertal development in older children given that maturation impacts body composition and therefore, the interpretation of results. Future studies should also relate MUAC to functional outcomes, i.e., the development of comorbidities associated with obesity such as Type-2 diabetes and cardiovascular disease and the presence of their risk factors.
Few studies have measured MUAC in large samples; the majority of research, to date, has focussed on children under five years of age and predominantly on the use of MUAC for the assessment of undernutrition [5,8,12]. A strength of our study is that it is one of the first studies done on overweight/obesity in a wide age group of school children (5-14 years) in a representative sample of Bareilly, an urban area of Northern India. We also used a highly standardized measurement protocol, the use of objective measurements and a rigorous quality control programme to ensure high quality data.
Limitation
One limitation of the present study is that the optimal cut offs in the MUAC distribution were not cross validated in other independent samples which would be necessary to correctly establish the value of MUAC for the assessment of overweight. Our study was restricted to one city only. These findings may not be representative of the whole country or even of the whole state of Uttar Pradesh. Finally, more such longitudinal studies will be needed to associate MUAC with not only obesity but also with its associated comorbidities.
Conclusion
The present study provides evidence that the inexpensive and practical MUAC measurement is an accurate index for identifying BMI-defined obesity in 5-14 year old children. Future work should expand to other age groups and assess functional outcomes (i.e., health risks) of a high MUAC in developing and developed countries.
*- Mean differences between sexes were tested using unpaired t-test.
*- p-value <0.05 was considered significant.
AUC, area under the curve; CI, confidence interval; ROC, receiver operating characteristic; LR, likelihood ratio.