Also, CCT is a significant risk factor for progression of ocular hypertension to POAG, thus an important parameter in the risk profiling of ocular hypertensives and glaucoma patients [6,7]. CCT is also a predictive factor for glaucoma progression in patients with higher baseline Intraocular Pressure (IOP). Since IOP measurement by applanation tonometry is influenced by CCT, it is important to obtain the reliable corneal pachymetry for each patient with glaucoma and adjust the IOP for the measured CCT [1,8]. There are numerous methods available to measure CCT. Currently, ultrasound pachymetry is viewed as the gold standard because it is very easy, fast and convenient to repeat several measurements to minimize error [7]. It also has high degree of intraoperator, interoperator and interinstrument reproducibility [9]. Ultrasound pachymetry is a contact procedure. It requires contact with the cornea and uses the Doppler Effect to determine thickness [4]. Dedicated noncontact AS-OCT devices are non-invasive and non-contact procedures, which relies on the principle of interferometry to detect minute differences in tissue depth [7]. They provide high resolution cross-sectional imaging of the cornea with both central and regional pachymetry. Also, sophisticated goniometry of the irido–corneal angle and other anterior segment structures are imaged along with it [7]. There are very few studies from India giving comparative accuracy of CCT measurements by ultrasound pachymetry versus AS-OCT [10].
Therefore, in this prospective study CCT measurements of AS-OCT was compared with CCT measurements of conventional ultrasonic pachymetry. The degree of systematic difference and the level of agreement between the two modalities were also investigated. Also, this study was done to find out the repeatability of AS-OCT for both central and pericentral areas.
Materials and Methods
A prospective cross-sectional study was conducted in a rural tertiary care eye hospital after the approval from the Institutional Human Ethics Committee. Patients above 40 years of age with clinically normal cornea attending Ophthalmology OPD from January 2015-June 2016, were included in the study. The sample size was calculated based on previous studies comparing CCT of ultrasound pachymetry and AS-OCT [10]. Considering an alpha error of 0.05 and statistical power of 95%, 120 eyes were required to be able to detect a difference of 10 microns. Informed written consent was obtained from each participant. Patients with previous ocular surgery, corneal ectasias, glaucoma, on topical medication for any ocular condition, one eyed patients, and those who did not give consent were excluded. A detailed history and examination was carried out. Visual acuity by Snellen’s chart, anterior segment examination by slit lamp, fundus examination by 78D/90D/direct ophthalmoscope was carried out. Non-contact CCT measurements (two readings) by OCT was first carried out followed by contact measurements using ultrasound pachymetry (25 readings). Subsequently IOP was measured by Goldman applanation tonometer. All measurements were carried out by a single examiner experienced in the use of the two devices.
Optical Coherence Tomography Imaging
A spectral domain OCT (OCT SLO Combination Imaging System, Optos, Florida, USA) with a cornea-lens to image the anterior segment was used. The system works at 830 nm wavelength and has a scan speed of 26,000 axial scans per second with a depth resolution of approximately 5 µm axial and 20 µm transverse. The cornea-lens produces telecentric scanning and captures the anterior segment images. There are two types of cornea-lenses:
Wide angle (long) lens for mapping an area of 6 mm;
High magnification (short) lens for mapping an area of 2 mm.
In this study, a high magnification short lens (2-mm mapping) was used.
Optical Coherence Tomography Pachymetry Scan Settings
The “Pachymetry” scan pattern settings in the OCT were used and the cornea was mapped. The corneal thickness was measured by an automated algorithm, that detects the distance between the anterior and posterior boundaries on the cross-sectional images of the cornea [3]. A 2 mm diameter pachymetry map [Table/Fig-1] was obtained.
2 mm-spectral domain OCT pachymetry map.
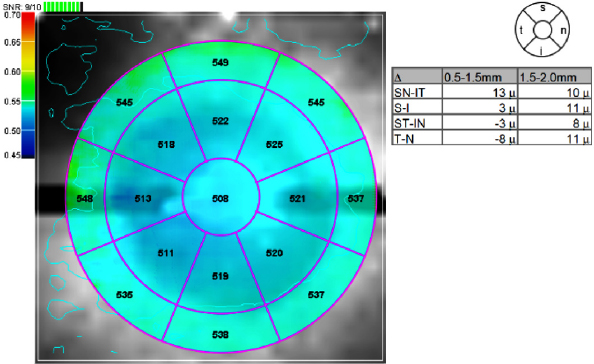
The pachymetry map was divided into zones by annular rings (0.5 mm, 1.5 mm and 2 mm) and octants. The average pachymetry measurement of each zone was displayed in its sector map. The average pachymetry of the central 0.5 mm zone was recorded as the OCT CCT. The average pachymetry of the octants i.e., Superior (S), Superotemporal (ST), Temporal (T), inferotemporal (IT), inferior (I), Inferonasal (IN), Nasal (N) and Superonasal (SN) zones from 0.5 mm to 1.5 mm diameter were recorded as pericentral corneal thickness.
Within a single visit, each eye was mapped for CCT twice with the patient in sitting position. The patient’s head was stabilized with a chin and forehead rest. The patient’s gaze was fixed with an internal fixation target. The OCT image was displayed as a real-time video to help in alignment. Patients were repositioned after each scan.
The two landmarks for centering the corneal map are the vertex and the pupil. Since pupil centration provided better repeatability than vertex centration, we used pupil as the landmark to centre the corneal mapping scans [3]. The real time video image of the eye and the circular overlay helped in centering the scan on the pupil.
Ultrasound Pachymetry
Ultrasound pachymetry was determined using A–scan (DGH technology, Inc, Pachette 2, USA). Prior to taking the measurement, the ultrasound pachymeter was calibrated according to the manufacturer’s instruction manual. A-scan velocity was set at 1640 m/s for all the measurements and then tested with an appropriate test block [11]. Topical anaesthesia used was proparacaine hydrochloride 0.5% eye drops. The patient was made to sit upright and was asked to look straight ahead. The hand held probe was placed perpendicularly on the center of the cornea, which was visually located by the investigator. All measurements of ultrasound pachymetry in the study were performed by the same investigator. Twenty five readings were obtained and averaged. Values with Standard Deviation (SD) of 5 µm or less were considered suitable for inclusion [8]. The probe was sterilized with alcohol after using for each patient.
Statistical Analysis
The CCT measurements of ultrasound pachymetry and AS-OCT of 120 patients (240 eyes) were compared. All statistical analyses were performed using SPSS software version 17.0. A p-value less than 0.05 were considered statistically significant. Right eye and left eye were compared separately and the results were summarized as Mean±SD, median, range and 95% confidence intervals. The CCT measured by OCT and ultrasound pachymetry was compared by paired t-test.
To evaluate the agreement between the two methods, we calculated 95% limits of agreement and visually depicted it using a Bland-Altman plot.
Repeatability of the OCT pachymetry map sector averages was assessed by pooled standard deviation obtained from the two measurements taken from each eye.
Results
In this prospective study, the study population included 120 subjects (240 eyes). There were 60 males and 60 females with a male: female ratio of 1. Average age of the subjects was 53.01±8.27 years. Average age of male subjects was 54.37±8.42 years. Average age of female subjects was 51.82±7.98 years. The age-sex distribution of the subjects is shown in [Table/Fig-2].
Age – sex distribution of the subjects.
| Age (years) | Male | Female |
|---|
| 40 -50 years | 22 | 33 |
| 51 - 60 years | 26 | 18 |
| 61 - 70 years | 10 | 8 |
| 71 - 80 years | 2 | 1 |
| Total | 60 | 60 |
Comparison of Central Corneal Thickness by OCT and Ultrasound Pachymetry
The mean CCT measurement by AS-OCT and ultrasound pachymetry of right eye of the subjects was 516.28±29.76 µm and 532.42±29.71 µm respectively. The values showed that:
OCT values were lesser than ultrasound values (mean difference 16.14 µm);
The difference in measurements by AS-OCT and ultrasound pachymetry was statistically significant (p < 0.001);
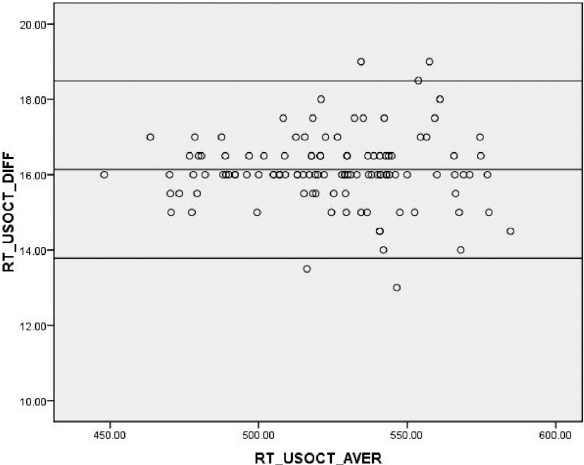
These results were confirmed by Bland-Altman analysis [Table/Fig-3]. The mean difference was 16.14 µm with 95% limits of agreement from 13.75 µm to 18.52 µm for right eye.
Bland-Altman analysis; mean difference was 16.14 µm with 95% limits of agreement from 13.75 µm to 18.52 µm in the right eye.
The mean CCT measurement by AS-OCT and ultrasound pachymetry of left eye of the subjects was 515.82±29.88 µm and 532.36±29.83 µm respectively. As noted for the left eyes, OCT values for CCT were lesser than measured by ultrasound (mean difference 16.54 µm), the difference in measurements by two methods being statistically significant (p < 0.001).
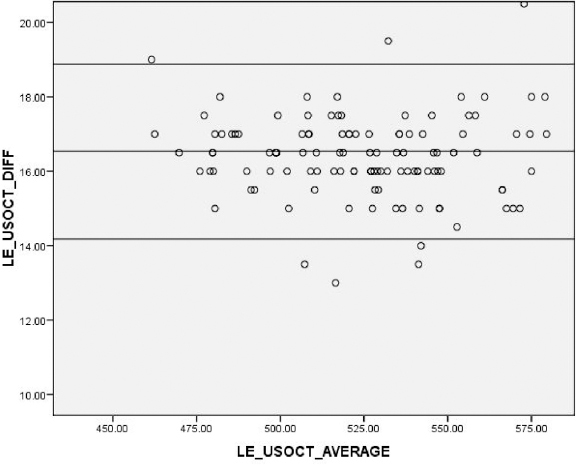
These results were confirmed by Bland-Altman analysis [Table/Fig-4]. The mean difference was 16.54 µm with 95% limits of agreement from 14.16 µm to 18.92 µm for left eye.
Bland-Altman analysis; mean difference was 16.54 µm with 95% limits of agreement from 14.16 µm to 18.92 µm in the left eye.
Corneal Thickness of the Pericentral Areas
The average OCT corneal thickness for the eight pericentral corneal sectors is shown in [Table/Fig-5] (right eye) and [Table/Fig-6] (left eye).
Corneal thickness in pericentral sectors by OCT (right eye).
| Scan center | Number of eyes (right) | T | ST | S | SN | N | IN | I | IT |
|---|
| Pupil | 120 | 520.47 ± 3.13 | 525.20 ± 3.06 | 529.44 ± 3.17 | 529.76 ± 3.20 | 527.70 ± 3.18 | 527.31 ± 3.13 | 524.78 ± 3.07 | 521.74 ± 3.09 |
T- Temporal, ST- Superotemporal, S- Superior, SN- Superonasal, N- Nasal, IN- Inferonasal, I- Inferior, IT- Inferotemporal
Corneal thickness in pericentral sectors by OCT (left eye).
| Scan center | Number of eyes (left) | T | ST | S | SN | N | IN | I | IT |
|---|
| Pupil | 120 | 525.70 ± 3.44 | 527.93 ± 3.30 | 528.77 ± 3.22 | 526.53 ± 3.14 | 524.08 ± 3.16 | 523.77 ± 3.05 | 523.50 ± 3.18 | 523.55 ± 3.26 |
T- Temporal, ST- Superotemporal, S- Superior, SN- Superonasal, N- Nasal, IN- Inferonasal, I- Inferior, IT- Inferotempor
Intra-session Repeatability of Optical Coherence Tomography
Repeatability of the OCT mapping for central sector measurement is 1.6 and 0.9 in the right and left eye, respectively. Repeatability of the OCT mapping for pericentral measurements ranges from 0.01 µm to 1.1 µm and 0.01 µm to 1.9 µm in the right eye and left eye, respectively. All values of repeatability measurements are in micrometers (µm).
Discussion
CCT is a frequently measured parameter in clinical practice. Though the indications vary, ultrasound pachymetry has been the gold standard for measurement of CCT. Development of newer modalities like Orbscan, Pentacam, AS-OCT has widened the options and introduced further accuracy. In this study, the CCT measurements of ultrasound (spot system) and spectral domain OCT (mapping system) were compared.
Comparison of Ultrasound Pachymetry CCT and AS-OCT CCT
This study showed that OCT values were lesser than ultrasound values. Several investigators who used Time Domain OCT (TD-OCT) have reported that ultrasound pachymetry CCT gave systematically higher values than that measured by TD–OCT: Kim HY et al., (26.3 µm greater), Wong AC et al., (31.9 µm greater), Prospero Ponce CM et al., (7.5 µm greater), Li EY et al., (14.4 µm greater), Zhao PS et al., (16.5 µm greater), Bechmann M et al., (49.4 µm greater), Wirbelauer C et al., (24 µm greater) [7,11-16]. Also, this study agreed well with Fourier domain OCT studies where again it was reported that the ultrasound CCT values were higher than the OCT values: Li Y et al., (19.7 µm greater), Grewal DS et al., (7.9 µm greater), Chang SW et al., (11.4 µm greater) [3,10,17]. It is unclear whether ultrasound or the OCT measures the corneal thickness accurately. It is also difficult to assess whether the two instruments took measurements from the same exact location [7]. However, evidences suggest that there is a systematic difference between OCT and ultrasound. The difference could be because of the differences in analysis software between the two modalities, hardware differences between the two modalities, methodological differences, and the use of local anaesthetic drops causing corneal oedema [18,19].
These differences account for the discrepancy and suggest that systematic differences do exist between the two modalities that are unrelated to interobserver differences [7]. Some theoretical explanations would be that:
In ultrasound, the uncertainty of the exact speed of sound in corneal tissue can affect CCT [7];
The exact location of the signal peak of posterior reflection point in the ultrasound pachymetry remains unknown. It may be located between the Descemet’s membrane and the anterior chamber. This ambiguity can cause greater variation in ultrasound measurement [17];
In OCT, uncertainty of the true index of refraction of infrared radiation in the cornea creates a source of error in calculating the CCT [14];
Corneal Thickness of Pericentral Sectors
Corneal thickness of pericentral sectors measured by OCT for the right and left eyes are shown in [Table/Fig-5,6] respectively. It is difficult to opine on clinical significance of minor differences in measurements of the pericentral sectors.
Repeatability of Spectral Domain OCT (SLO Combination Imaging System)
Spectral domain OCT has faster scan speed. Thus, the patient and machine motion artifacts during the scan are minimized. The repeatability of the pachymetric measurements is also good [17].
In this study, intrasession repeatability was measured. Our results showed 1.6 µm and 0.9 µm repeatability for CCT measurements in right and left eye respectively. Repeatability of the OCT mapping was 0.01 µm to 1.1 µm and 0.01 µm to 1.9 µm in the right eye and left eye respectively for pericentral areas (0.5 mm – 1.5 mm diameter ring). This performance was better than those reported for both time domain and SD-OCT in literature. Li H et al., showed intrasession repeatability of 4.9 µm with Visante and 5.8 µm with SL–OCT. They also showed intersession reproducibility of 6.3 µm with Visante and 7.6 µm with SL–OCT. This study performance was better than Li H et al., TD-OCT study, agreeing with the fact that SD-OCT showed better repeatability than TD–OCT for pachymetry mapping. This is due to the higher scan speed and higher resolution of SD–OCT than TD-OCT [20]. Prakash G et al., showed repeatability of 2.1 µm (central) and 3.6 µm (pericentral) [21]. Li Y et al., showed repeatability of 1.3 µm – 1.7 µm (central) and 2.8 µm– 3.9 µm (pericentral) [3]. This study repeatability was better than Li Y et al., and Prakash G et al., [3,21]. The reason could be Li Y et al., and Prakash G et al., [3,21] used a 6 mm mapping cornea lens, whereas a 2 mm mapping cornea lens was used in this study. So a 2 mm cornea lens produced better repeatability than a 6 mm cornea lens for mapping the central cornea. This is the only study to have used a 2 mm cornea lens for corneal mapping. Previous studies have used only 6 mm wide angle (long) lens for corneal mapping [3,21]. Advantages of a 2 mm map is high magnification of the central 2 mm of cornea and detailed study of the central corneal contour and its thickness. However, inability to screen the peripheral cornea in pellucid marginal degeneration, Terrien’s marginal degeneration and keratoconus remain the limitations of 2 mm corneal scan.
Repeatability of Ultrasound CCT Versus AS-OCT CCT
Literature showed that though both devices have good repeatability, AS-OCT has slightly better repeatability than ultrasound pachymetry [22,23]. Vollmer L et al., showed repeatability of 2.04 µm with ultrasound pachymetry and 1.92 µm with SD-OCT [22]. This study with SD-OCT showed repeatability of 0.01 µm – 1.9 µm, thus agreeing with Vollmer L et al., [22].
Limitation
There is still no standardized way to measure CCT by OCT due to the lack of inter-instrument repeatability and different types of OCT devices operating on different scan lengths. Despite faster scanning speeds and more scanning points, SD-OCT scans in only eight meridians and derives the thicknesses in each sector by interpolating points sampled along these meridians. Therefore, small areas between the meridians are not shown in the map. In this study, all patients participating had normal clear corneas. This study does not include data on scarred and post-refractive surgery corneas.
Conclusion
The CCT measurement by ultrasound pachymetry gives higher values compared to AS-OCT measurements. Hence, they cannot be interchangeably used in clinical practice. The AS-OCT provides highly repeatable pachymetry map measurements both centrally and pericentrally.