Umbilical Cord (UC) is a tube-like structure connecting the foetus to the placenta. It is the most important part of the foetoplacental unit with primary functions of supplying oxygenated, nutrient rich blood to the foetus and taking away nutrient depleted deoxygenated blood back to placenta. It begins to appear in the 4th week of gestation [1]. At term gestation, normal umbilical cord is a 50-60 cm long structure with blood vessels (two arteries and one vein) surrounded by Wharton’s jelly which is composed of collagen fibers, cavernous and perivascular spaces [2,3].
Routine antenatal sonographic evaluations are restricted for assessment of a number of umbilical vessels. Some sonologists do doppler assessment of umbilical blood flow as well. Altered constitution or metabolism of umbilical cord are observed in various conditions during pregnancy, like Intrauterine Growth Retardation (IUGR), preeclampsia, Pregnancy Induced Hypertension (PIH), diabetes and foetal distress [3,4]. Hence, umbilical cord constitution and morphological changes can be a predictor for adverse maternal and foetal outcome [5]. But literature is deficient on morphological studies on normal umbilical cord. An extensive review of literature about the umbilical cord cross-sectional area and the foetal outcome has returned only very few studies from the west [1,3-5]. No studies are available in the Indian population. Therefore, we undertook the study to find correlation of umbilical cord cross-sectional area with foetal anthropometric measurements and to establish the reference intervals of cross-sectional area of the umbilical cord during gestation.
Materials and Methods
This cross-sectional study was conducted among 437 normal pregnant women who underwent a routine antenatal sonogram at the Department of Radiodiagnosis, Sri Siddhartha Medical College, Tumakuru, Karnataka, India, during the study period from January 2015 to July 2016. After applying the exclusion criteria a total of 214 normal pregnant women were included and evaluated in the study. The study was approved by the Institutional Ethical Committee and written informed consent was obtained from the participants.
Our inclusion criteria were normal singlet on pregnant women between the age group of 20-35 years and gestational age 24-39 weeks, based on Last Menstrual Period (LMP). We excluded pregnancies completed with co-morbid conditions like gestational diabetes, preeclampsia, PIH, IUGR, oligohydramnios, polyhydramnios and Intrauterine Death (IUD). All foetuses with the congenital anomalies were excluded.
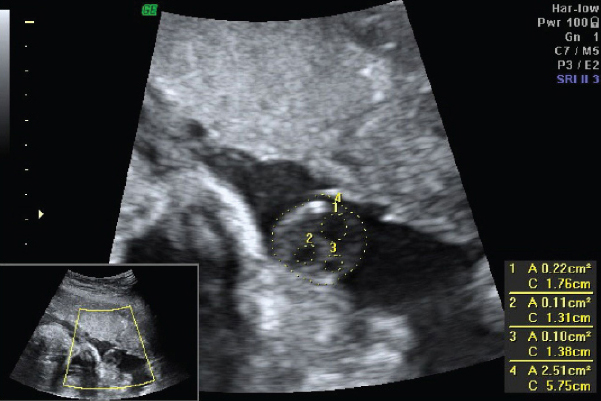
To avoid bias all the patients were examined with the same machine (Volusion GE) by the same sonologist. The following parameters were studied: BPD, HC, AC, FL, EFW and umbilical cord cross-sectional area (CA). The umbilical cord cross-sectional area was calculated at a plane immediately close to the umbilical cord insertion to the foetal abdomen within the maximum distance of 1 cm [Table/Fig-1] [4].
Sonographic measurement of umbilical cord cross-sectional area: (1) Cross-section area of umbilical vein; (2,3) Cross-sectional area of umbilical artery; (4) Cross-sectional area of umbilical cord.
Statistical Analysis
The mean and standard deviation of cross sectional area of umbilical cord were calculated for different gestational age groups. The data obtained were statistically analysed using SPSS software version 18.0. The relationship between foetal anthropometric parameters and umbilical cord cross-sectional area was assessed using spearman rank correlation. A p-value <0.05 was considered as statistically significant. The 5th, 10th, 50th, 90th and 95th percentiles of umbilical cord cross-sectional area were calculated for each gestational groups using polynomial regression analysis.
Results
In our study, a total number of 214 normal pregnant women were evaluated. The mean age of study population was 25.08±3.5 years and the mean gestational age was 34.42±2.5 weeks. [Table/Fig-2] shows the mean and the standard deviation for umbilical cord cross-sectional area for each gestational age. We observed that the mean umbilical cord cross-section area increases steadily with gestational age for up to 34 weeks and then it declines.
Measurements of cross-sectional area of umbilical cord for each gestational age groups.
| Gestational Age Week (Days) | Number | Mean ± Standard Deviation (mm2) |
|---|
| 24 (1-6) | 4 | 132.8 ± 7.632 |
| 25 (1-6) | 2 | 133.5 ± 2.121 |
| 26 (1-6) | 5 | 143.8 ± 12.28 |
| 27 (1-6) | 3 | 164.0 ± 5.568 |
| 28 (1-6) | 8 | 168.1 ± 8.34 |
| 29 (1-6) | 4 | 160.0 ± 15.71 |
| 30 (1-6) | 5 | 168.8 ± 10.71 |
| 31 (1-6) | 7 | 177.7 ± 19.25 |
| 32 (1-6) | 12 | 181.6 ± 19.25 |
| 33 (1-6) | 15 | 182.4 ± 34.78 |
| 34 (1-6) | 33 | 189.3 ± 34.17 |
| 35 (1-6) | 49 | 172.0 ± 32.20 |
| 36 (1-6) | 26 | 178.7 ± 35.22 |
| 37 (1-6) | 28 | 173.0 ± 38.37 |
| 38 (1-6) | 6 | 143.0 ± 36.27 |
| 39 (1-6) | 7 | 126.6 ± 14.59 |
[Table/Fig-3] shows the 5th, 10th, 50th, 90th and 95th percentiles of umbilical cord cross-sectional area for each gestational age.
Percentiles distribution of umbilical cord cross-sectional area.
| Gestational Age Week (Days) | Percentiles |
|---|
| 5th | 10th | 50th | 90th | 95th |
|---|
| 24 (1-6) | 124.0 | 124.0 | 132.5 | 142.0 | 142.0 |
| 25 (1-6) | 132.0 | 132.0 | 133.5 | 135.0 | 135.0 |
| 26 (1-6) | 134.0 | 134.0 | 144.0 | 155.0 | 155.0 |
| 27 (1-6) | 158.0 | 158.0 | 165.0 | 169.0 | 169.0 |
| 28 (1-6) | 155.0 | 155.0 | 167.0 | 180.0 | 180.0 |
| 29 (1-6) | 137.0 | 137.0 | 180.0 | 183.0 | 183.0 |
| 30 (1-6) | 170.0 | 170.0 | 172.0 | 178.0 | 178.0 |
| 31 (1-6) | 156.0 | 156.0 | 171.0 | 210.0 | 210.0 |
| 32 (1-6) | 152.0 | 152.3 | 184.0 | 209.7 | 210.0 |
| 33 (1-6) | 152.0 | 153.2 | 174.0 | 250.6 | 289.0 |
| 34 (1-6) | 132.0 | 143.6 | 190.0 | 238.0 | 254.7 |
| 35 (1-6) | 139.5 | 150.0 | 172.0 | 209.0 | 226.0 |
| 36 (1-6) | 103.0 | 114.9 | 180.0 | 214.0 | 243.9 |
| 37 (1-6) | 107.4 | 114.0 | 183.5 | 221.5 | 244.9 |
| 38 (1-6) | 102.0 | 102.0 | 135.0 | 185.0 | 185.0 |
| 39 (1-6) | 112.0 | 112.0 | 122.0 | 149.0 | 149.0 |
[Table/Fig-4] represents the spearman’s correlation (r and p) values between umbilical cord cross-sectional area and foetal anthropometric measurements (p<0.05). We observed a very strong correlation between HC and umbilical cord cross-sectional area. Strong correlation observed between femur length, estimated foetal weight and umbilical cord cross-sectional area.
Spearman’s correlation between umbilical cord cross-section area and foetal anthropometric parameters.
| Fetal anthropometric parameters | Correlation coefficient | p-value |
|---|
| Biparietal Diameter (BPD) | 0.212 | 0.01 |
| Head circumference (HC) | 0.864 | <0.001 ** |
| Abdominal Circumference (AC) | 0.390 | 0.005 |
| Femur Length (FL) | 0.633 | 0.04* |
| Estimated Foetal Weight (EFW) | 0.666 | 0.009* |
Very Strong Correlation,
Strong Correlation
Discussion
Our study establishes the reference values for umbilical cord cross-sectional areas during the different gestational age. Weissman et al., did the first sonological study on umbilical cord cross-sectional diameter for various gestational ages [6]. Umbilical cord cross-section is not always circular and hence measuring umbilical cord diameter alone cannot be considered as accurate parameter. To overcome this limitation we calculated the cross-sectional area at a plane immediately next to the umbilical cord insertion to the foetal abdomen within a maximum distance of 1 cm as explained by Raio L et al., [4].
Normal umbilical cord consists of three vessels (two arteries and one vein) surrounded by Wharton’s jelly. Wharton’s jelly occupies almost 70% of the cross-sectional area of normal umbilical cord [7]. Alteration in the composition of Wharton’s jelly like water content, glycosaminoglycans, and extracellular matrix determines the umbilical cord cross-sectional area [8,9]. An umbilical cord was defined as ‘lean’ and ‘large’ when its sonographic cross-sectional area was below the 10th percentile and above the 95th percentile for gestational age respectively [10,11]. Lean umbilical cord with reduced Wharton’s jelly is a marker of the various obstetrical pathologies (like PIH, preeclampsia) and poor perinatal outcome (like foetal distress, intrauterine growth restriction and even death) [2,4,12]. Larger umbilical cord cross-sectional area is observed in diabetic mothers [11,13].
Weissman A et al., observed that cord diameters increases progressively with the gestational age up to 32 weeks and then attains a plateau. In our study, we have observed that mean umbilical cord cross-section area increases steadily with gestational age up to 34 weeks and then it declines. These observations were in agreement with the results of Togni FA et al., and Raio L et al., [Table/Fig-5] [1,4]. Barbieri C et al., and Rostamzadeh S et al., observed that umbilical cord cross sectional area was linearly increasing upto 32 and 30 weeks respectively, tending to stabilizes from then onwards [5,12]. This disparity with our results may be due to difference of the study populations.
Comparison of mean umbilical cord area among various populations.
| Gestational Age | Mean |
|---|
| Raio L [4] | Togni FA [1] | Barbieri C [5] | Rostamza- deh S [12] | Present Study |
|---|
| 24 | 127.8 | 136.0 | 168.4 | 99.3 | 132.8 |
| 25 | 128.0 | 159.9 | 171.9 | 145.4 | 133.5 |
| 26 | 139.0 | 175.1 | 190.2 | 166.4 | 143.8 |
| 27 | 143.0 | 183.9 | 193.1 | - | 164.0 |
| 28 | 143.4 | 199.0 | 210.4 | 209.9 | 168.1 |
| 29 | 186.3 | 202.5 | 218.1 | 178.9 | 160.0 |
| 30 | 186.6 | 201.9 | 226.0 | 187.8 | 168.8 |
| 31 | 187.5 | 218.4 | 239.2 | 182.4 | 177.7 |
| 32 | 187.9 | 217.4 | 235.2 | 185.2 | 181.6 |
| 33 | 189.9 | 220.4 | 231.7 | 181.1 | 182.4 |
| 34 | 192.5 | 219.2 | 237.7 | 195.8 | 189.3 |
| 35 | 182.6 | 233.7 | 241.9 | 187.3 | 172.0 |
| 36 | 181.7 | 228.0 | 230.8 | 190.0 | 178.7 |
| 37 | 181.5 | 217.4 | 235.7 | 167.4 | 173.0 |
| 38 | 163.0 | 227.1 | 238.1 | 186.5 | 143.0 |
| 39 | 149.4 | 205.7 | 241.1 | 198.6 | 126.6 |
Togni FA et al., observed a significant correlation between umbilical cord cross-sectional and other foetal anthropometric measurements like BPD, HC, AC, FL, and EFW [1]. In our study, we also observed a similar correlation between all the foetal anthropometric measurements and umbilical cord cross-section area [Table/Fig-5]. All the parameters increase with gestational age with a positive correlation. Various other studies have also shown a strong positive correlation between these parameters and umbilical cord cross-sectional diameter and area [2,6,14-17]. Hence, umbilical cord cross-sectional area can also be considered as sonographic parameters for foetal growth assessment.
With the expansion of modern ultrasonographic technologies, it is now possible to diagnose/predict many adverse perinatal outcomes by simple evaluation of umbilical cord morphology. But there exist only very few studies establishing a reference value for these parameters. We could not find such other studies on reference value for umbilical cord cross-sectional area in the Indian population. The reference values of umbilical cord cross-sectional area in normal pregnancy, for the Indian population, established in this study can be used as reference to later studies involving various obstetrical pathologies like diabetes mellitus, preeclampsia etc., and to identify those foetus at risk of IUGR/IUD.
Limitation
The major limitation of our study was the low sample size. We suggest further studies with bigger sample sizes to validate the results of the present study.
Conclusion
Measurement of umbilical cord cross-sectional area is an easy procedure which can be included in the routine antenatal sonographic evaluation. Reference values of umbilical cord cross-sectional area in our study can be used to predict poor perinatal outcome and to detect or recognize foetuses at risk. Such pregnancies should be closely followed up for the successful perinatal outcome.
**Very Strong Correlation,
*Strong Correlation