Orthodontics is science which deals with jaws, teeth, occlusion and dentoskeletal morphology. This theoretical and practical understanding of the subject helps us in not only predicting the growth and development of the craniofacial structures but also help us in diagnosis, and planning the treatment in accordance. The key factors to attain a well balanced and stable occlusion are by achieving centric occlusion, centric relation and functional occlusion, also by taking into consideration all the compensatory curves [1].
Curve of Spee is a line drawn beginning at incisal edge of the lower anterior teeth and following the cusp tips of the bicuspids and molars, continuing as an arc through the condyle on either side [2]. Curve of Spee has a radius about 6.5 cm to7.0 cm and it was named after the German embryologist Ferdinand Graf von Spee [3].
Andrews in his landmark article published in 1972 stressed on curve of Spee, and the influence of curve of Spee on the stability of the occlusion [4]. Literature also suggests that curve of Spee has a biomechanical function while chewing food by increasing the crush –shear ratio between the posteriors [5]. Curve of Wilson defined by a line tangent to the buccal and lingual cusps of the mandibular posterior teeth bilaterally [6].
The newer advancements like CBCT is used in this study for measuring the curve of Wilson and helps in understanding its comprehensiveness and influence on stable occlusion. Various studies had also mentioned on the measurement and significance of compensatory curves [7-11]. Monson described a three-dimensional (3-D) sphere combining the anterioposterior curve and the mediolateral curve, with the mandibular incisal edges and cusp tips touching the sphere [11]. The lacunae highlighted in our article were none of the compensatory curves were correlated in literatures earlier. Hence, we aimed to evaluate the correlation between the curve of Spee, curve of Monson and curve of Wilson, their influence on dentoskeletal morphology and their contribution to occlusal stability. This study focuses on correlation of compensatory curves and it helps in diagnosis and treatment planning for various malocclusion.
Materials and Methods
This study was conducted in Indira Gandhi Institute of Dental Sciences, Puducherry, India. The study was done after obtaining clearance from Institutional Review Board. Study included 104 upper and lower cast which were retrieved from the Department of Orthodontics from January 2016 to August 2016. The criteria included to obtain the cast were Angles Class-I and Class-II molar relationship and excluded Angles Class-III molar relationship.
Marshall SD et al., in his work on development of the curve of Spee mentioned that the mean depth of curve of Spee for Class I malocclusion was found to be 2.02±0.78 mm [8]. Since Class II malocclusion usually presents with accentuated curve of Spee, an increase of 25% of mean depth of curve of Spee can be expected, with α error of 0.05 and with a power of 80%. The minimum sample size is 52 for each group. As the present study involves two groups, the minimum total sample size will be 104.
Digital vernier caliper and stainless steel scale were used for the precise measurement when calculating the curve of Spee. A calibrated sphere (7″ inch, 8″ inch and 9″inch) were used to estimate the curve of Monson. CBCT was used to evaluate the curve of Wilson.
Curve of Spee
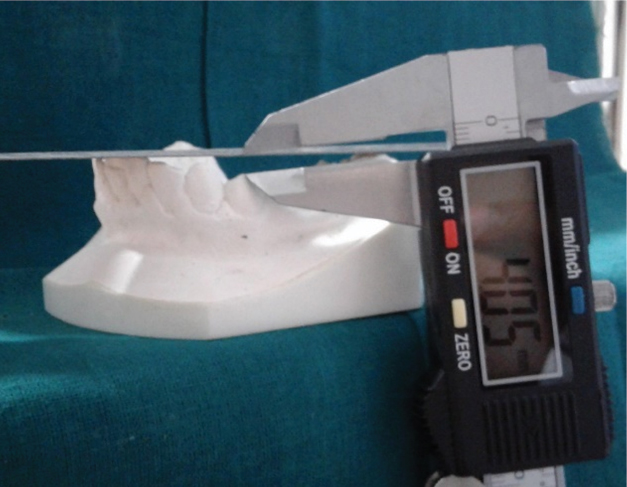
Assessment of curve of Spee is done by placing a stainless steel scale from the tip of the incisal edges of mandibular incisors to occlusal surface of second molar. A digital vernier caliper is used to measure the curve; the curve is measured from the stainless steel scale to the deepest point in the premolar region. This process was done for both right and left segments of the mandibular cast shown in [Table/Fig-1]. The average mean value was taken for both right and left sides. This process was done for all the 104 study models [10].
Measurement of curve of Spee using digital vernier calliper.
Curve of Monson
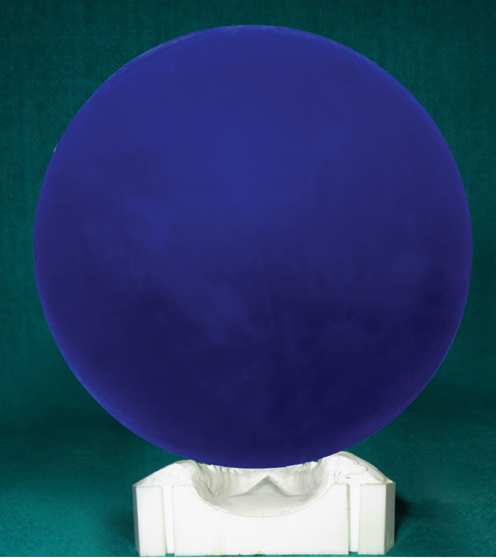
To evaluate the curve of Monson, a 7″ inch sphere, 8″inch sphere and 9″inch sphere is procured which is reliable and stable. As suggested by GS Monson an 8″ inch specially fabricated sphere is placed on the occlusal surfaces of the mandibular cast and checked for the contact points in the incisal edges in the anterior and buccal cusp tips of posteriors. This procedure was replicated manually from the original study where the Monson sphere was estimated by fitting a sphere to the cusp tips using a least-squares method [11]. When all the incisal edges in anterior and buccal cusp tips of posteriors are not in contact with 8″ inch sphere, then it is reduced by 1″inch (7″inch sphere) or increased by 1″ inch (9″inch sphere) to check for its maximum occlusal contacts in anterior and posteriors of the mandibular study cast shown in [Table/Fig-2].
Measurement of curve of Monson using an 8″ inch sphere.
Curve of Wilson
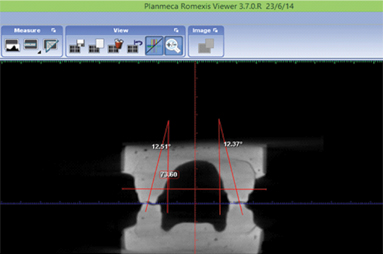
Assessment of curve of Wilson was done by subjecting all the 104 samples to CBCT image taken in promax 3-D proface machine. While exposing, the study models was placed on a stable platform. CBCT was calibrated by the experienced technician and the duration of the exposure was 14 second as per the manual. To calculate the angulation of Wilson curve the 3-D image is axially sliced to the maximum contact point between the first and second molar.
Curve of Wilson was measured by tracing molar axis that is the line joining the occlusal groove and furcation of first molar. A reference line was created using right and left bone WALA point (modifying original WALA point by Andrews defined as the highest prominence of the soft tissue of the buccal alveolar crest) [12]. The inclination of left and right molar was measured by drawing a line parallel to reference line. The axial line forms an angle with the vertical line and the angle is calculated on right and left sides and average value was measured in [Table/Fig-3].
Measurement of curve of Wilson in CBCT study model using planmeca romexis software.
Statistical Analysis
All the parameters were measured by a single investigator to minimize the bias. The data was subjected to statistical analysis. Independent t test was done to find the significance of mean value between the groups and Pearson correlation coefficient analysis was done to evaluate the correlation between the compensatory curves with a significant p<0.001 using SPSS (version 19.0).
Results
The mean and standard deviation between the groups shown in [Table/Fig-4] is for all three curves respectively.
Mean and standard deviation for group I and group II.
| CompensatoryCurves | Group I | Group II |
|---|
| Mean | Std. deviation | Std. Error | Mean | Std. deviation | Std. Error |
|---|
| Curve of Spee (mm) | 1.844 | 0.6337 | 0.0879 | 3.188 | 0.5441 | 0.0755 |
| Curve of Monson(inch) | 7.65 | 0.590 | 0.082 | 7.40 | 0.569 | 0.079 |
| Curve of Wilson(degree) | 12.0544 | 0.954440 | 0.1323 | 16.4947 | 1.239422 | 0.1718 |
Using independent sample t-test, comparison of mean of curve of Spee between the groups showed a mean difference of -1.3433 mm, for the curve of Monson, the mean difference was 0.250 and curve of Wilson showed mean difference of -4.440288° in [Table/Fig-5] with a significant p-value<0.001.
Independent sample t-test for Group I and Group II.
| Compensatory Curves | Mean difference | Std. error difference | 95% confidence interval of the difference | p-value |
|---|
| Curve of Spee | -1.3433 | 0.1158 | -1.5730 | -1.1135 | <0.001 |
| Curve of Monson | 0.250 | 0.114 | 0.024 | 0.476 | <0.001 |
| Curve of Wilson | -4.4402 | 0.216933 | -4.8705 | -4.0100 | <0.001 |
[Table/Fig-6] shows the mean value obtained from correlation coefficient analysis between Group I and Group II. When curve of Spee compared with curve of Wilson the mean value was 0.620 with a significant p<0.001 at 0.01 level which indicates positive correlation. When curve of Monson compared with curve of Wilson, the mean value was -0.203 with a significant p-value<0.039 at 0.05 level that denoted weak correlation between each other. When curve of Monson compared with curve of Spee, the mean value was -0.099 with a p<0.319 which was insignificant.
Pearson correlation coefficient analysis for Group I and Group II.
| CompensatoryCurve | Curve of Wilson Mean (Group II) | Curve of spee Mean (Group II) | Curve of Monson Mean (Group II) |
|---|
| Curve of Spee Mean (Group I) | 0.620** | 1 | -0.099 |
| p-value | 0.000 | | 0.319 |
| Curve of Monson Mean (Group I) | -0.203* | -0.099 | 1 |
| p-value | 0.039 | 0.319 | |
| Curve of Wilson Mean (Group I) | 1 | 0.620** | -0.203* |
| p-value | | 0.000 | 0.039 |
| Total Sample | 104 | 104 | 104 |
*Significant, ** Highly significant
Discussion
Our study focuses on the relationship between the curve of Spee, curve of Monson and curve of Wilson. Relationship of these curves greatly influences the dentoskeletal morphology and occlusal stability. We measured the mean value of curve of Spee for Group I and II was 1.844 mm and 3.188 mm respectively which clearly denoted that the value for Class II is higher than Class I. The comparison between the Group I and Group II mean to evaluate the curve of the Spee indicates the mean difference of -1.3433 mm.
This result indicate the average depth of curve of Spee in Group I is minimal when compared to Group II. The depth of curve of Spee was influenced by the position of the mandible with respect to the anterior cranial base. The negative mean value suggests that more the mandible was positioned anterior the depth of curve of Spee was less.
Shannon KR and Nanda R in their work found that there was significantly deeper pre-treatment curve of Spee with deep bite measurements in Class II than Class I [7]. Batham PR et al., suggested that the subjects with less curve of Spee depth have Class I skeletal pattern and deep curve of Spee have Class II pattern prominently having deep overbite, elevated anterior teeth, depressed premolars and mesially inclined molars [10].
Similar study results were obtained from Negi SK et al., who found that curve of Spee is deeper in Class II than Class I with with a mean value of 2.06 mm to the curve of occlusal plane [3].
On calibrating curve of Monson, we obtained a mean value of 7.65 inch and 7.40 inch and radii of 97.1 mm and 93.9 mm for Group I and II respectively and with the mean difference 0.250 between Group I and Group II with significant p<0.001.
Nam SE et al., studied curve of Monson and the total mean radii of Monson sphere which was 110.89 ±25.75 mm. This was larger than the originally suggested by Monson [11]. Ferrario VF et al., showed the data as 101.30±23.56 mm in European young adult [13]. Our study results were closer with the results obtained by Nam SE et al. and Ferrario VF et al., [11,13] However, in the study done by Kagaya K et al., amongst Asian adult population the value of Monson sphere was 110.6 mm which was increased when compared with our results [14].
Not much research has been done to access the Monson curve and apply the results obtained for orthodontic diagnosis and research. Intercanine and intermolar width is generally used as standard guidelines for the transverse position of the teeth. But we believe curve of Monson should be taken as a golden standard in association with the intercanine and intermolar width, as it includes the form of the anterior teeth. Monson curve should be evaluated to obtain a standard mean radius for specific malocclusion such as Class I, Class II and Class III malocclusion and it should also be standardized for the ethnic groups.
Monson curve should be used as a guideline for fabrication of the arch wires which influence the transverse position of the teeth in the mandibular arch and in turn influence the transverse position of teeth in maxillary arch. Variation in arch forms can lead to transverse expansion or constriction leading to post treatment relapse. These arch wires selected for the orthodontic treatment should coincide with the mean values obtained for specific malocclusion. Monson curve value should be taken as an indication for expansion in the mandibular arch; these mean values of Monson curve will help in treatment planning in transverse plane and prevent unnecessary expansion or constriction of the dental arches.
On studying, curve of Wilson the mean degree obtained was 12.0544 and 16.4947 for Group I and II and the mean difference was -4.440288° with a significant p-value<0.001.
Surendran Sowmya V et al., suggested that flat curve of Wilson affects the masticatory function that might affect chewing food on occlusal table [15].
The Class I study models which has lesser degree of curve of Wilson is ideal but, the Class II sample showed increased angulation denotes the abnormality that prevents the tongue to push the bolus towards occlusal table. As orthodontist, during fixed appliance therapy greater care should be taken to prevent the mandibular posterior teeth to upright beyond the optimum level. Care should be taken while selecting the pre adjusted edgewise brackets as they should have negative torque to prevent the unwanted uprighting of the posteriors. In case of Class II patients, the negative torque incorporated in mandibular posterior bracket should be increased to achieve the desired inclination of mandibular posteriors.
In our study, all three compensatory curves showed variant correlation between Group-I and II samples on subjecting to correlation coefficient analysis. The stomatognathic system adjusts to dentoskeletal variation by varying the shape of the curve of Spee, Insight into the morphological and functional significance of the curve of Spee might improve the stability of orthodontic treatment [16]. Improper occlusal curves fail to satisfy the masticatory function and occlusal stability. Shetty S et al., stated that the occlusion plane has direct role in form and function of the occlusal table and added that an adaptive change in the occlusion plane leads to dysfunction in the masticatory system [17].
In our study, we had used a modified method of measuring curve of Wilson and had found the correlation between the compensatory curves which might help in sagittal and transverse correction of Class II patient.
Limitation
The study was limited in finding the interrelationship between curves, so further studies can be done with increasing sample size and adding parameters which includes overbite, overjet and cephalometrics to improve accuracy between the curves.
Conclusion
The present study evaluating the curves shows strong correlation between curve of Spee and curve of Wilson and has weak correlation between curve of Monson and curve of Wilson and no correlation between curve of Monson and curve of Spee among the groups and it is statistically significant.
In clinical scenario, curve of Spee is measured easily, whereas measuring curve of Wilson is technique sensitive and requirement of CBCT is mandatory. Based on our study results, it is concluded that when curve of Spee is increased, the angulation of curve of Wilson conjointly increases. Therefore, while levelling curve of Spee, curve of Wilson should also be addressed which will improve the occlusion.
*Significant, ** Highly significant