Diabetes mellitus, a metabolic disease characterised by hyperglycaemia, is one of the leading causes of death in most developed countries and its incidence worldwide is rapidly increasing to epidemic proportions [1]. Hyperglycaemia is complicated as micro and macrovascular disorders which affects multiorgan damage [2]. World health organization (WHO) report stated that 1.5 million deaths were directly caused by diabetes and 2.2 million deaths were contributed to high blood glucose in 2012. The percentage of deaths associated with diabetes that occurs prior to 70 years of age is higher in low- and middle income countries than in high income countries [3].
Oxidative stress is thought to be a major risk factor for progression of diabetes. The common risk factors, such as increased age, obesity and unhealthy eating behaviour contribute to an oxidative environment that may alter insulin sensitivity either by increasing resistance to insulin or impairing glucose tolerance [4]. The progression of hyperglycaemia is associated with increased generation of free radicals and impaired antioxidant defence system leading to oxidative stress [5]. Under normal conditions, the body has equipped with potent endogenous antioxidant system such as Superoxide Dismutase (SOD), Catalase (CAT), reduced Glutathione (GSH), Glutathione Peroxidase (GPx) and Glutathione Reductase (GR) that protects it from the deleterious effects of over production of ROS [6]. The endogenous antioxidants (SOD, CAT, GPx and GR) are important components that can catalyse free radical quenching reactions [7]. When the ROS can react with cellular macromolecules and enhance the process of Lipid Peroxidation (LPO), it causes DNA damage, induces protein and nucleic acid modifications resulting in oxidative stress [8]. ROS mediated oxidative stress has been implicated in the pathogenesis of various disease such as inflammation, immunosuppresion, atherosclerosis and cardiovascular diseases [9].
Oxidative stress directly associated with numerous stress activated protein kinases can alter the expression of genes that may cause oxidative damage resulting in hyperglycaemia [10]. (MAPK) are an important stress activated serine theroine protein kinases which are involved in the several signal transduction pathway in cells. There are three major types of MAPKs, such as ERK, p38 MAPK and JNK [11]. These MAPKs can be activated in response to cellular stimuli such as oxidative stress, ROS or other environmental factors. The activation of MAPKs is directly attributed to the increased serine/threonine phosphorylation of key components that are involved in the insulin signaling pathway and oxidative stress. Several mechanisms have been proposed to inhibit high glucose mediated hyperglycaemia [12]. However, the inhibition of ROS stress mediated MAPKs is an important strategy to protect the progression of oxidative stress in hepatic cells [13].
Experimental studies have shown that antioxidants and natural phytochemicals effectively ameliorated high glucose-induced diabetes mellitus [14]. Citral (3,7-dimethyl-2,6-octadienal) is a key component of essential oils extracted from several lemon scented herbal plants (e.g., Lemon grass etc.,). Citral exhibits several pharmacological properties such as antibacterial, antifungal and insecticidal effects, as well as anti-inflammatory and anticancer activities [15]. Moreover, it posseses low toxicity and has been widely used as a food additive and fragrance material in cosmetics [15] Previously, it has been documented that the anti-inflammatory mechanism is associated with the activation of PPAR-γ, thereby inhibiting lipopolysaccharides (LPS) induced inflammatory response [16]. In addition, citral has been shown to be renoprotective due to its anti oxidant, anti apoptotic and anti-inflammatory effects [17]. The present study was thus conducted, to investigate the effect of citral on high glucose induced oxidative damage in HepG2 cells.
Materials and Methods
The experimental study was carried out at Department of Biochemistry and Biotechnology, Annamalai University, Tamil Nadu, India from October 2014 to September 2015.
Chemicals
Citral, DCFH-DA, ethidium bromide, primary monoclonal antibodies for p-ERK1, p-JNK, p-p38, β-actin and secondary antibodies were purchased from Sigma, St. Louis, MO, USA. 1-chloro-2,4-dinitrobenzene (CDNB), hydrogen peroxide (H2O2), 2,4-dinitrophenylhydrazine, 5, 50- dithiobis {2-nitro-benzoicacid} (DTNB), GR, Dulbecco’s Modified Eagle’s Medium (DMEM), Foetal Bovine Serum (FBS), trypsin-Ethylenediamine Tetra Acetic Acid (EDTA), Nicotinamide Adenine Dinucleotide Reduced (NADH), Nicotinamide Adenine Dinucleotide Phosphate Reduced (NADPH), Nitrobluetetrazolium (NBT), Phosphate Buffered Saline (PBS), reduced GSH, 2-thiobarbituric acid (TBA) and trichloroacetic acid (TCA) were purchased from Himedia, Mumbai, India. All other reagents and solvents of analytical grade were obtained from SD Fine chemicals, Mumbai and Fisher Inorganic and Aromatic Limited, Chennai.
Cell Culture and Treatments
The human liver cancer cell line (Hep G2) was obtained from National Centre for Cell Science (NCCS), Pune and grown in DMEM containing 10% FBS. The cells were maintained at 370C, 5% CO2 and 100% relative humidity. The cultures were passaged weekly, and the medium was changed twice a week. The cell monolayer was detached by using trypsin-EDTA to obtain single cell suspensions and viable cells were counted using a haemocytometer and diluted with medium to give final density of 1x10⁶ cells. Cells were treated with 50 mM glucose and incubated for 24 hours followed by addition of citral (30 μM) to grouped HepG2 cells. Cultured HepG2 cells were divided into three experimental groups: i. Control (Untreated); ii. Cells treated with D-glucose (50 mM); iii. Cells treated with citral (30 μM) + D-glucose (50 mM).
MTT {3-(4,5-dimethylthiazol-2-yl)-2, 5-diphenyltetrazolium bromide} Assay
MTT is a standard colorimetric assay that was conducted to detect the high glucose induced cytotoxicity of cells in vitro [18]. Briefly, 5000−6000 cells/well were seeded in 96-well plates and incubated at 37°C, 5% CO2 for 24 hours. Cells were preincubated with or without glucose (50 mM) for 24 hours and then different concentrations of citral were added into selected wells. After 48 hours incubation at 37°C, 20 μl of MTT solution (4 mg/ml) was added to each well. The plates were further incubated for four hours at 37°C. Consequently, without disturbing the cells the MTT medium was removed from each well, and 100 μl of dimethyl sulfoxide (DMSO) was added into each well to dissolve the formazan crystals. The absorbance was determined at 570 nm by spectrophotometer. The assays were performed three times independently and each independent experiment was done in triplicate. The values were expressed as % of cell viability.
Determination of ROS Production
The intracellular ROS was measured by method of Zhang J et al., 2008 [19]. HepG2 cells (1x10⁶) were seeded in 6-well plates and incubated at 37°C, 5% CO2 for 24 hours. Cells were preincubated with or without glucose (50 mM) for 24 hours and then citral (30 µM) was added into selected wells. After 48 hours of incubation at 37 °C, 10 µM of fluorescent probe 2,7-dichlorofluorescin diacetate (DCF-DA) was added and incubated for 30 minutes. Then, the cells were washed once with PBS and the fluorescence intensity was recorded using a spectrofluorometer at an excitation wavelength of 485 nm and an emission wavelength of 535 nm and the images were captured using inverted fluroscent microscope (Nikon, Japan).
Sample Preparation
The confluent cells were washed with PBS and detached with 0.25% trypsin EDTA for five mintues. Then, the cell suspension was centrifuged for 10 minutes and cell pellets were lysed in 50 mM phosphate buffer pH 7.0, followed by sonication for two minutes on ice. The mixture was then centrifuged for 10 minutes at 1,000 x g and the supernatant was assayed for enzyme activities.
Lipid Peroxidation Assay
Lipid peroxidation activity was estimated by the method of Min SW and Han JS 2012 [20]. To 1.0 ml of the sample, 2.0 ml of trichloroacetic acid (TCA)-thiobarbituric acid (TBA) -HCl reagent was added and mixed thoroughly. The solution was heated for 15 minutes in a boiling water bath. After cooling, the flocculent precipitate was removed by centrifugation at 1,000 x g for 10 minutes. The Optical Density (OD) was recorded using by spectrometer at 535 nm. The results were expressed as nmoles of Malondialdehyde (MDA) formed/min/mg protein.
Superoxide Dismutase Activity
Superoxide dismutase activity was estimated by the method of Gurudath S et al., 2012 [21]. A 1.4 ml aliquot of the sample was pipetted into a test tube and 100 µl of sample was added, followed by a preincubation at 37°C for five minutes. Eighty microlitres of riboflavin was added and the tubes were exposed for 10 mintues to 200 W Philips fluorescent lamps. The control tube contained equal amount of buffer instead of sample. The sample and its respective control were run together. At the end of the exposure time, 1.0 ml of Griess reagent was added to each tube and the absorbance of the color formed was measured at 543 nm. One unit of enzyme activity was defined as the amount of SOD capable of inhibiting 50% of nitrite formation under assay condition.
Catalase Activity
The method of catalase activity was folowed by Gueroui M and Kechrid Z 2016 [22]. A 0.l ml of sample were mixed with 0.9 ml of phosphate buffer and then 0.4 ml H2O2 was added. The reaction was terminated by adding 2 ml dichromate-acetic acid mixture. The tubes were kept in a boiling water bath for 10 minutes and allowed to cool. The OD was recorded using spectrometer at 590 nm. The catalase activity was expressed as μmoles of H2O2 utilized/min/mg protein.
Glutathione Reductase Assay
Glutathione reductase activity was estimated by the method of Mateen S et al., 2016 [23]. To 0.2 ml of sample, 1.5 ml of buffer, 0.5 ml EDTA, 0.2 ml oxidized glutathione (GSSG) and 0.1 ml NADPH were added. The decrease in optical density of the enzyme was measured at 340 nm. The enzyme activity was calculated in terms of moles of NADPH oxidized/min/mg protein.
Glutathione Peroxidase Activity
The activity of GPx was estimated and followed by the method of Noeman SA et al., 2011 [24]. The assay mixture was made up with 0.2 ml of 0.1M sodium phosphate buffer, 0.2 ml of 1 mM EDTA, 0.1 ml of 1 mM sodium azide (NaN3) and 0.5 ml of sample. Then, 0.2 ml of glutathione followed by 0.1 ml of H2O2 was added to the assay mixture. The contents were well mixed and kept for incubation at 37°C for 10 minutes. After 10 minutes the reaction was terminated by adding 0.5 ml of 10% TCA, centrifuged and the supernatant was assayed for activity of GPx. To 2.0 ml of the supernatant, 3.0 ml disodium hydrogen phosphate (Na2HPO4) solution and 1.0 ml DTNB reagent were added. The colour developed was read at 412 nm. Standards in the range of 200-1000 µg were taken and treated in a similar manner. The activity was expressed in term of µg of glutathione consumed/min/mg protein.
Comet Assay
High glucose induced DNA damage was assessed by alkaline single cell gel electrophoresis (comet assay) according to the method of Singh NP et al., 1988 [25]. After treatment with high glucose (50Mm), cells (50 μl) were mixed with 100 μl 0.5% Low Melting Point Agarose (LMPA) and the suspension was precoated with 1% of Normal Melting Point Agarose (NMPA) on comet slides. Slides were immersed in cold lysis buffer (2.5 M NaCl, 100 mM Na2 EDTA, 10 mM Tris pH 10, 1% Triton X-100, 10% DMSO, pH 10) and kept at 4°C for 60 minutes. To allow DNA denaturation, the slides were placed in alkaline electrophoresis buffer (300 mM NaOH, 1 mM Na2 EDTA, pH 13) for 20 minutes. Then, alkaline electrophoresis was performed at field strength of 25 V for 25 minutes. Slides were neutralized in 0.4 M Tris pH 7.5 for five minutes and stained with 20 μg/ml ethidium bromide for visualization of DNA damage; observations were made using an epifluorescent microscope (Nikon, Eclipse TS100, Japan). Images were captured with a digital camera (Nikon 4500 Coolpix, Japan) and images were analysed by Comet Assay Software Project (CASP) software.
Western Blot Analysis
Protein was isolated to determine the expression of p-ERK1, p-JNK and p-p38 using Radioimmunoprecipition Assay (RIPA) buffer containing a protease inhibitor cocktail (Sigma-Aldrich, St Louis, MO, USA). Protein concentration was estimated using the NanoDrop (Thermo Scientific, Austria). 50 μg of proteins from each sample was added on 10% SDS-PAGE gel and transferred to a polyvinylidene fluoride (PVDF) membrane using semidry apparatus (Bio-Rad). Membranes were blocked with 10% nonfat milk (blocking solution) overnight at 4°C and then incubated with respective primary antibody diluted 1:1000 in blocking solution, for 5-6 hours at 37°C. The membranes were washed with tris buffered saline tween 20 (TBST) thrice for 10 minutes interval and then incubated with Horseradish Peroxidase (HRP) conjugated secondary antibody diluted 1:2000 in blocking solution and incubated for two hours at 37°C. Then the membranes were washed with TBST thrice for 10 minute interval and the bands were detected using a chemiluminescence method. The images were acquired by Image J software.
Statistical Analysis
Values were expressed as mean±Standard Deviation (SD). Statistical difference in mean was analysed using One way Analysis Variance (ANOVA) and the group means were analysed by Duncan’s Multiple Range Test (DMRT). p< 0.05 was considered statistically significant.
Results
Effect of Citral on High Glucose Induced Cell Cytotoxicity in HepG2
To assess the nontoxic concentrations of citral for cytoprotective studies, we carried out MTT based cytotoxicity assay in HepG2 cells. Citral did not cause cytotoxicity up to 30 μM concentration in HepG2 cells [Table/Fig-1a,b].
Effect of citral on high glucose induced cytotoxicity in HepG2 cells. HepG2 (1X10⁶) cells were incubated at 37°C with citral (0–60 μM) for 24 hours, followed by exposure to 50 mM glucose for 24 hours. (a) Cytotoxic effect of citral on HepG2 cells without exposure of high glucose. (b) Cytotoxic effect citral on HepG2 cells with exposure to high glucose. Data are given as means ± SD of six experiments in each group. Values not sharing a common marking (a, b, c,..) differ significantly at p<0.05 (DMRT).
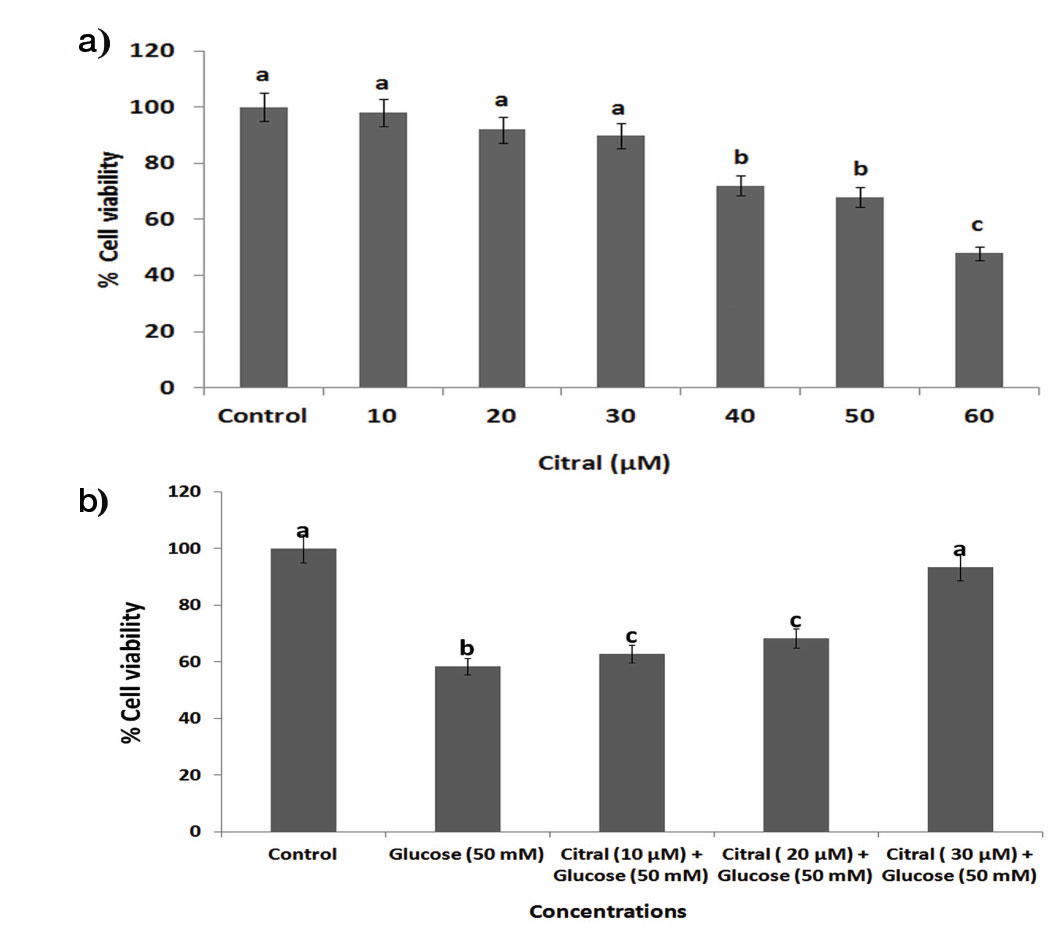
Further, high glucose (50 mM) produced a significant reduction in cell viability compared with control cells. Treatment with citral (30 μM) led to enhanced cell viability in high glucose induced HepG2 cells [Table/Fig-1b]. In addition, 10 and 20 μM concentration of citral did not appreciably decrease the cell viability compared to 30 μM of citral. Hence, citral (30 μM) was chosen as optimum dose for further experiments.
Determination of ROS Production in Citral Treated HepG2 Cells
The estimation of ROS yields is a very good indication of the oxidative damage to cells. DCFH-DA staining was performed to observe whether citral was capable of inhibiting ROS generation in high glucose treated HepG2 cells. An increase in ROS production was observed in the presence of 50 mM high glucose as compared to unstressed controls [Table/Fig-2a,b].
Effect of citral on high glucose induced ROS generation in HepG2 cells by DCFH-DA staining. (a) Photomicrographs showed (40X) enhanced green fluorescence in high glucose induced HepG2 cells, citral treatment decreased high glucose induced ROS generation. (b) Bar diagram represents the fluroscence intensity for accumulation DCFH-DA. Values are given as means ± SD of six experiments in each group. Values not sharing a common marking (a, b, c,..) differ significantly at p<0.05 (DMRT).
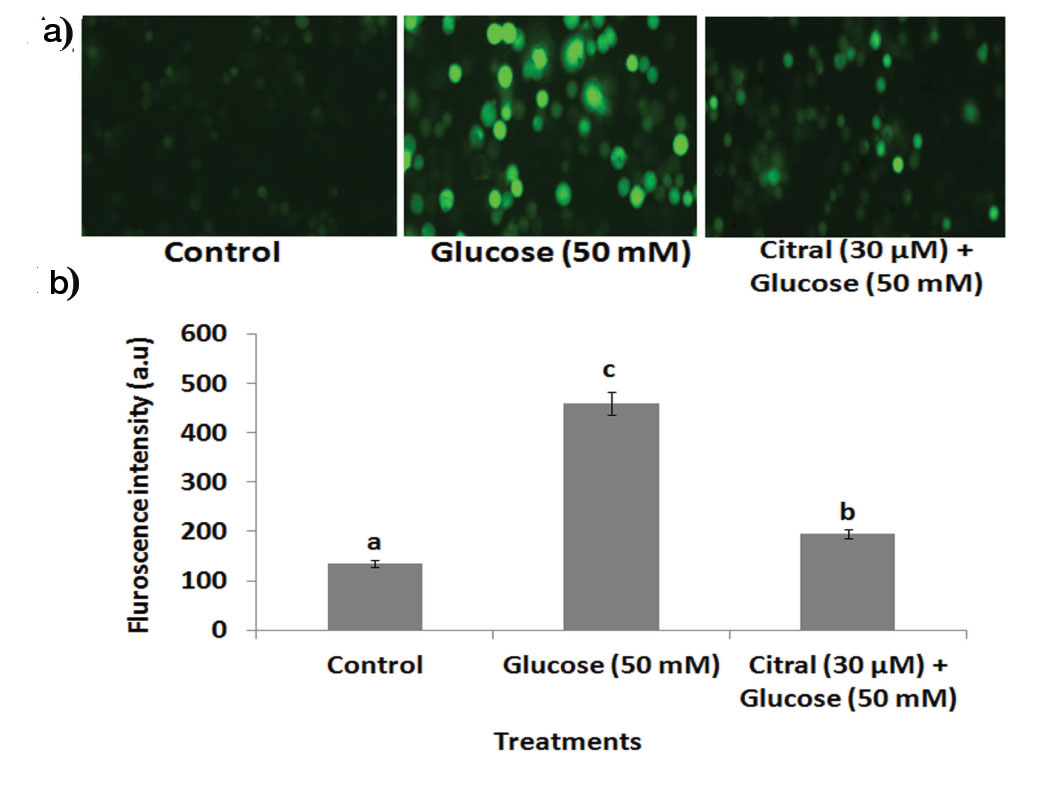
However, citral (30 μM) treatment significantly diminished fluorescence intensity in high glucose induced HepG2 cells when compared to high glucose alone-treated cells.
Effect of Citral on High Glucose Induced Lipid Peroxidation Levels in HepG2 Cells
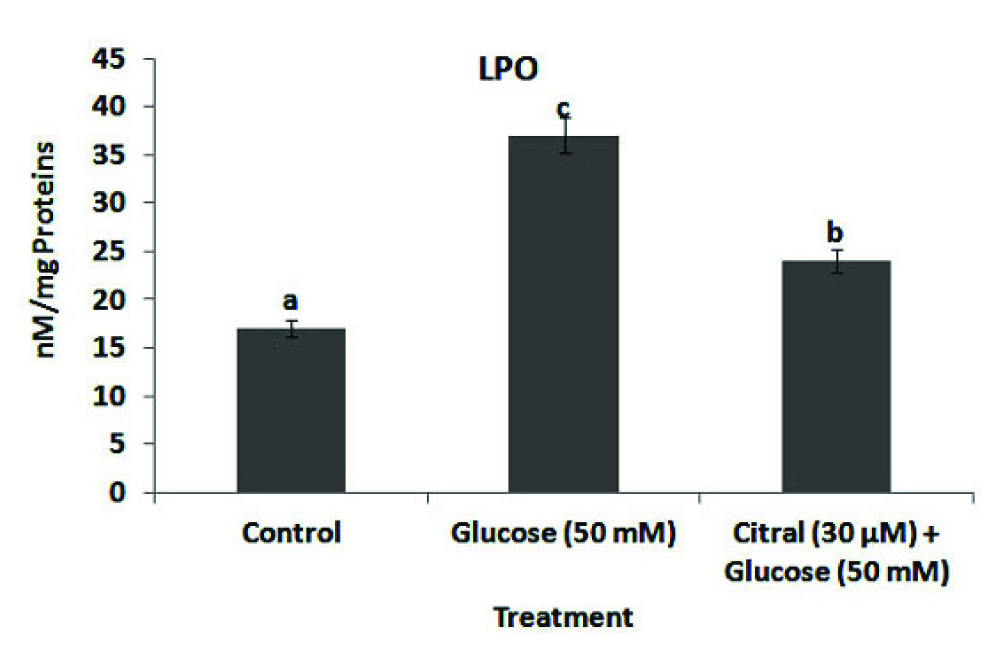
Inhibition of hepatic lipid peroxidation was determined by measuring the LPO concentration in citral treated in 50 mM high glucose induced HepG2 cells. A treatment of HepG2 cells with high glucose alone evoked an increase in the cellular concentration of LPO, indicating oxidative damage to cell lipids. HepG2 cells exhibited significantly reduced lipid peroxidation activity when treated with citral (30 μM) compared with high glucose alone [Table/Fig-3].
Effect of citral on high glucose induced lipid peroxidation in HepG2 cells. Lipid Peroxidation (LPO) values were expressed as nmol per mg protein. Values are given as means ± SD of six experiments in each group. Values not sharing a common marking (a, b, c,..) differ significantly at p<0.05 (DMRT).
Effect of Citral on High Glucose Induced Antioxidant Status in HepG2 Cells
High glucose induced depletion of antioxidants is considered to cause oxidative damage on the liver resulting in hyperglycaemia. In this study, antioxidants such as SOD, CAT, GPx and GR were suppressed in high glucose induced HepG2 cells [Table/Fig-4(a-d)].
Effect of citral on high glucose induced depletion of antioxidants status in HepG2 cells. Values are given as means±SD of six experiments in each group. Values not sharing a common marking (a, b, c,..) differ significantly at p<0.05 (DMRT). (a) SOD (Enzyme concentration required for 50% inhibition of nitroblue tetrazolium reduction in one minute); (b) CAT mmol of hydrogen peroxide consumed per minute; (c) GPx mg of glutathione consumed per minute; and (d) GR (values were expressed as μmol per mg protein).
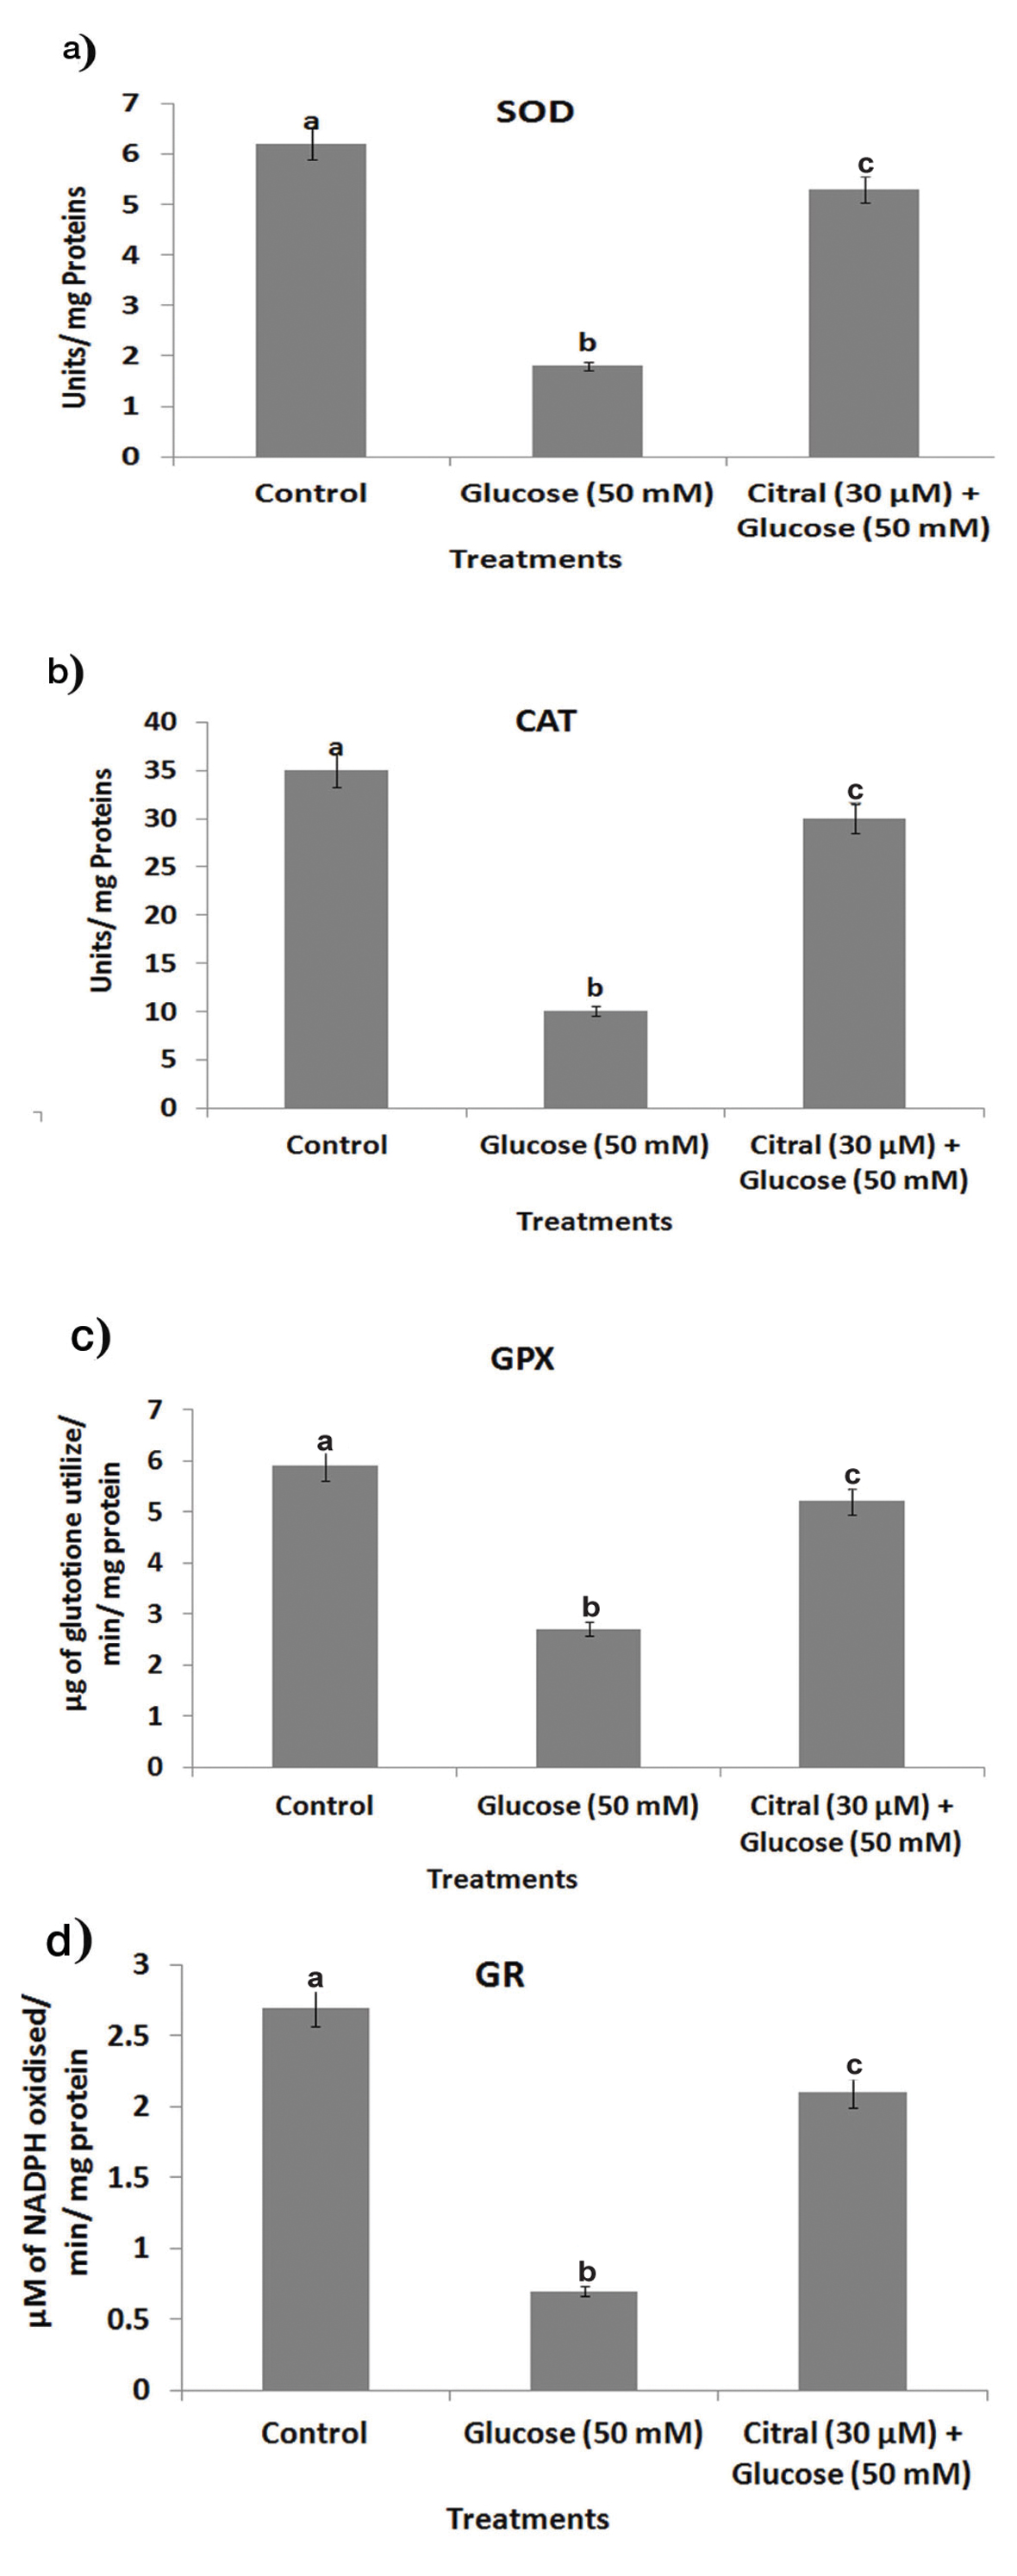
Conversely, citral (30 μM) inhibited the depletion of SOD, CAT, GPx, and GR in the high glucose induced HepG2 cells when compared to the high glucose alone treated cells.
Effect of Citral on High Glucose Induced DNA Damage in HepG2 Cells
The control HepG2 cells showed non-fragmented intact nucleoids [Table/Fig-5].
Effect of citral on high glucose induced DNA damage in HepG2 cells. (a) Fluorescence photomicrographs showed enhanced tail DNA and tail movement in high glucose induced HepG2 cells, citral treatment decreased high glucose induced comet formation. (b) Bar diagram represents % of DNA damage were assessed by CASP online software. Values are given as means±SD of six experiments in each group. Values not sharing a common marking (a, b, c,..) differ significantly at p<0.05 (DMRT).
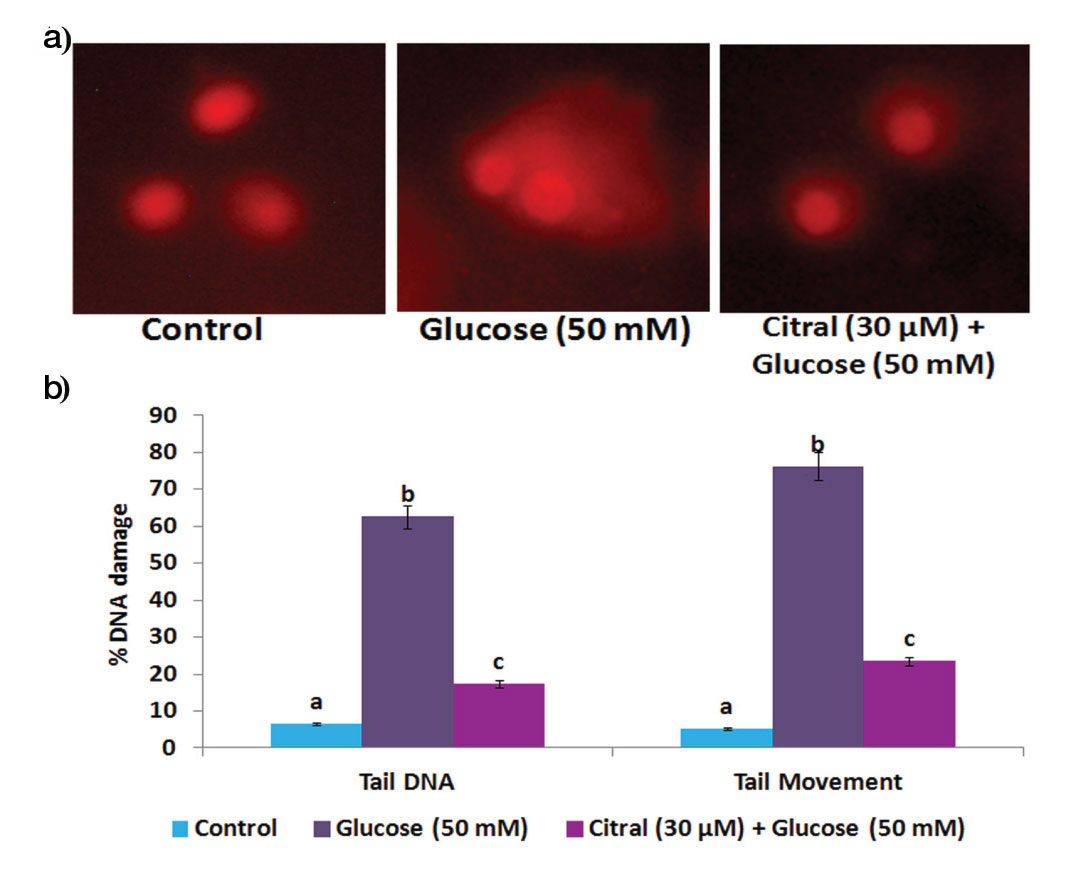
We observed an increased % tail DNA and tail movement in high glucose treated cells. Conversely, 30 μM concentration of citral treatment significantly inhibited the % tail DNA and tail movement formation in high glucose induced HepG2 cells.
Effect of Citral on High Glucose Induced p-ERK1, p-JNK and p-p38 Expressions in HepG2 Cells
Western blot results indicated that exposure to high glucose increased the levels of p-ERK1, p-JNK and p-p38 in HepG2 cells when compared to control [Table/Fig-6].
Effect of citral on high glucose induced p-ERK1, p-JNK and p-p38 expressions in HepG2 cells.
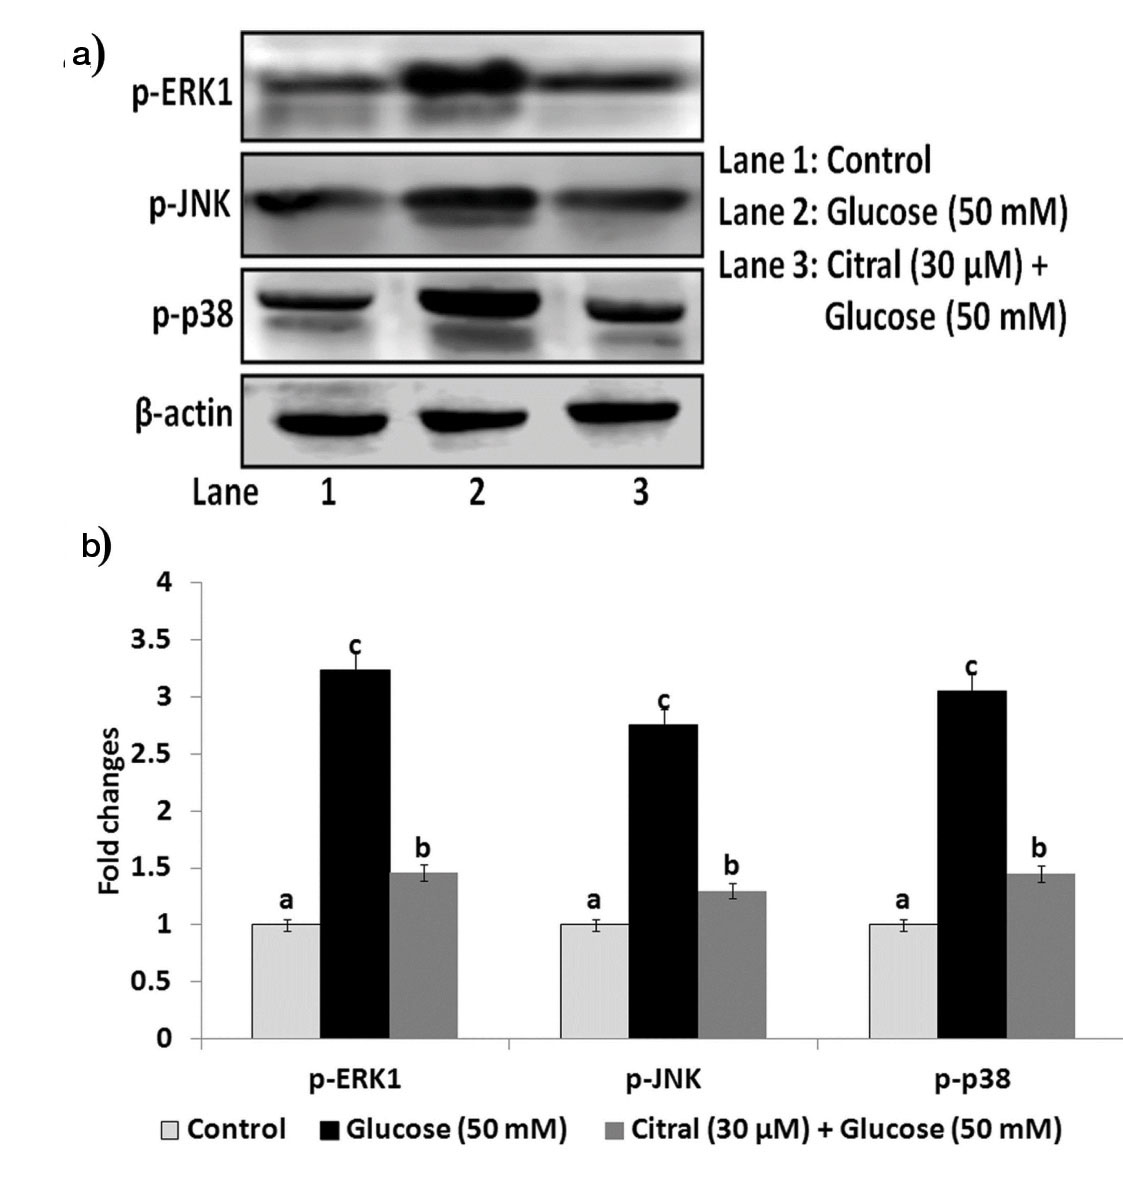
Treatment with 30 μM concentration of citral significantly decreased the levels of p-ERK1, p-JNK and p-p38 in high glucose induced HepG2 cells.
Discussion
Diabetes mellitus, is a serious metabolic disorder, characterised by hyperglycaemia that leads to ROS generation, DNA damage and subsequent oxitative stress [26]. We evaluated the activity of citral on high glucose induced cell viability by MTT based cytotoxicity assay. MTT assay is a standard colorimetric assay that depends on the conversion of yellow coloured MTT reagent to purple coloured crystal formazan by the activity of mitochondrial dehydrogensases which indicates live cells [27]. In this study, a higher concentration of glucose (50 mM) induced cell toxicity in HepG2 cells. Numerous studies have postulated that high concentration of glucose might cause damage to the cell membrane thereby lowering cell viability and stimulation of oxidative stress in the heptic cells [12,28]. Citral, a phytoconsituent of lemon scented herbal plant effectively protected against high glucose induced cell death at a concentration of 30 µM[Table/Fig-1b]. Previously, citral had been reported to be a significant cytotoxic agent in a dose and time dependent manner with a IC50 of 3.995 µg/ml at 24 hours in NB4 cells [13].
Oxidative stress is directly associated with the over generation of ROS that leads to hyperglycaemic progression in diabetes. High glucose induced hyperglycaemia contributes to the oxidative stress environment through increased production of ROS. In addition, large quantities of ROS in a biological system can leads to cellular damage of lipids, membranes, proteins, and DNA [29]. In cellular redox state ROS are formed by reduction of molecular oxygen or by oxidation of water to yield products such as super oxide anion (O2·-), hydroxal radical (OH·) and hydrogen peroxide (H2O2) [30]. In this study, we found that citral inhibits high glucose induced ROS production in the HepG2 cells [Table/Fig-2]. It has been previously reported that curcumin, an active phytochemical effectively attenuated high glucose induced oxdative damage through inhibiting ROS generation in cultured mouse podocytes [31].
Oxidative stress is a major contributor of hyperglycaemia induced diabetic complications associated with the liver [32]. Antioxidant enzymes act as a safeguard in our body by quenching ROS [32]. The present study showed decreased antioxidant enzyme activity and increased lipid peroxidation under high glucose stress. Conversly, citral treatment restored the activities of antioxidant enzymes (SOD, CAT, GPx and GR) in high glucose induced HepG2 cells. Recently, morin, a bioflavonoid has been found to enhance the level of antioxidant enzymes thereby protecting against high glucose induced heptocytes [33]. In addition, naringenin treatment has been found to reduce hyperglycaemia by decreased membrane lipid peroxidation and enhanced activities of antioxidants in experimental model [34]. Oxidative stress mediated DNA damage may induce genetic changes causing cell death and apoptosis in hepatic cells [35]. High glucose induced oxidative stress in HepG2 cells showed increased frequency of DNA damage. However, DNA damage and DNA repair mechanisms are initiated to counteract hyperglycemia-induced oxidative DNA damage [36]. Our results clearly show that citral protects against high glucose induced oxidative DNA damage in HepG2 cells. Previously, morin had been shown to protect against high glucose induced DNA damage in primary rat hepatocytes by inhibiting oxidative stress mediated DNA fragmentation [33].
ROS mediated oxidative stress is a strong inducer of the mitogen-activated protein kinase (MAPK) activation. The MAPK family includes ERK1, JNK and p38 which all are responsible for the underlying mechanism for high glucose induced apoptosis, inflammation and oxidative stress in the hepatic cells. However, elimination of high glucose induced ROS production may have the potential to attenuate MAPK signaling disturbances [37]. Therefore, we assessed whether citral could protect against high glucose induced MAPKs signaling in HepG2 cells. Results showed that over expression of phosphorylated ERK1, JNK and p38 were observed in high glucose induced HepG2 cells. There are several experimental evidences that have suggested that treatment of high glucose stimulates phosphorylation of MAPKs signaling is implicated in oxidative stress and other signaling cascades [38]. Our results also show that citral inhibits phosphorylation of ERK1, JNK and p38 in high glucose exposed HepG2 cells. Similarly, Tartary buckwheat flavonoids have been shown to protect hepatic cells against high glucose-induced oxidative stress by inhibiting MAPK signaling pathways [28]. Moreover, naringin has been found to protect against high glucose induced oxidative injuries by inhibiting the activation of MAPK (p38 MAPK, ERK1/2 and JNK) in H9c2 cells [39]. Hence, more experimental studies in this area are required to be able to consider natural components that provides protection against the damages caused due to high glucose induced oxidative stress.
Limitation
These findings just provide an important basis for citral on high glucose induced oxidative stress in Hep G2 cell lines. Further studies are required that need to address the effect of citral against diabetic complications and to identify other mechanisms for hyperglycaemia which has not been assessed in the present study.
Conclusion
Citral protects against high glucose induced oxidative stress by inhibiting ROS activated MAPK signaling pathway in HepG2 cells. Moreover, citral enhanced endogenous antioxidants and decreased lipid peroxidation in high glucose induced HepG2 cells.