Depression is a mental health disorder wherein low mood and low energy can affect a person’s thoughts, feelings, behaviour and sense of well-being [1]. It is characterized by disturbed sleeping pattern, change in appetite, fatigue, irritability, reduced ability to concentrate, difficulty in decision making and even suicidal thoughts. Depression is a common psychological state affecting over 350 million people from all age groups [2]. Unipolar depressive disorder is expected to be the most significant cause of disease burden by the year 2030 [3]. Marked as one of the most common unidentified mental health problems in Pakistan, masked by long-term illnesses and psychological disturbances, depression plays a key role in worsening the prognosis of chronic diseases. The risk of developing depression in the general population is 10%-25% in females and 5%-12% in males; whereas, in patients with chronic conditions the risk increases up to 25%-33% [4]. Chronic conditions such as diabetes mellitus, asthma, hypertension and anaemia are the most common comorbidities in a hospital setting.
Diabetes is a group of metabolic syndromes with uncontrolled high levels of blood glucose. Type I diabetes, also known as Insulin-Dependent Diabetes Mellitus (IDDM), is a genetic disorder resulting in inability of pancreatic beta cells to produce insulin. Type II diabetes, also known as Non-Insulin-Dependent Diabetes Mellitus (NIDDM), is caused by ‘insulin resistance’ i.e., target cells stop responding to insulin. It is strongly associated with a sedentary life style and obesity. Depression is an important comorbid of both Type I and Type II diabetes, possibly because diabetes requires significant lifestyle changes to cope with the disease. Changes with regard to controlling blood sugar through dietary restrictions lead the way for depressive symptoms as early as the person is diagnosed with the disease. It has been demonstrated that the prevalence of depression is higher in diabetics than in non-diabetics [5-7] and approximately 43 million patients with diabetes suffer with depressive symptoms [8].
Asthma, another common chronic condition affected by both genetic and environmental factors, is an inflammatory disease of the upper respiratory tract. It is characterized by reversible episodes of airway obstruction, bronchospasm, shortness of breath, wheezing and coughing. Symptoms of severe asthma, such as dyspnoea (shortness of breath) leading to wakening of a patient from sleep, has a strong correlation with depression [9].
One of the most commonly prevailing long term illnesses includes hypertension. It is defined as arterial blood pressure of more than 140/90 mmHg. It is a chronic disease that requires drastic lifestyle and dietary modifications in order to maintain a normal blood pressure. A study highlighted a three times higher frequency of depressive symptoms in hypertensive patients [10], hence there is a need for reassurance and psychological feedback in hypertensive patients.
Anaemia, as defined by the World Health Organization (WHO), is the blood plasma Haemoglobin (Hb) concentration of less than 12 g/dl in women and 13 g/dl in men [11]. There are several theories in medical literature linking anaemia and depression. Anaemia is strongly associated with decreased muscle strength and fatigue (due to reduced oxygenation), adversely affecting a patient’s quality of life which can facilitate the development of depressive symptoms in an anemic individual [12,13].
The purpose of this study is to highlight the prevalence of depression among individuals diagnosed with four of the most common chronic diseases i.e., diabetes, asthma, hypertension and anaemia. It also seeks to compare the severity of depressive symptoms amongst each of the chronic diseases.
Materials and Methods
This cross-sectional study was conducted at a Civil Hospital of Karachi, Pakistan. The study protocol was approved by local Ethical Committee and prior to obtaining consent, all participants were explained about the purpose of the study and the relevant procedures involved. The study duration was one year from August 2015 to August 2016. A total of 515 patients who had been admitted to the medical wards around the year were evaluated. The participant’s cooperation rate was 95% which yielded a final sample size of 489. Participants were selected via convenience sampling.
Patients with psychiatric disorders, any type of cognitive impairment such as dementia and mental retardation, patients on anti-depressants, females in post-partum period and patients who had undergone any traumatic event within the last six months were excluded from the study. Patients above 18 years of age; confirmed diagnosis of at least any one of the following chronic illnesses: diabetes, asthma, hypertension and anaemia; and patients who could speak and understand Urdu (the questionnaire was translated into Urdu for easier and unambiguous communication with the local population) were included in the study.
Previously diagnosed patients with diabetes and asthma were put into respective categories; patients who had a history of consuming anti-hypertensive medications were classified as hypertensives; patients with consistently low levels of Hb in their previous medical records were classified as anaemics. A pilot study was conducted on 40 patients (who were not included in the total sample) to test and rectify any shortcomings in the study questionnaire. Interviewer’s bias was reduced by selecting individuals with the same academic background, training them and keeping them unaware of the study’s results.
The final questionnaire was divided into three sections ‘medical history and demographic details’, ‘laboratory values’ and ‘Beck Depression Inventory (BDI) scale’. The Beck Depression Inventory Second Edition (BDI-II), a 21-item self-report instrument was used to assess the severity of depression via scores assigned to each question. Total score of 0-13 is ‘minimal’, 14-19 is ‘mild’, 20-28 is ‘moderate’ and 29-63 is ‘severe’ [14].
Statistical Analysis
The data was entered manually into the SPSS Statistics, version 17.0 (IBM SPSS Inc., Chicago, IL). No imputation method was used to replace missing values and only completely filled questionnaires were included in the study. The normality was assessed using Shapiro-Wilk test. All the categorical variables were expressed as frequencies (percentages) and compared by the Pearson’s Chi-square test. Age, a continuous variable was expressed as mean±standard deviation and intergroup comparisons were performed using one way ANOVA test. Random Blood Sugar (RBS), Hb, duration of diabetes, hypertension and asthma were divided into two categories each, according to their median values.
The four classes of depression according to BDI scale (mild, minimal, moderate, severe) were divided into two categories A and B i.e., less severe and more severe depression respectively. Category A included mild and minimal levels of depression whereas Category B included moderate and severe levels of depression.
Logistic regression models were applied in order to determine the association of Category B depression (dependent variable) with each chronic disease (independent variable). Unadjusted and adjusted models 1 and 2, Odds Ratio (OR) and 95% Confidence Interval (CI) were calculated. In Model 1, age, marital status, RBS level and Hb level were adjusted. In Model 2, the rest of the chronic diseases along with the variables mentioned in Model 1 were adjusted. In total samples, both models were further adjusted for gender.
Similarly, logistic regression was applied to determine the association of socio-demographic factors like age, gender, marital status and laboratory indices like RBS and Hb (independent variable) with severity of depression among individuals having atleast one chronic illness (dependent variable). A two-tailed p-value<0.05 was considered statistically significant.
Results
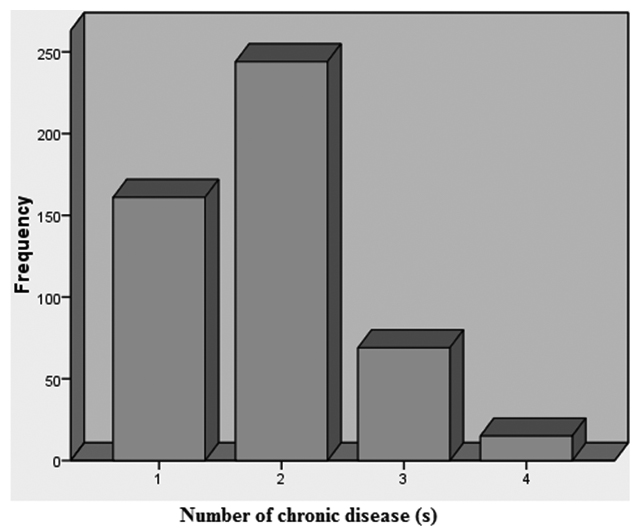
Mean±Standard Deviation (SD) age of the study sample was 42.18 (±15.74). Majority of the individuals were females (n=289, 59.1%), belonged to 40-60 age group (n=249, 50.9%) and were married (n=390, 79.8%). The mean±SD BDI score of the total sample was 17.78±8.91 (range 0-63). Most of the participants (n=185, 37.8%) were categorised under the minimal classification of BDI scale. Severely depressed individuals were almost one-third of the minimal depressed group of which mostly were females (n=55, 89%) and many were from youngest group (n=20, 32%). Amongst the participants with RBS >138 mg/dl, most of them were minimally depressed (n=132, 55.2%), while amongst those participants with RBS<138, most of them were mildly depressed (n=84, 33.6%). A similar pattern was observed in participants with Hb>10 and Hb<10, respectively [Table/Fig-1]. Of the total, 32.9% (n=161) patients had one, 49.9% (n=244) patients had two, 14.1% (n=69) patients had three and only 3.1% (n=15) had all the four chronic diseases [Table/Fig-2].
Frequency distribution of participants by socio-demographic features and selected variables.
| Characteristic | *Depression Scale | ±p-value |
|---|
| Minimal (0-13) n=185 | Mild (14-19) n=149 | Moderate (20-28) n=93 | Severe (29-63) n=62 |
|---|
| Age (years), mean±SD | 43.22±13.3 | 45.56±18.14 | 39.44±12.22 | 35.03±18.19 | ±±0.001 |
| Age by group, n (%): | | | | | **<0.001 |
| <20 | 14 (8) | 2 (1) | 0 (0) | 20 (32) |
| 20-40 | 37 (20) | 59 (40) | 49 (53) | 14 (23) |
| 40-60 | 126 (68) | 64 (43) | 40 (43) | 19 (31) |
| >60 | 8 (4) | 24 (16) | 4 (4) | 9 (15) |
| Gender, n (%): | | | | | **<0.001 |
| Female | 91 (49) | 83 (56) | 60 (65) | 55 (89) |
| Male | 94 (51) | 66 (44) | 33 (35) | 7 (11) |
| Marital Status, n (%): | | | | | **<0.001 |
| Single | 25 (14) | 9 (6) | 11 (12) | 27 (44) |
| Married | 153 (83) | 138 (93) | 77 (83) | 22 (35) |
| Other | 7 (4) | 2 (1) | 5 (5) | 13 (21) |
| RBS (mg/dl): | | | | | **<0.001 |
| <138 | 53 (29) | 84 (56) | 67 (72) | 46 (74) |
| >138 | 132 (71) | 65 (44) | 26 (28) | 16 (26) |
| Hb (g/dl): | | | | | **<0.001 |
| <10 | 100 (54) | 103 (69) | 54 (58) | 17 (27) |
| >10 | 85 (46) | 46 (31) | 39 (42) | 45 (73) |
Data presented as frequency (percentages) and means±SD
Beck Depression Inventory (BDI) scale was used
±p value<0.05 was considered statistically significant
Pearson’s Chi-square (χ2) test was used to compare categorical variables
±±One-way ANOVA was used to compare continuous variable that was normally distributed
Hb: Haemoglobin; RBS: Random Blood Sugar; SD: Standard Deviation.
Bar chart showing frequency of patients having one or more chronic diseases.
The prevalence of anaemia, hypertension, diabetes and asthma was 90%, 47%, 26% and 23% respectively. Anaemia was the most prevalent chronic illness with females predominantly affected (n=274, 62.3%). Amongst anaemics, most of them had minimal depression (n=156, 35.5%) while most of the severely depressed ones were females (n=53, 85%). Nearly half of the hypertensives (n=109, 47.6%) were minimally depressed in contrast to only a small portion of them (n=25, 10.9%) afflicted with severe depression. Among diabetics, there were an equal number suffering from minimal and mild depression (n=48, 38.1%) and an equal number suffering from moderate and severe depression (n=15, 11.9%). Asthma was the least prevalent disease in our sample. Asthmatics had mostly minimal (n=44, 39.3%) and moderate levels of depression (n=32, 28.6%). Most of the patients who had one chronic disease were mildly depressed (n=53, 32.9%) while a majority of the patients who had two (n=106, 43.4%) or three (n=33, 47.8%) chronic diseases were categorized under the minimal classification of BDI scale. Those patients who had all four chronic diseases were mostly severely depressed (n=7, 46.7%) [Table/Fig-3].
Frequency and duration of chronic disease according to BDI scale.
| Characteristic | *Ddepression Scale | ±p-value |
|---|
| Minimal (0-13) n=185 | Mild (14-19) n=149 | Moderate (20-28) n=93 | Severe (29-63) n=62 |
|---|
| Diabetes, n (%): | | | | | 0.049 |
| Yes | 48 (26) | 48 (32) | 15 (16) | 15 (24) |
| No | 137 (74) | 101 (68) | 78 (84) | 47 (76) |
| Duration of diabetes (years): | | | | | 0.065 |
| <7 | 24 (13) | 31 (21) | 8 (9) | 6 (10) |
| >7 | 24 (13) | 17 (11) | 7 (8) | 9 (15) |
| Asthma, n (%): | | | | | 0.568 |
| Yes | 44 (24) | 32 (21) | 25 (27) | 11 (18) |
| No | 141 (8) | 117 (79) | 68 (73) | 51 (82) |
| Duration of asthma (years): | | | | | 0.158 |
| <25 | 24 (13) | 13 (9) | 16 (17) | 2 (3) |
| HTN, n (%): | | | | | <0.001 |
| Yes | 109 (59) | 55 (37) | 40 (43) | 25 (40) |
| No | 76 (41) | 94 (63) | 53 (57) | 37 (60) |
| Duration of HTN (years): | | | | | <0.001 |
| <5 | 47 (25) | 38 (21) | 24 (26) | 7 (11) |
| >5 | 62 (34) | 17 (11) | 16 (17) | 18 (29) |
| Anaemia (Male), n (%): | | | | | <0.001 |
| Yes | 65 (35) | 64 (43) | 30 (32) | 7 (11) |
| No | 29 (16) | 2 (1) | 3 (3) | 0 (0) |
| Anaemia (Female), n (%): | | | | | <0.001 |
| Yes | 91 (49) | 70 (47) | 60 (65) | 53 (85) |
| No | 0 (0) | 13 (9) | 0 (0) | 2 (3) |
| Number of chronic disease, n (%): | | | | | <0.001 |
| 1 | 46 (24.9) | 53 (35.6) | 28 (30.1) | 34 (54.8) |
| 2 | 106 (57.3) | 72 (48.3) | 52 (55.9) | 14 (22.6) |
| 3 | 33 (17.8) | 18 (12.1) | 11 (11.8) | 7 (11.3) |
| 4 | 0 (0) | 6 (4) | 2 (2.2) | 7 (11.3) |
Data presented as frequency (percentages)
Beck Depression Inventory (BDI) scale was used;
±p-value<0.05 was considered statistically significant
Pearson’s Chi-square (χ2) test was used to compare categorical variables; HTN: Hypertension
[Table/Fig-4] shows unadjusted and adjusted OR and 95% CI for Category B depression in the four major chronic diseases (i.e., presence vs. absence of each disease) in each gender for the total sample (more detail on adjusted model 1 and 2 is given in statistical analysis). Predictors of Category B depression in the fully adjusted Model 2 were anaemia (OR=4.21) and diabetes (OR=2.03). It should be noted that asthma predicted Category B depression in males (OR=1.26) but not in females (OR=0.77). Moreover, anaemic females were 9.3 times more likely to report Category B depression than non-anaemic females. Similarly, anaemic males were 2.4 times more likely to report Category B depression than non-anaemic males.
Category B depression in individuals with vs. without chronic disease.
| Chronic disease | Male *OR(95% CI±) | Female *OR(95% CI±) | Total *OR(95% CI±) |
|---|
| Diabetes | | | |
| Unadjusted | 0.796 (0.376-1.685) | 0.622 (0.336-1.149) | 0.595 (0.374-0.946) |
| Model 1** | 1.531 (0.471-4.977) | 1.567 (0.712-3.450) | 1.638 (0.900-2.979) |
| Model 2±± | 1.475 (0.310-7.021) | 1.580 (0.714-3.495) | 2.027 (1.089-3.772) |
| Hypertension | | | |
| Unadjusted | 1.051 (0.525-2.105) | 0.622 (0.386-1.003) | 0.749 (0.510-1.100) |
| Model 1** | 0.861 (0.324-2.285) | 0.639 (0.329-1.238) | 0.742 (0.448-1.229) |
| Model 2±± | 0.913 (0.304-2.736) | 0.570 (0.283-1.147) | 0.719 (0.426-1.212) |
| Asthma | | | |
| Unadjusted | 1.713 (0.768-3.822) | 0.751 (0.431-1.308) | 1.027 (0.653-1.614) |
| Model 1** | 1.787 (0.572-5.587) | 0.961 (0.500-1.850) | 1.086 (0.642-1.836) |
| Model 2±± | 1.257 (0.292-5.419) | 0.768 (0.389-1.518) | 0.888 (0.516-1.529) |
| Anaemia | | | |
| Unadjusted | 2.964 (0.858-10.244) | 4.562 (1.010-20.610) | 4.552 (1.768-11.720) |
| Model 1** | 2.683 (0.568-12.667) | 7.408 (1.149-47.769) | 3.432 (1.118-10.534) |
| Model 2±± | 2.434 (0.470-12.604) | 9.343 (1.435-60.817) | 4.205 (1.304-13.557) |
OR = Odds Ratio
CI = Confidence Interval
Model 1 adjusted for age, marital status, RBS group and Hb group
Model 2 adjusted for same variables in model 1 plus all other chronic disease
Both models in ‘Total’ sample were further adjusted for gender.
Individuals with hypertension were less likely to report Category B depression than non-hypertensives (OR=0.72).
Overall female gender had a greater influence to develop Category B depression (OR=2.96). Participants with RBS <138 were about 4.0 times more likely to develop Category B depression than those with RBS>138. While participants with Hb >10 were approximately 1.9 times more likely to develop Category B depression than those with Hb <10. Males with RBS <138 were 7.1 times more likely to report Category B depression than those with RBS >138. In contrast, females with RBS <138 were 3.1 times more likely to report Category B depression than those with RBS >138. Males with Hb >10 were 3.2 times more likely to report Category B depression than those with Hb <10. In contrast, females with Hb >10 were 4.2 times more likely to report Category B depression than those with Hb <10 [Table/Fig-5].
Socio-demographic factors and laboratory indices predicting Category B depression in participants with at least one chronic disease.
| Variables | Male *OR(95% CI±) | Female *OR(95% CI±) | Total *OR(95% CI±) |
|---|
| Age | 0.923 (0.890-0.956) | 1.004 (0.987-1.021) | 0.973 (0.960-0.986) |
| Gender |
| Male | - | - | 1.0 |
| Female | - | - | 2.960 (1.927-4.546) |
| Marital Status |
| Single | NC** | 1.0 | 1.0 |
| Married | | 0.378 (0.212-0.672) | 0.301 (0.180-0.506) |
| Others | | 1.611 (0.631-4.115) | 1.789 (0.710-4.510) |
| RBS (mg/dl) |
| <138 | 7.143 (2.995-17.268) | 3.065 (1.844-5.096) | 4.039 (2.641-6.179) |
| >138 | 1.0 | 1.0 | 1.0 |
| Hb (g/dl) |
| <10 | 1.0 | 1.0 | 1.0 |
| >10 | 3.184 (1.255-8.073) | 4.201 (2.406-7.336) | 1.853 (1.256-2.733) |
OR = Odds Ratio;
CI = Confidence Interval;
Indicates number cannot be calculated due to zero in a category;
RBS: random blood sugar; Hb: Haemoglobin.
Discussion
This report represents the first epidemiologic study on the frequency and severity of depression in four of the most common chronic diseases in Pakistan; anaemia, hypertension, diabetes and asthma. Similar to previous studies, we found a significant association between depression and the aforementioned chronic conditions in our community. We also found a higher depression risk in patients with anaemia and hypertension as compared to asthma and diabetes. Association of depression with chronic diseases is well established in previous literature [15, 16]. A cross-sectional study conducted by Patten SB et al., found an increased risk of major depression in patients with chronic medical disorders compared to those without such disorders (4% vs. 2.8%) [17]. Burden of medical bills, fear of losing one’s job and reduction in earning power may be a potentiating factor for developing depression in these patients. This situation is alarming as it could have a negative impact on the patient’s well-being. In spite of the elevated morbidity, disability, mortality and reduced quality of life, comorbid depression continues to be under-recognized and undertreated [18-21], possibly due to the stigma attached to it leading to poor patient compliance. An understanding of the course of depression and its masked presentation is crucial to the medical management of patients with chronic illness. Comorbid depression is associated with increased symptom burden; functional impairment; greater costs due to overutilization of medical services; poor adherence to lifestyle alterations such as diet control, regular exercise, abstinence from smoking and timely medications; as well as direct pathophysiological effects on inflammatory mediators, metabolic parameters hypothalamic-pituitary pathway and the autonomic nervous system [22].
Our results also illustrated that most of the patients were categorized under the minimal classification of BDI scale. As opposed to findings from western literature where the severity of depression is slightly higher, there are several protective elements that may inhibit the development of depression in our community, explaining the low incidence of comorbid depression in our population. These factors include the eastern cultural values and the extended family systems. Several studies from the West and Asia have presented that social support reduces the development of depressive symptoms in people with chronic disorders [23, 24]. Familial relations and interactions within a closely knitted community are of particular importance in Pakistani population, and family support is vital especially in times of illness and during treatment. A chronically ill individual should be advised to establish good familial relations. Along with the patient, the attendants should be counselled in their role in patient satisfaction and betterment. As was expected, patients suffering from all four chronic diseases manifested with severe depression in our study probably due to a poor quality of life and increased medical expenses from managing so many ailments.
Our data also shows that women are significantly more likely to be depressed as compared to men. A previous study reported prevalence of depressive symptoms was more in women than in men (19.7% vs. 13.9%) [17]. Prior studies have implicated a role for female hormones, such as estrogen, however the relationship of depression and estrogen is very diverging with studies establishing both positive and negative association [25,26]. Furthermore, education is likely to enhance female independence: women develop greater confidence and capabilities to make decisions regarding their own health. Educated individuals are more likely to seek medical care and consequently become diagnosed with depression and chronic disease [27]. Women from our setup have little to no education, leaving them more dependent on others during their illness. Additionally, previous studies have noted women’s higher vulnerability to the adverse mental health effects of a lower socioeconomic status as compared to men [27]. Public health policy can benefit from understanding gender differences to better address the mental health needs of the community. Another noteworthy finding is that most severely depressed patients belonged to a younger age group. We generally do not anticipate chronic diseases at a younger age; however, the ones that do develop such diseases earlier in life report greater depressive symptoms than those who develop them later [28].
Moreover, there is a greater sense of hopelessness as compared to older individuals as they see a lifetime ahead with a debilitating condition which may compromise their quality of life.
Anaemia was found to be the highest prevailing chronic illness in our set-up with the highest frequency of comorbid depression. According to WHO and the National Health Survey of Pakistan (NHSP), among Pakistani non-pregnant women aged 15-49 years, 51% had blood haemoglobin concentration of less than 12 g/dl and overall mean blood haemoglobin concentration was 11.7 g/ dl whereas haemoglobin in young men varied from 12% to 28% depending on socioeconomic status [29,30]. Several theories have been postulated for the relationship of depression with anaemia. Firstly, reduced muscle strength and weakness are commonly associated with anaemia and may have a negative effect on the patient’s quality of life, therefore promoting the development of depressive symptoms [31]. Secondly, malnutrition, a common cause of anaemia, can lead to development of comorbid depression. Majority of the population coming to a tertiary care hospital setting belong to a low socioeconomic group; hence, have a poor nutritional status. Patients with comorbid depression visit a healthcare facility more frequently as compared to medically ill patients without depression, which means that the physician has more opportunities to screen and monitor the mental health status of these individuals. Himelhoch S et al., illustrated that emergency room visits are two to three times more common among patients with diabetes and hypertension who have depression as opposed to chronically ill patients without depression [32]. One possible explanation is that depressed patients have an enhanced perception and a greater sensitivity to physical symptoms [33]. Furthermore, the presence of a chronic condition may reduce the probability of health care providers to recognize or treat depression as they may overlook non-specific symptoms such as fatigue, poor concentration and a general lack of interest. Depression can hinder the patient’s involvement in the treatment plan; therefore, it becomes clinically significant to anticipate when a patient with a chronic condition may develop comorbid depression. General physicians are the backbone of health care system in Pakistan with majority of the population first visiting a general physician. These doctors mostly practice solo and do not have the medical expertise for identifying a mental health crisis. Therefore, they must be trained to identify the presence of depression when patients present with a chronic physical condition. In addition, promoting public awareness can help in countering the stigma surrounding mental illness and can alert health personnel as well as the general public that depression is as damaging to health as a physical condition.
Limitation
There are several limitations in our study which need to be considered. Firstly, we considered patients only from a single tertiary hospital. Although Civil Hospital, one of the largest hospitals in Pakistan, is a medical centre where people come from all parts of the city, we believe that including other hospitals would have increased the strength of our results and helped us to generalize the findings. Secondly, there is a possibility of getting amplified scores on depression scales due to the somatic symptoms of the disease. For instance, asthma can cause insomnia and asthma medications such as β-agonists can cause anxiety; both of these symptoms are part of the depression scale we used and can alter the final tabulated score. The low rate of diabetes in our study is understated, since it is uncommon for people in our setup to undergo routine exams and laboratory tests for detection. Finally, findings from this study may not be applicable to other countries in the region, or even to different regions of Pakistan.
Conclusion
In future, larger studies with multiple hospitals nationwide should be conducted regarding depression and chronic medical illnesses.
A worthwhile field for research includes investigating the effect of psychological and behavioural interventions in the physically ill. We also suggest that epidemiologic studies should control for other comorbid chronic conditions in their analysis of such an association.
Data presented as frequency (percentages) and means±SD
*Beck Depression Inventory (BDI) scale was used
±p value<0.05 was considered statistically significant
**Pearson’s Chi-square (χ2) test was used to compare categorical variables
±±One-way ANOVA was used to compare continuous variable that was normally distributedHb: Haemoglobin; RBS: Random Blood Sugar; SD: Standard Deviation.
Data presented as frequency (percentages)
*Beck Depression Inventory (BDI) scale was used;
±p-value<0.05 was considered statistically significantPearson’s Chi-square (χ2) test was used to compare categorical variables; HTN: Hypertension
*OR = Odds Ratio
±CI = Confidence Interval
**Model 1 adjusted for age, marital status, RBS group and Hb group
±±Model 2 adjusted for same variables in model 1 plus all other chronic disease
Both models in ‘Total’ sample were further adjusted for gender.
*OR = Odds Ratio;
±CI = Confidence Interval;
**Indicates number cannot be calculated due to zero in a category;
RBS: random blood sugar; Hb: Haemoglobin.