Intoduction
Acute Pulmonary Embolism (APE) increases the pressure of the pulmonary arterial system with resulting Right Ventricle Dysfunction (RVD).
Aim
The aim of this study was to evaluate the relationship between Pulmonary Artery Obstruction Index (PAOI) and signs of right heart dysfunction with computed tomography angiography in APE patients.
Materials and Methods
We evaluated 72 consecutive patients (mean age 64.1±16.9 years; 59.7% female) with APE who had initial echocardiography with computed tomography angiography. Among these 72 patients, only 25 (34.7%) patients had follow up computed tomography angiography images and we evaluate right heart dysfunction with PAOI and Right Ventricle (RV) diameter.
Results
In 72 patients with APE, PAOI and RVD signs were significantly high. Twenty five of these 72 patients (34.7%) had follow up computed tomography angiography images and among those 25 patients, there was correlation between reduction of PAOI and RV diameter in follow up period.
Conclusion
PAOI and RVD signs in initial computed tomography angiography and in follow up computed tomography angiography can be used in the management of Pulmonary Embolism (PE) patients.
Introduction
PE is a common and potentially fatal cardiovascular disorder. Mortality is caused by pressure overload of the RV. Acute PE increases the pressure of the pulmonary arterial system and RV resulting in RVD [1]. Echocardiography (ECHO) is recommended as the first-line examination to diagnose the signs of RVD, based on its ability to evaluate RV size, systolic function, pressure, volume and RV wall motion [2]. RVD characterized with enlarged RV, straighten interventricular septum, increased ratio of Pulmonary Artery to Ascending Aorta diameter (PA/Ao), increased Superior Vena Cava (SVC) diameter and reflux of intravenous contrast material into Inferior Vena Cava (IVC) and hepatic veins [3,4]. In literature, there are some studies with limited patient number, comparing directly Pulmonary Computed Tomography Angiography (PCTA) findings with ECHO [5,6,7]. Later in literature, clot burden score had been proposed to calculate the severity of PE and it is an important predictor of RVD [8,9,10]. Clot burden can be assessed semiquantitatively by CT, using scoring system such as PAOI [8]. The PAOI ratio may distinguish the patients with or without RVD among patients with PE [11]. In studies using CT, the rate of complete resolution of PE ranged from 32% to 85% after a follow up period of three weeks to nine months and clot burden in the CT has been suggested to be an important predictor of residual PE [12,13,14]. There were studies that were examined RV by using ECHO [15,16], but there was no study examined RV by using PCTA in follow up period after acute PE.
The purpose of this study was to assess the correlation between PAOI and signs of RVD with PCTA in patients with acute PE and to determine the relationship between resolution rate of clot burden and changes of RVD signs in follow up PCTA. However, according to our knowledge, this is the first study showing the changes of RVD signs associated with resolution of clot burden ratio in follow up PCTA.
Materials and Methods
Study population: Our Institutional Review Board approved this retrospective study protocol. This single-center study based on the collected data of PCTA with PE and follow up PCTA from Radiology Department database. Imaging data between January 2014 and March 2016 were reviewed. All subjects were older than 18 years of age and underwent at least one PCTA examination with suggesting acute PE event and those patients who had ECHO examination were included in the study. There were 225 PCTA studies performed at our institution for evaluation of PE during the given period. PCTA studies reported as positive for PE and with subsequent follow up PCTA studies were retrieved. After excluding, 153 (68%) patients who had previous heart disease, chronic PE, inadequate information in the ECHO reports and insufficient PCTA image quality, there were 72 (32%) patients eligible for the present study. PAOI and signs of RVD in PCTA compared with ECHO reports to discriminate the patients with RVD. Only 25 (34.7%) of these patients had follow up imaging study. Relationship with PE resolution and changes of RVD signs in PCTA analyzed in follow up PCTA. All patients had received anticoagulation therapy.
CT scanning protocol: All PCTA examinations were performed using a 128-detector, 160-slice computed tomography device (Prime Aquilion, Toshiba Medical Systems, Otawara, Japan). A 70-100 ml bolus of iodinated contrast (concentration 300 mg/ml) medium was injected into the left antecubital vein at a rate of 4 ml/s with an automatic injector system. The CT scanning was performed with a bolus-tracking technique after the start of the contrast medium injection, from the lowest hemidiaphragm to the top of the lungs. All PCTA examinations were performed in the supine position, from cranium to cauda, within a single inhalation period. PCTA protocol for PE with the following imaging parameters; slice thickness: 0.5 mm, slice interval: 0.25 mm, rotation time: 400 ms, 100 kVp and 300-400 mAs. Axial CT sections were transferred to the work station and examined on the mediastinum window.
Calculation of Obstruction Index (PAOI) - Signs for RVD : All PCTA with PE and follow up studies reviewed by 14 years experienced radiologist. Radiologist assessed PE on PCTA images by detecting the presence of an endoluminal central filling defect (partially or completely) occluding pulmonary arteries. Only patients with PE, included into study. PAOI score were calculated for all patients with acute PE. Complete clot burden resolution at PCTA was determined as there was no presence of endoluminal filling defect in pulmonary arteries.
PAOI calculation with Qanadli SD et al., score [8]; Pulmonary arteries are subdivided into ten segmental arteries for each lung (three to the upper lobe, two to the middle lobe and lingula, five to the lower lobe). The presence of an embolus in a segmental artery is scored as 1 point, and more proximal emboli are scored a value equal to the number of segmental branches arising from the affected vessel. Each score is multiplied by 1 or 2 according to the estimated degree of vascular occlusion (1: partial occlusion, 2: complete occlusion). A subsegmental embolus is considered an embolus in the corresponding segmental artery, with partial occlusion (scoring 1×1=1). The score ranges from 0 to 40. The percentage value is then calculated as: (n×d) /40×100 {n: score of the embolus multiplied by the number of dependent segments (min=1; max=20); d: degree of obstruction (min=1, max=2)}.
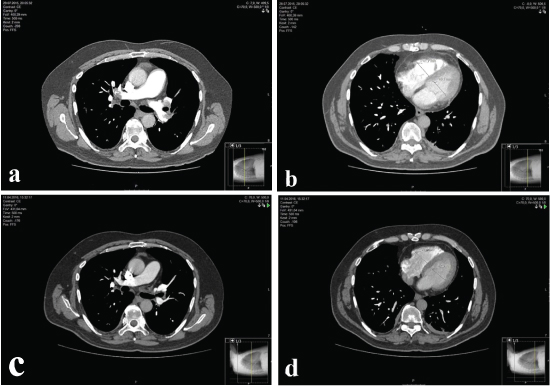
Assessing RVD; ratio of RV/LV, to PA/Ao ratio, SVC diameter and presence of contrast medium reflux into the IVC. RV/LV ratio obtained by calculating the ratio between the diameters of the RV and LV short axes in the axial plane, measured from the endocardial margin of the free wall to the interventricular septum [Table/Fig-1a-d]; diameters of the main PA and the ascending aorta were measured on the transverse image at which the right PA is in contiguity with the main PA. The diameters of the SVC were measured on the transverse CT image where the azygos vein reaches the SVC. Reflux of contrast medium was considered when it was in the intrahepatic portion of the IVC [17,18].
a,b) Assessing RV/LV ratio in a patient with PE in initial PCTA; c,d) Assessing RV/LV ratio in the same patient after 60 days of treatment in follow up PCTA.
Echocardiography (ECHO): Reports of ECHO within 48 hours after performing PCTA were reviewed. ECHO examinations were performed using the Vivid S5 system (GE Healthcare, Wauwatosa, WI) with 2.5–5 MHz probes. The RVD is defined as presence of RV hypokinesis and when 1 or more of the following findings present: RV dilation (end diastolic diameter >30 mm or RV / left ventricular end-diastolic diameter ratio >1 in 4-chamber view); or paradoxical septal systolic movements or pulmonary hypertension [11,12]. If the patient had multiple ECHO studies during the period, the most abnormal ECHO was included in the analysis.
Statistical Analysis
SPSS software 18.0 (SPSS Inc. Chicago, IL) was used for statistical analysis of the data, which are presented as means±standard deviation and overall percentages. The correlation between RVD in ECHO and PAOI, CT signs of RVD were assessed with student’s t-test. Correlation between PAOI score and PCTA signs of right heart dysfunction in baseline and follow up was assessed with the Pearson coefficient for normally distributed data. The correlation of RVD in ECHO and reflux to IVC was assessed with Chi-square test. Receiver Operation Characteristic (ROC) curve analysis was conducted to identify an optimum cutoff values of PAOI score and RV/LV ratio for prediction of RVD. A p-value of less than 0.05 was considered to indicate a statistically significance difference.
Results
The mean age of the patients was 64.1±16.9 years and ranged from 19 years to 90 years. There were 29 (40.3%) males and 43 (59.7%) females. The mean PAOI score in the study population was 25.2±17.6. ECHO showed RVD in 30 patients (41.7%) [Table /Fig-2]. PAOI, RV/LV ratio and RV diameter were 39.08±16.03, 1.11±0.14 and 47.61±9.67 respectively, in RVD+ patients on ECHO, whereas the corresponding values were 15.32±10.69, 0.93± 0.90 and 38.69±6.44 respectively, in RVD- patients. A significant difference was observed between RVD+ and RVD- patients (p<0.001). PA diameters and SVC diameters were 31.70±4.06 and 21.27±2.80 in RVD+ patients and 29.37±4.20 and 19.58±2.55 in RVD- patients. For those measurements p-values were 0.022 for PA diameters and p=0.010 for SVC diameters and those p-values were <0.05 which means there is statistical significant difference. There was no statistically significant difference at PA/Ao ratio in RVD+ and RVD- patients (p=0.052) [Table/Fig-3]. Also relevant correlation (p<0.05) between PAOI score and RV dimension, PAOI score and RV/LV ratio, PAOI score and PA/Ao ratio, PAOI and SVC dimension was found [Table/Fig-4].
Patients pulmonary CTA findings data and right ventricular dysfunction on echocardiography at time of admission.
| Pulmonary CTA Findings | |
|---|
| PAOI (%)* | 25.22 (±17.68) |
| RV diameter* | 42.40 (±9.04) |
| LV diameter* | 40.75 (±5.85) |
| RV/LV ratio* | 1.03 (±0.17) |
| PA diameter* | 30.34 (±4.27) |
| Ao diameter* | 33.69 (±4.84) |
| PA/Ao ratio* | 0.90 (±0.11) |
| SVC diameter* | 20.28 (±2.77) |
| Reflux to IVC n (%) | 23 (31.9%) |
| RVD in echocardiography n (%) | 30 (41.7%) |
CTA: Computed tomographic angiography, PAOI : pulmonary arterial obstruction index, RV: right ventricul dimension, LV: left ventricul dimension. RV/LV: right ventricular/left ventricular dimensions, PA: main pulmonary artery dimension. Ao:desenden aorta dimension, Pa/Ao: main pulmonary artery/desenden aorta dimensions. SVC: superior vena cava dimension, IVC: inferior vena cava, RVD: right ventricular dysfunction. n:number of patient, *: mean ± Standard deviation
Computed tomography angiography findings of patients with and without right ventricular dysfunction on echocardiography.
| Computed-Tomography angiography | RVD (-) n:42 | RVD (+) n:30 | p-value |
|---|
| PAOI (%) | 15.32±10.69 | 39.08±16.03 | <0.001 |
| RV/LV | 0.93±0.90 | 1.11±0.14 | <0.001 |
| RV diameter (mm) | 38.69±6.44 | 47.61±9.67 | <0.001 |
| PA/Ao | 0.88±0.11 | 0.93±0.09 | 0.052 |
| PA diameter (mm) | 29.37±4.20 | 31.70±4.06 | 0.022 |
| SVC diameter (mm) | 19.58±2.55 | 21.27±2.80 | 0.010 |
PAOI : pulmonary arterial obstruction index, RV: right ventricul dimension, RV/LV: right ventricular/left ventricular dimensions, PA: main pulmonary artery, PA/Ao: main pulmonary artery/desenden aorta dimensions, SVC: superior vena cava, RVD: right ventricular dysfunction, n: number of patients. Statistically significant p-values are indicated in bold.
Correlation between Pulmonary Arterial Obstruction Index (PAOI) and Right Ventricul Dysfunction (RVD) signs parameters in initial pulmonary CTA
| Parameters | Pearson r | p-value |
|---|
| PAOI and RV | 0.634 | <0.001 |
| PAOI and RV/LV | 0.788 | <0.001 |
| PAOI and PA | 0.211 | 0.075 |
| PAOI and PA/Ao | 0.294 | 0.013 |
| PAOI and SVC | 0.261 | 0.027 |
PAOI : pulmonary arterial obstruction index, RV: right ventricul dimension, RV/LV: right ventricular/left ventricular dimensions, PA: main pulmonary artery dimension, PA/Ao: main pulmonary artery/desenden aorta dimensions, SVC: superior vena cava dimension. Statistically significant p-values are indicated in bold.
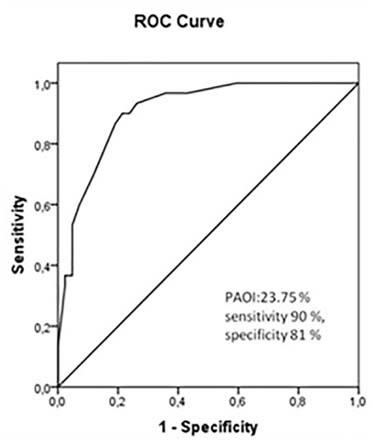
ROC curve analysis used to predict RVD revealed an area under the curve (AUC) of 0.907 for PAOI score (95% CI 0.840–0.974, p<0.001). The optimum cut off value for prediction of RVD was 23.75% for PAOI (sensitivity 90%, specificity 81%) [Table/Fig-5].
Receiver operation characteristic curve analysis for prediction of RVD by use of PAOI. AUC amount to 0.907 (95% CI, 0.840-0.974, p<0.001). The optimum cut-off value for prediction of RVD was 23.75 for PAOI with sensitivity 90%, specificity 81%.
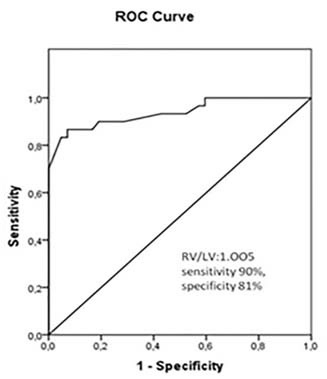
ROC curve analysis used to predict RVD revealed an area under the curve (AUC) of 0.938 for RV/LV ratio (95% CI 0.879–0.998, p<0.001). The optimum cut off value for prediction of RVD was 1.005 mm for RV/LV ratio (sensitivity 90%, specificity 81%) [Table/Fig-6].
Receiver operation characteristic curve analysis for prediction of right ventricular dysfunction by use of RV/LV. AUC amount to 0.938 (95% CI, 0.879−0.998, p<0.001). The optimum cut off value for prediction of RVD was 1.005 mm for RV/LV ratio with sensitivity 90%, specificity 81%.
Only 25 (34.7%) patients had follow up PCTA. The mean PAOI scores of subgroup population in initial and follow up PCTA were 29.36±19.06 and 6.5±10.2, respectively [Table/Fig-7]. Complete clot burden resolution was found at PCTA in 14 (56%) patient in the follow up period. ECHO showed RVD in 10 patients (40%). PCTA findings in subgroup, which included PAOI score and RV/LV ratio had significant difference between RVD+ and RVD- patients. In RVD+ patients (10/25), mean PAOI score was; 43±18.6 and mean RV/LV ratio was; 1,17±0,09; and in RVD- (15/25), mean PAOI score was; 20.26±13.36 and mean RV/LV ratio was; 0.95±0.10. There was a statistically significant correlation between reduction of mean PAOI score and reduction of mean RV diameter (p=0.048) in follow up PCTA [Table/Fig-8,9]. Mean interval between baseline and follow up PCTA was 140 days (range, 30–350 days).
Difference of parameters in initial and follow up pulmonary CTA.
| Variables | Difference |
|---|
| PAOI1 (%)* - PAOI2 (%)* | 29.36 ±19.06 - 6.5 ±10.30 |
| RV1diameter (mm)* - RV2diameter (mm)* | 42.43 ±8.73 - 37.84 ±6.97 |
| RV/LV1*- RV/LV2* | 1.04 ±0.14 - 0.90 ±0.10 |
| PA1 diameter (mm)* - PA2 diameter (mm)* | 30.86 ±4.66 - 28.98 ±4.33 |
| PA/Ao1* - PA/Ao2* | 0.92 ±0.10 - 0.86 ±0.09 |
| SVC1 diameter (mm)* - SVC2 diameter (mm)* | 20,18 ±2.35 - 19.04 ±2.20 |
| Reflux to IVC1 n (%) - Reflux to IVC2 n (%) | 9 (36%) - 2 (8%) |
PAOI : pulmonary arterial obstruction index, RV: right ventricul dimension, LV: left ventricul dimension RV/LV: right ventricular/left ventricular dimensions, PA: main pulmonary artery dimension, Ao:desenden aorta dimension, PA/Ao: main pulmonary artery/desenden aorta dimensions, SVC: superior vena cava dimension, IVC: inferior vena cava, RVD: right ventricular dysfunction, n:number of patient, *: mean ± SD, 1: initial CTA result, 2: Follow up CTA result.
Correlation between difference of Pulmonary Arterial Obstruction Index (PAOI) and difference of pulmonary CTA parameters of RVD in initial and follow up pulmonary CTA.
| Varaiables | Pearson r | p-value |
|---|
| PAOI1-PAOI2 and RV1-RV2 | 0.400 | 0.048 |
| PAOI1-PAOI2 and RV/LV1-RV/LV2 | 0.378 | 0.062 |
| PAOI1-PAOI2 and PA1-PA2 | 0.211 | 0.084 |
| PAOI1-PAOI2 and PA/Ao1-PA/Ao2 | 0.072 | 0.731 |
| PAOI1-PAOI2 and SVC1-SVC2 | 0.234 | 0.097 |
PAOI1-PAOI2 : difference of pulmonary arterial obstruction index between initial and follow up computed tomographic angiography (CTA).RV1-RV2: difference of right ventricul dimension between initial and follow up CTA. RV/LV1-RV/LV2: difference of right ventricular/left ventricular dimensions between initial and follow up CTA. PA1-PA2: difference of main pulmonary artery dimension between initial and follow up CTA. PA/Ao1-PA/Ao2: difference of main pulmonary artery/desenden aorta dimensions between initial and follow up CTA. SVC1-SVC2: difference of superior vena cava dimension between initial and follow up CTA. 1: initial CTA result, 2: Follow up CTA result. Statistically significant p-values are indicated in bold.
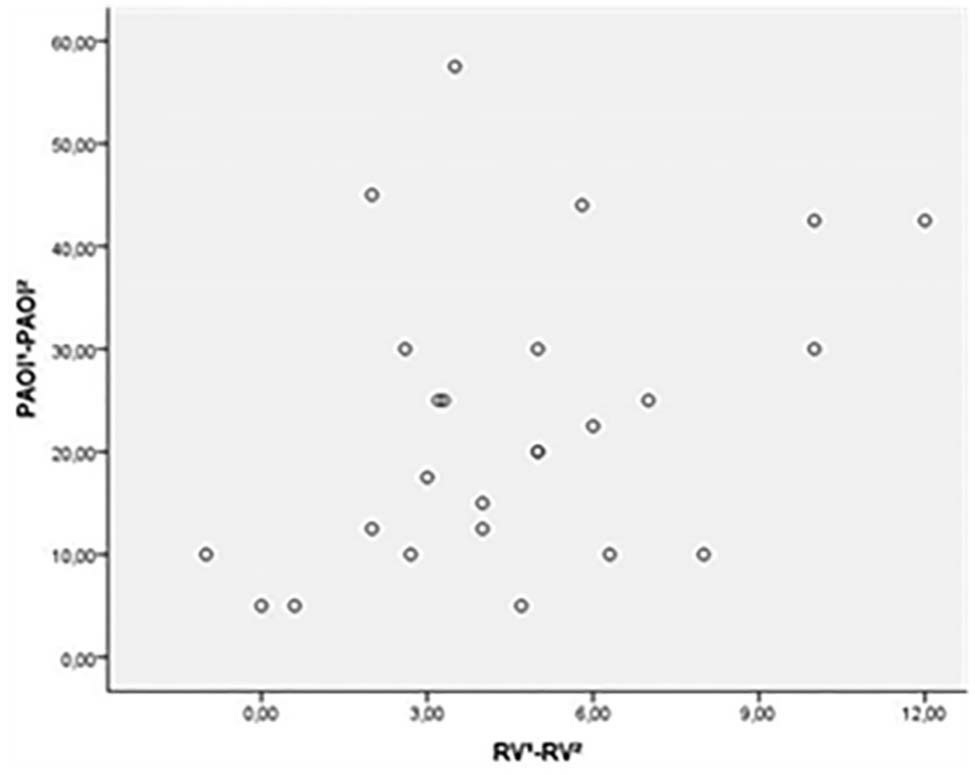
Scatter diagram shows positive correlation between difference PAOI and difference of RV dimension in initial and follow up pulmonary CTA (Pearson r = 0.400, p=0.048).
Overall mortality rate for acute PE in the first 30 days period, was 9.7% (7 patients). The mean age of these patients was 77±15.4 years. The mean PAOI score, RV/LV ratio and PA/Ao in these patients was 49.2±15.4, 1.28±0.15, 0.88±0.60, respectively. All these patients had reflux to IVC. ECHO showed RVD all of them. PAOI score and RV/LV ratio correlated significantly with mortality (p< 0.001; for both). Mean age was significantly higher in non-survivors than in survivors (p=0.028).
Discussion
PCTA has dramatically improved the quality of imaging of the pulmonary vasculature in the last decade. PAOI, which can be assessed semi-quantitatively by PCTA, provides quantitative values for the intensity of PE [8]. PE increases pulmonary vascular resistance that may lead to RVD. International ECHO multicenter studies have shown that in PE patients, RVD is a major determinant of short-term mortality [19,20]. RVD can be recognized on PCTA, previous studies have demonstrated the ability of PCTA to identify RVD by assessing the right ventricular to left ventricular (RV/LV) diameter ratio [21,22]. There were several studies that showed good correlation between PCTA and ECHO in detecting RVD [7,23]. Also Apfaltrer P et al., [6], showed that PAOI ratio can differentiate between patients RVD+ and RVD- patients. In several studies, PAOI and RV/LV ratio were evaluated as prognostic markers for PE, and most of these studies have showed that patients with PAOI>40%-60% and/or RV/LV>1.0-1.4 have significantly worse outcome [3,9,17,24]. In a meta-analytic study; increased RV/LV diameter ratio measured on transverse CT images conferred the strongest risk with a 5-fold higher risk for PE related mortality [25]. In our study, PAOI score and RV/LV ratio were higher on PCTA in patients who had RVD on ECHO. The results of our study indicate that PAOI is closely related to the RVD in PE patients. In our study, 7 (9.7%) patients who had died because of PE, had higher PAOI scores then the rest of the patients and also all of those 7 patients had RVD signs on PCTA and ECHO.
The rate of clot resolution and recovering time for RVD are important in the follow up period as they may facilitate objective diagnosis when patients with PE return with symptoms possibly due to recurrent or residual PE. PCTA in follow up period gives important information about the rate of PE resolution, and this also helps to consider the duration of anti-coagulant therapy. Aghayev A et al., [26] quantified the change in clot burden in follow up PCTA studies and they showed completely resolved clot burden in 77% of patients during the follow up period. In our follow up group, the mean value of the PAOI in initial PCTA was 29.36±19.06, and in follow up PCTA, the mean value of the PAOI was 6.5±10.2. Clot burden resolved completely in 56% of patients during the follow up period (range, 30–350 days). In several studies, ECHO has been used to assess the effectiveness of therapy in acute PE. Rapid normalization of regional or global RVD and improvement in right-sided hemodynamics after thrombolytic therapy are associated with favorable short and long-term prognosis [27,28]. Kline JA et al., [16], prospectively evaluated RV function in follow up by using ECHO and they reported; resolution of RV dilation and hypokinesis in 90% patients, but significant proportion of patients had ECHO evidence of pulmonary hypertension at the six-months of follow up period. There was no study that showed resolution of RVD by using PCTA in follow up period after PE. We aimed to show the changes of RVD signs associated with resolution of clot burden ratio in follow up PCTA. There was statistically significant correlation between resolution rate of PAOI ratio and RV dimensions at initial and follow up PCTAs.
Limitation
Retrospective design of the study, small initial and follow up sample size, results of ECHO based on reports, not used ECG-gated scanning technique in PCTA and different intervals of the follow up PCTA.
Conclusion
Although, thrombolytics have serious complications, there was no adequately multicenter prospective cohort studies with follow up imaging programs that has shown alteration of clot burden and normalization of RV after PE. Despite the high radiation exposure, follow up PCTA is frequently obtained in a significant proportion of patients with PE. With the help of more studies like this one, may be useful to form a consesus on follow up imaging protocols for PE patients to estimate the amount of clot burden and clot burden associated RVD and this will help to optimize the duration of PE therapy and also to avoid unnecessary imaging examinations.
CTA: Computed tomographic angiography, PAOI : pulmonary arterial obstruction index, RV: right ventricul dimension, LV: left ventricul dimension. RV/LV: right ventricular/left ventricular dimensions, PA: main pulmonary artery dimension. Ao:desenden aorta dimension, Pa/Ao: main pulmonary artery/desenden aorta dimensions. SVC: superior vena cava dimension, IVC: inferior vena cava, RVD: right ventricular dysfunction. n:number of patient, *: mean ± Standard deviation
PAOI : pulmonary arterial obstruction index, RV: right ventricul dimension, RV/LV: right ventricular/left ventricular dimensions, PA: main pulmonary artery, PA/Ao: main pulmonary artery/desenden aorta dimensions, SVC: superior vena cava, RVD: right ventricular dysfunction, n: number of patients. Statistically significant p-values are indicated in bold.
PAOI : pulmonary arterial obstruction index, RV: right ventricul dimension, RV/LV: right ventricular/left ventricular dimensions, PA: main pulmonary artery dimension, PA/Ao: main pulmonary artery/desenden aorta dimensions, SVC: superior vena cava dimension. Statistically significant p-values are indicated in bold.
PAOI : pulmonary arterial obstruction index, RV: right ventricul dimension, LV: left ventricul dimension RV/LV: right ventricular/left ventricular dimensions, PA: main pulmonary artery dimension, Ao:desenden aorta dimension, PA/Ao: main pulmonary artery/desenden aorta dimensions, SVC: superior vena cava dimension, IVC: inferior vena cava, RVD: right ventricular dysfunction, n:number of patient, *: mean ± SD, 1: initial CTA result, 2: Follow up CTA result.
PAOI1-PAOI2 : difference of pulmonary arterial obstruction index between initial and follow up computed tomographic angiography (CTA).RV1-RV2: difference of right ventricul dimension between initial and follow up CTA. RV/LV1-RV/LV2: difference of right ventricular/left ventricular dimensions between initial and follow up CTA. PA1-PA2: difference of main pulmonary artery dimension between initial and follow up CTA. PA/Ao1-PA/Ao2: difference of main pulmonary artery/desenden aorta dimensions between initial and follow up CTA. SVC1-SVC2: difference of superior vena cava dimension between initial and follow up CTA. 1: initial CTA result, 2: Follow up CTA result. Statistically significant p-values are indicated in bold.
[1]. Grifoni S, Olivotto I, Cecchini P, Pieralli F, Camaiti A, Santoro G, Short-term clinical outcome of patients with acute pulmonary embolism, normal blood pressure, and echocardiographic right ventricular dysfunctionCirculation 2000 101:2817-22. [Google Scholar]
[2]. Rudski LG, Lai WW, Afilalo J, Hua L, Handschumacher MD, Cahndrasekaman K, Guidelines for the echocardiographic assessment of the right heart in adults: a report from the American Society of Echocardiography endorsed by the European Association of Echocardiography, a registered branch of the European Society of Cardiology, and the Canadian Society of EchocardiographyJ Am Soc Echocardiogr 2010 23:685-713. [Google Scholar]
[3]. Schoepf UJ, Kucher N, Kipfmueller F, Quiroz R, Costello P, Goldahaber SZ, Right ventricular enlargement on chest computed tomography: a predictor of early death in acute pulmonary embolismCirculation 2004 110:3276-80. [Google Scholar]
[4]. Quiroz R, Kucher N, Schoepf UJ, Kipfmuller F, Solomon SD, Costello P, Right ventricular enlargement on chest computed tomography: prognostic role in acute pulmonary embolismCirculation 2004 109:2401-04. [Google Scholar]
[5]. Mansencal N, Joseph T, Vieillard-Baron A, Langlois S, El Hajjam M, Qanadli SD, Diagnosis of right ventricular dysfunction in acute pulmonary embolism using helical computed tomographyAm J Cardiol 2005 95:1260-63. [Google Scholar]
[6]. Apfaltrer P, Henzler T, Meyer M, Roeger S, Haghi D, Gruettner J, Correlation of CT angiographic pulmonary artery obstruction scores with right ventricular dysfunction and clinical outcome in patients with acute pulmonary embolismEur J Radiol 2012 81:2867-71. [Google Scholar]
[7]. Cok G, Tasbakan MS, Ceylan N, Bayraktaroglu S, Duman S, Can we use CT pulmonary angiography as an alternative to echocardiography in determining right ventricular dysfunction and its severity in patients with acute pulmonary thromboembolism?Jpn J Radiol 2013 31:172-78. [Google Scholar]
[8]. Qanadli SD, El Hajjam M, Vieillard-Baron A, Joseph T, Mesurolle B, Oliva VL, New CT index to quantify arterial obstruction in pulmonary embolism: comparison with angiographic index and echocardiographyAJR 2001 176:1415-20. [Google Scholar]
[9]. Wu AS, Pezzullo JA, Cronan JJ, Hou DD, Mayo-Smith WW, CT pulmonary angiography: quantification of pulmonary embolus as a predictor of patient outcome-initial experienceRadiology 2004 230:831-35. [Google Scholar]
[10]. Mastora I, Remy-Jardin M, Masson P, Galland E, Dellanoy V, Severity of acute pulmonary embolism: evaluation of a new spiral CT angiographic score in correlation with echocardiographic dataEur Radiol 2003 13:29-35. [Google Scholar]
[11]. Varol K, Gumus C, Yucel H, Sezer F, Seker E, Inci MF, Correlation of right ventricular dysfunction on acute pulmonary embolism with pulmonary artery computed tomography obstruction index ratio (PACTOIR) and comparison with echocardiographyJpn J Radiol 2015 33:311-16. [Google Scholar]
[12]. Van Es J, Douma RA, Kamphuisen PW, Gerdes VE, Verhamme P, Wells PS, Clot resolution after 3 weeks of anticoagulant treatment for pulmonary embolism: comparison of computed tomography and perfusion scintigraphyJ Thromb Haemost 2013 11:679-85. [Google Scholar]
[13]. Van Rossum AB, Pattynama PM, Tjin ATE, Kieft GJ, Spiral CT appearance of resolving clots at 6 week follow-up after acute pulmonary embolismJ Comput Assist Tomogr 1998 22:413-17. [Google Scholar]
[14]. Alonso-Martinez JL, Anniccherico-Sanchez FJ, Urbieta-Echezarreta MA, Garcia-Sanchotena JL, Herrero HG, Residual pulmonary thromboemboli after acute pulmonary embolismEur J Intern Med 2012 23:379-83. [Google Scholar]
[15]. Ciurzynski M, Kurzyna M, Bochowicz A, Lichodziejewska B, Liszewska-Pfeifer D, Pruszczyk P, Long-term effects of acute pulmonary embolism on echocardiographic Doppler indices and functional capacityClin Cardiol 2004 27:693-97. [Google Scholar]
[16]. Kline JA, Steuerwald MT, Marchick MR, Hernandez-Nino J, Rose GA, Prospective evaluation of right ventricular function and functional status 6 months after acute submassive pulmonary embolismChest 2009 136:1202-10. [Google Scholar]
[17]. van der Meer RW, Pattynama PM, vanStrijen MJ, van den Berg-Huijsmans AA, Hartmann IJ, Putter H, Right ventricular dysfunction and pulmonary obstruction index at helical CT: prediction of clinical outcome during 3-month follow-up in patients with acute pulmonary embolismRadiology 2005 235(3):798-803. [Google Scholar]
[18]. Collomb D, Paramelle PJ, Calaque O, Bosson JL, Vanzetto G, Barnaud D, Severity assessment of acute pulmonary embolism: evaluation using helical CTEur Radiol 2003 13:1508-14. [Google Scholar]
[19]. Goldhaber SZ, Visani L, De Rosa M, Acute pulmonary embolism: clinical outcomes in the International Cooperative Pulmonary Embolism Registry (ICOPER)Lancet 1999 353:1386-89. [Google Scholar]
[20]. Ribeiro A, Lindmarker P, Juhlin-Dannfelt A, Johsson H, Jorfeldt L, Echocardiography Doppler in pulmonary embolism: right ventricular dysfunction as a predictor of mortality rateAm Heart J 1997 134:479-87. [Google Scholar]
[21]. Henzler T, Krissak R, Reichert M, Sueselbeck T, Schoenberg SO, Fink C, Volumetric analysis of pulmonary CTA for the assessment of right ventricular dysfunction in patients with acute pulmonary embolismAcad Radiol 2010 17:309-15. [Google Scholar]
[22]. Wong LF, Akram AR, McGurk S, Van Beek EJ, Reid JH, Murchison JT, Thrombus load and acute right ventricular failure in pulmonary embolism: correlation and demonstration of a “tipping point” on CT pulmonary angiographyBr J Radiol 2012 85:1471-76. [Google Scholar]
[23]. Aribas A, Keskin S, Akilli H, Kayrak M, Erdogan HI, Guler I, The use of axial diameters and CT obstruction scores for determining echocardiographic right ventricular dysfunction in patients with acute pulmonary embolismJpn J Radiol 2014 32:451-60. [Google Scholar]
[24]. Ghuysen A, Ghaye B, Willems V, Lambermant B, Gerard P, Dodelinger RF, Computed tomographic pulmonary angiography and prognostic significance in patients with acute pulmonary embolismThorax 2005 60:956-61. [Google Scholar]
[25]. Vedovati MC, Germini F, Agnelli G, Becattini C, Prognostic role of embolic burden assessed at computed tomography angiography in patients with acute pulmonary embolism: systematic review and meta-analysisJ Thromb Haemost 2013 11:2092-02. [Google Scholar]
[26]. Aghayev A, Furlan A, Patil A, Gumus S, Jeon KN, Park B, The rate of resolution of clot burden measured by pulmonary ct angiography in patients with acute pulmonary embolismAJR Am J Roentgenol 2013 April 200:791-97. [Google Scholar]
[27]. Fasullo S, Scalzo S, Maringhini G, Ganci F, Cannizzaro S, Basile I, Six-month echocardiographic study in patients with submassive pulmonary embolism and right ventricle dysfunction: comparison of thrombolysis with heparinAm J Med Sci 2011 341:33-39. [Google Scholar]
[28]. Grifoni S, Vanni S, Magazzini S, Olivotto I, Conti A, Zanobetti M, Association of persistent right ventricular dysfunction at hospital discharge after acute pulmonary embolism with recurrent thromboembolic eventsArch Intern Med 2006 166(19):2151-56. [Google Scholar]