Non-Alcoholic Fatty Liver Disease (NAFLD) is emerging as a major health disability in patients attending gastroenterology clinics. Apart from alcohol abuse and the hepatitis, nutrition related alcoholic diseases contribute significantly to this category of patients.
Hepatic steatosis is considered as an instigating process in NAFLD, further leading to cirrhosis [1-6]. New data shows that NAFLD is as an independent risk factor for cardiovascular mortality [1,7]. Noteworthy concern is that the increased cardiovascular mortality associated with NAFLD begins at the relatively early age of 45 [8].
Free fatty acids, the substrate for triglyceride formation, trigger cell death by inducing oxidative stress, provoking production of cytokines and reactive oxygen species and activating apoptosis, potentially resulting in progressive hepatic disease. Hepatic steatosis can adversely affect the course of viral hepatitis and decrease the efficiency of treatment [1,9,10]. Moreover due to decreased functional reserve leads to post transplant failure. [11,12] There is growing evidence that risk of hepatocellular carcinoma increased with steatosis [13] Hepatic steatosis may have a causative effect and contribute to the development of diabetes through interference with insulin signalling and may be the pathogenic link between obesity and its metabolic complications [14,15]. This association has previously been attributed to co-morbidities of NAFLD (obesity, dyslipidemia, hypertension, and diabetes) rather than NAFLD itself [7,16].
There are no simple reliable tools for evaluating liver fat and the assessment of therapy response to various methods of reducing liver fat. Initial global impression can be obtained from sonographic methods, which provide qualitative information about liver steatosis in the 3 point grading system. Ultrasound techniques are technically inadequate for quantitative assessment of liver fat. Non-contrast CT examination is used as a common tool with acceptable accuracy for assessing liver fat [5,8]. Differences between the liver and spleen Hounsfield Unit (HU) numbers are found useful in concluding hepatic steatosis. LAI has been described as an indicator of hepatic steatosis and provides reasonable estimate over a range of 0-80% of the micro-vesicular steatosis. LAI between -10 to -5 HU correlates well with the steatosis between 6%-30% steatosis. LAI of less than -10 HU accurately predicts hepatic steatosis with greater than 30% micro-vesicular steatosis. Supplementary histological methods are needed to differentiate between a hepatic steatosis and the deposition of hemosiderin. Attenuation based methods fail to accurately depict steatosis due to averaging by hemosiderin, glycogen or copper. Therefore, CT based LAI is not completely reliable as a sole modality to exclude patients for hepatic transplantation.
Liver biopsy has a major limitation of lack of representation of sample to changes in the liver as a whole. Accuracy of liver sample for assessment of fat is questioned by various authors. Studies have shown significant variability even in closely spaced samples [17].
MRI has emerged as a reliable option for non-invasive estimation of liver fat. Varieties of MR techniques, like magnetic resonance spectroscopy, conventional in -phase and opposed phase imaging, conventional fat suppression imaging of liver fat and complex chemical shift based water-fat suppression methods have provided various options for assessing fat. Each methodology with its merits and limitations has been tried as practical options for estimation of liver fat. mDIXON is one MRI technique which evaluates fat fraction of the liver. This study was envisaged to validate mDixon MRI as an effective method of liver fat assessment and compare the results with earlier evaluation methods like liver fat estimation by CT and liver biopsy.
Materials and Methods
A prospective observational study was conducted at Imaging Services of Narayana Multispeciality Hospital between March 2011 to December 2012. The study was approved by the Institutional Review Body. 30 patients who attended gastroenterology clinic for non-hepatic complaints were included in the study. Group also consisted of liver donors. Written informed content was taken by all patients. Patients with known liver disease, cirrhosis, suspected steatosis, alcoholic liver disease were excluded from the study. Also patients with bleeding diatheses and claustrophobic patients were also excluded from the study. Clinical examination, estimation of body mass was recorded in all patients. All patients selected underwent screening sonographic evaluation of the abdomen, CT evaluation for estimation of fat (LAI) and subsequently MRI evaluation of the upper abdomen using the mDixon protocol. Within an interval of a week, patients had liver biopsy. Ultrasound observations were only utilised to exclude focal lesions and gross morphological changes. Results of liver attenuation index, estimated percentage of fat by MR method and histological grading were correlated. CT examination was performed with 64 detector-row helical scanner [VCT:GE Healthcare Wakesha, WI)] in 30 subjects. Contiguous axial images were acquired through the liver with 10 mm collimation during a single breath hold without intravenous contrast agent administration, prior to contrast enhanced study. The unenhanced CT images were retrospectively reviewed with an advanced workstation (Advantage 4 GE) by a radiologist, blinded to pathologic and surgical findings. For each case, liver attenuation was measured by 25 random circular Region of Interest (ROI), five each obtained from five cross sectional images. For each ROI, we selected the largest possible ROI and avoided areas of visible hepatic vascular and biliary structures to represent liver parenchymal attenuation. Our ROI’s ranged from 200 to 400 mm2. The ROI values were averaged as mean attenuation. Splenic HU obtained from three regions were measured as internal control. Largest possible ROI was obtained whenever possible (200-400 mm2). LAI was derived from the difference in mean hepatic and splenic attenuation.
MRI examination of liver was done with a 1.5 T Achieva MR system (Philips Healthcare, Netherlands) with a 4-element SENSE Body array receive coil was used. Anatomic imaging of entire upper abdomen was performed with axial, free-breathing single-shot Turbo Spin Echo (TSE) sequence. A commercially available version of mDIXON sequence package was used to acquire fat and water images of entire liver. The mDIXON technique combines a 2-point DIXON method with the implementation of flexible echo times. Following were the imaging parameters: 3D T1-FFE sequence, 2-echoes: TE1=1.8 msec, TE2=4.0 msec, TR=5.2 msec, Flip angle=15, SENSE parallel imaging with acceleration factor 2.0 in phase-encoding direction.
Breath-hold duration was 13.5 seconds, and a respiratory sensor was used to monitor compliance. Axial volume was acquired and 34 slices (6 mm each) were reconstructed with voxel size of 2.2 mm X 2.0 mm. Signal averages = 1. Auto B0 shim was performed over Field of View (FOV) per patient. The entire protocol lasted 15-20 minutes. Sequence optimization was done on normal volunteers (for the available 4-element RF coil). Signal-to-noise ratio, spatial resolution and breath-hold duration were optimized by varying the voxel size, SENSE factor, and Repetition Time (TR). Data for each 2-echo mDIXON sequence was reconstructed on the MR system using the available standard single-peak spectral model of fat. Each sequence yielded four images per slice: water only, fat only, in-phase, out-phase. From the DICOM “water” and “fat” images, a pixel-wise “signal fat-fraction” parameter map was generated as follows using an offline post-processing tool:
Where SI is the pixel signal intensity on the reconstructed fat and water images. Images were independently analysed by two radiologists, documenting direct reading of percentage of fat in all eight hepatic segments using an ROI of 200-300 mm. Also, larger 800-1600 mm2 measurements were documented for right and left lobe of liver. Care was taken to select only representative regions and avoiding blood vessels or region with artefacts. Biopsy samples consisted of total 61 samples 31 from right lobe (17 from segment 7, 14 from segment 8); 30 from left lobe (segment 3 or 4) of liver obtained with true-cut gun during open surgery. One patient had two samples from right lobe. Histological grading consisted of 0-4 grades, by demonstration of fat vesicles in the field of view according to the well established method. Liver biopsy was scored using the NASH-CRN [18] histological scoring system. Liver samples were graded as 0-2 for hepatocellular balooning, 0-3 for steatosis, lobular inflammation and 0-4 for fibrosis. NAFLD Activity Score (NAS) was derived from first three components, ranges from 0-8. Fibrosis is considered characteristic of cirrhosis as per NASH-CRN histological scoring system [18,19]. All the samples were reviewed by a single blinded observer.
Statistical Analysis
The statistical analysis was performed by SPSS. Pearson correlation was used to find the correlation between the left and right lobe of liver segments by CT and histological correlation.
Continuous variables of age, BMI, liver segment and right and left lobes were expressed as mean and standard deviation and range. Gender was expressed as frequency and percentage.
Student’s t-test was used to find the significant difference between the right and left lobe with CT and MRI findings. The p-value<0.05 was considered as statistically significant. Inter-observer intra class correlation was measured with Bland-Altman curve with output expressed with 95% confidence interval.
Results
Study group consisted of 23 males and seven females. Patients were aged between 24-63 years with a mean of 46 years. Body-mass index varied between 18-28 kg/m2, with a mean of 24 kg/m2. Liver Fat Index (LFI) of right lobe varied between -15 to 9. Values for the left lobe varied between -3 to 9. Large majority of the patient had values between 5-10 HU (93%) for right lobe and 87% of the left lobe. There was no significant correlation between age groups, gender or BMI and the estimated liver fat. MRI evaluation of the liver fat revealed fat content variation from 5.5% to 24.7% for right lobe and 5% to 23% for the left lobe of liver [Table/Fig-1].
Table showing demographic characters and correlation between liver histology, CT and novel magnetic resonance imaging method (mDIXON) in our patients.
| Parameter | Overall(n=30) | CT | MRI | Histology |
|---|
| Age * | 46.56± 10 | | | |
| Gender- Male | 23 (77%) | | | |
| Female | 7 (23%) | | | |
| BMI | 24.26± 2.3 | | | |
| Right lobe- mean | | 1.1(-15 to 9) | 6.3 (5.5-24.7) | <5% |
| Left lobe-mean | | 1.3 (-3 to 9) | 8.5 (5-23) | <5% |
| Liver seg 1 | | | 9.1 | <5% |
| Liver seg 2 | | | 7.4 | <5% |
| Liver seg 3 | | | 7.6 | <5% |
| Liver seg 4 | | | 6.4 | <5% |
| Liver seg 5 | | | 6.1 | <5% |
| Liver seg 6 | | | 6.6 | <5% |
| Liver seg 7 | | | 6.0 | <5% |
| Liver seg 8 | | | 4.8 | <5% |
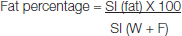
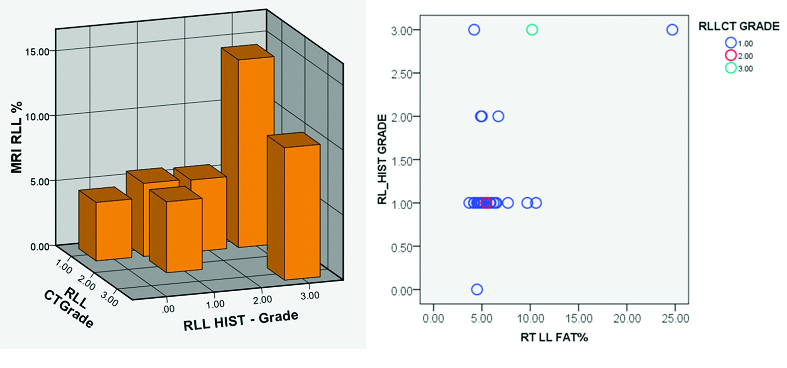
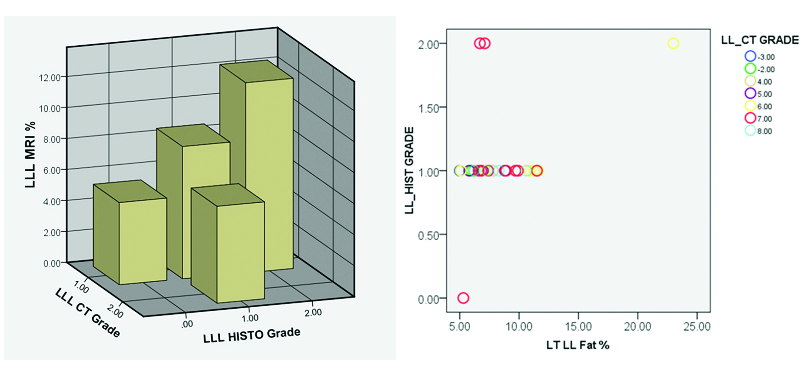
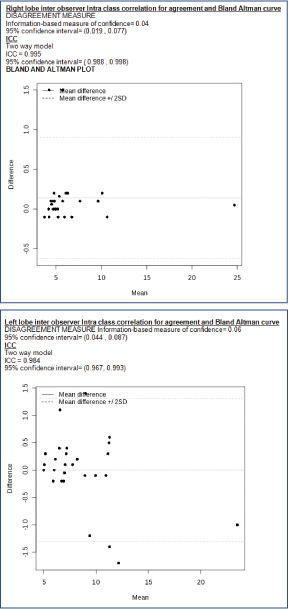
MR and CT images of ROI measurements in patient with high fat content (histologically) [Table/Fig-2a] and one with low fat values [Table/Fig-2b] are illustrated. Segments of the liver showed heterogeneity in the values although not statistically significant. Size of the ROI in relation to the segment evaluated was critical in getting more consistent results. On analysis there was significant correlation between the LAI of the right lobe and percentage of fat on histology {t=0.396(30)}, p=0.03, however no significant correlation is noted for the left lobe {t =-.073(30)}, p=0.7. Also, no significant correlation was noted between the calculated fat percentage by CT and MR. There was significant correlation between estimated fat by MRI and histology for both left and right lobe (LLL p=0.4, p=0.03, RLL p=0.51 p=0.004) [Table/Fig-3,4]. Significant correlation of fat estimation of right lobe was possible by CT as well as MRI (p=0.013). There was good inter-observer agreement in MR readings for assessment of both lobes. On analysis with Bland -Altman curve there was very high ICC closer to one with a narrow confidence limit, showing that the two observers more or less reported the same values (ICC=0.995 for right lobe and ICC=0.984 for the left lobe) [Table/Fig-5]. MR evaluation of individual segments of the liver revealed, segment 7 showed most linear correlation with the histological assessment (p=0.03).
a) Axial MRI (mDIXON) and CT section of the liver showing location of region of interest (ROI 1,2) in right and left lobes and mesentery (ROI 3). MR images provide direct measurement of fat percentage. CT LAI index is mean of averaged multiple values. A table of MR, CT values and histology in patient with high fat (<66%) is shown; b) Grey scale and colour coded fat maps in a patient with 4% liver fat.
Distribution of fat in right lobe of liver segments by CT and histological correlation. chart, representative 3-D bar diagram and scatter graph.
| Correlations |
|---|
| Test used | RLLCT | RL_HIST | Liv5 | Liv6 | Liv7 |
|---|
| RLLCT | Pearson Correlation | 1 | 0.396* | -0.014 | 0.101 | 0.022 |
| Sig. (2-tailed) | | 0.030 | 0.942 | 0.594 | 0.909 |
| N | 30 | 30 | 30 | 30 | 30 |
| RL_HIST | Pearson Correlation | 0.396* | 1 | 0.460* | 0.512** | 0.458* |
| Sig. (2-tailed) | 0.030 | | 0.011 | 0.004 | 0.011 |
| N | 30 | 30 | 30 | 30 | 30 |
| Liv5 | Pearson Correlation | -0.014 | 0.460* | 1 | 0.966** | 0.942** |
| Sig. (2-tailed) | 0.942 | 0.011 | | <0.001 | <0.001 |
| N | 30 | 30 | 30 | 30 | 30 |
| Liv6 | Pearson Correlation | 0.101 | 0.512** | 0.966** | 1 | 0.958** |
| Sig. (2-tailed) | 0.594 | 0.004 | <0.001 | | <0.001 |
| N | 30 | 30 | 30 | 30 | 30 |
| Liv7 | Pearson Correlation | 0.022 | 0.458* | 0.942** | 0.958** | 1 |
| Sig. (2-tailed) | 0.909 | 0.011 | 0.000 | 0.000 | |
| N | 30 | 30 | 30 | 30 | 30 |
| Liv8 | Pearson Correlation | -0.062 | 0.406* | 0.926** | 0.914** | 0.961** |
| Sig. (2-tailed) | 0.746 | 0.026 | <0.001 | <0.001 | <0.001 |
| N | 30 | 30 | 30 | 30 | 30 |
| RT | Pearson Correlation | 0.152 | 0.510** | 0.938** | 0.960** | 0.956** |
| Sig. (2-tailed) | 0.422 | 0.004 | <0.001 | <0.001 | <0.001 |
| N | 30 | 30 | 30 | 30 | 30 |
 |
*. Correlation is significant at the 0.05 level (2-tailed).
**. Correlation is significant at the 0.01 level (2-tailed).
*HIST – Histology, CT – Computed tomography, MRI – Magnetic resonance imaging, RLL – Right lobe of liver, Liv= Liver
Distribution of fat in left lobe of liver segments by CT and histological correlation. chart, representative 3-D bar diagram and scatter graph.
| Correlations |
|---|
| | LL_HIST | LLCT | Liv2 | Liv3 | Liv4 | @LT |
|---|
| LL_HIST | Pearson Correlation | 1 | -0.073 | 0.309 | 0.449* | 0.446* | 0.402* |
| Sig. (2-tailed) | | 0.702 | 0.132 | 0.015 | 0.015 | 0.031 |
| N | 30 | 30 | 25 | 29 | 29 | 29 |
| LLCT | Pearson Correlation | -0.073 | 1 | -0.344 | -0.316 | -0.236 | -0.263 |
| Sig. (2-tailed) | 0.702 | | 0.092 | 0.095 | 0.217 | 0.169 |
| N | 30 | 30 | 25 | 29 | 29 | 29 |
| Liv2 | Pearson Correlation | 0.309 | -0.344 | 1 | 0.896** | 0.868** | 0.838** |
| Sig. (2-tailed) | 0.132 | 0.092 | | <0.001 | <0.001 | <0.001 |
| N | 25 | 25 | 25 | 25 | 24 | 25 |
| Liv3 | Pearson Correlation | 0.449* | -0.316 | 0.896** | 1 | 0.870** | 0.895** |
| Sig. (2-tailed) | 0.015 | 0.095 | <0.001 | | <0.001 | <0.001 |
| N | 29 | 29 | 25 | 29 | 28 | 29 |
| Liv4 | Pearson Correlation | 0.446* | -0.236 | 0.868** | 0.870** | 1 | 0.832** |
| Sig. (2-tailed) | 0.015 | 0.217 | <0.001 | <0.001 | | <0.001 |
| N | 29 | 29 | 24 | 28 | 29 | 28 |
| @LT | Pearson Correlation | 0.402* | -0.263 | 0.838** | 0.895** | 0.832** | 1 |
| Sig. (2-tailed) | 0.031 | 0.169 | <0.001 | <0.001 | <0.001 | |
| N | 29 | 29 | 25 | 29 | 28 | 29 |
 |
*. Correlation is significant at the 0.05 level (2-tailed).
**. Correlation is significant at the 0.01 level (2-tailed).
HIST – Histology, CT – Computed tomography, MRI – Magnetic resonance imaging, LLL – Left lobe of liver, Liv= Liver
Graph showing inter-observer agreement in MR readings for assessment of both lobes.
Discussion
Non-invasive estimation of liver fat is extremely crucial for patient selection for organ donation. Amongst existing methods, MRI is the most accurate methodology for liver fat estimation. CT technique, by LAI, correctly predicts the degree of micro-vesicular steatosis in 90% of the patients [8]. LAI values between – 10 to 5 HU correctly predicted hepatic steatosis in 6%-30%. LAI greater than 5 HU excludes hepatic steatosis in 95%. Despite acceptable accuracy, CT methods do not preclude the liver biopsy in patients with a low LAI. Radiation associated with CT is an additional undesirable aspect. DIXON MR techniques and spectroscopy are utilised for liver fat estimation. In MR techniques exploit the difference in precession frequencies of fat and water to decompose the MR signal into fat and water signal components. Advanced magnitude-based and complex chemical shift based MRI fat quantification techniques have been developed. “Proton Density Fat Fraction” (PDFF) defined as the proportion of mobile proton density in liver tissue attributable to fat is used as a non-invasive biomarker of liver fat content. These techniques use a low flip angle (relative to repetition time) to minimize T1 bias. They also acquire multiple echoes per excitation to permit correction for T2* effects, and address the multi-frequency interference effects of fat.
Original DIXON technique requires time-consuming acquisition of in-phase and out-phases gradient echo images [20]. These are then added to get “water-only images”, and subtracted to get “fat-only” images. The sequence has limited possibilities to simultaneously optimize for spatial resolution, slice thickness, and ability to acquire data in a single breath-hold for liver imaging.
The modified DIXON (m DIXON) technique, utilised in this study has the technical advantage of short acquisition time and superior spatial resolution [21]. Results from this technique also correlates well with MRI fat fraction calculated by DIXON/IOP method for fat assessment in adult and paediatric patients with NAFLD [3,12,15]. MR Spectroscopy (MRS) although an accurate method to determine “proton density fat fraction requires long acquisition time, has sampling errors and estimate PDFF from one location [22-28]. mDIXON techniques, on the other hand, can estimate PDFF from multiple sections covering the entire liver in a short breath-hold period of just 15-20 seconds [20]. Many conventional MR techniques for fat assessment have intrinsic limitations like T1 bias or T2 decay or frequency interfering effects due to protons in fat.
Our observations regarding the accuracy of estimation of fat in segments of liver, are consistent with the outcome of many other observers [1, 2, 27, 28]. Estimation of right lobe liver fat showed good correlation between CT and MR technology whereas there was no significant correlation in the evaluation of the left lobe. MRI showed more significant histological correlation compared to the CT, in evaluation of both lobes. Evaluation of the liver fat in individual sub segments showed slight variation in the values which were not statistically significant. Among the liver segment, most accurate correlation with histology was observed with segment seven. Thus, individual values of other segments did not significantly improve to the accuracy of overall interpretation. Estimation by a large ROI of right and left lobe of liver appeared to correlate much better with histological correlation as against individual sub-segments. It is of interest observe the inverse relationship between advanced fibrosis and degree of hepatic steatosis as documented in the literature [3]. Development of a stage 4 histological changes, characterised by fibrosis lead to decreased fat content in patients with NAFLD.
Earlier MR studies using PDFF and histology-determined steatosis shows significant inverse correlation with fat fraction in the advanced disease state. Findings are further substantiated by altered biochemical profile as reflected by higher GGT, AST to ALT ratio, INR as well as liver histology [15]. Thus, interpretation of the significance of liver fat on MRI for patient management should be considered in the context of clinical disease and extent of fibrosis. Large majority of our patients showed hepatic fat content of 5%-10%. We had very few patients with extreme values.
Limitation
Our results are expected in view of selected study sample. Thus, results should be further validated with larger sample volume consisting patients with normal liver fat as well as patients with liver disease. Another important study restriction is the location of histology, most of the liver biopsy samples are taken from segment 7 or 8. Hence, direct correlation is possible with only one or two biopsy segments. Thus, interpretation and correlation of fat in rest of the segment is presumptive. In view of lack of feasibility of multiple liver samples, it appears prudent to assume the accuracy of study based on biopsied segments. As regards MR technique the limitation in our study is that we have only used basic techniques available to us a 2-point mDIXON technique for data acquisition and a standard single-peak spectral model of fat for image reconstruction. Since factors confounding the fat measurement (T bias, T2* decay, spectral complexity of fat etc.), have not been addressed, our measurement represents the “signal fat-fraction”, not a true “proton density fat-fraction”.
Conclusion
Our study confirms the previous observation of superiority of MR assessment of liver fat over CT technique. MR mDixon technology of fat estimation is not only more accurate in terms of the histological correlation but also showed more linear correlation with percentage of fat. Also, interpretation of the results, directly expressed as percentage of fat in the selected ROI is much easier for evaluation of various segments of the liver. Estimation of the left lobe of the liver was technically difficult due to anatomical variations. Even in left lobe evaluation MRI was clearly superior to CT. Both techniques had consistent results for estimation of fat with regions are and further correlation with the histological grading. Finally, ease of use, short study time, accuracy of results and radiation safety, MRI evaluation of liver scores over the CT technique for liver fat estimation.
Disclaimer: Dr VKS* was an employee of Philips innovation campus, Bengaluru, at the time of the study. However, there is no conflict of interest with the parent institution as the study was done jointly by Narayana health and Philips India under an MOU. Dr VB, the corresponding author, is responsible for the accuracy of the data.
*. Correlation is significant at the 0.05 level (2-tailed).
**. Correlation is significant at the 0.01 level (2-tailed).
*HIST – Histology, CT – Computed tomography, MRI – Magnetic resonance imaging, RLL – Right lobe of liver, Liv= Liver
*. Correlation is significant at the 0.05 level (2-tailed).
**. Correlation is significant at the 0.01 level (2-tailed).
HIST – Histology, CT – Computed tomography, MRI – Magnetic resonance imaging, LLL – Left lobe of liver, Liv= Liver