Introduction
Macular disease is the leading cause of low vision in the Western world. Drusen and pigmentary irregularities are common among the rural Northern Indian population. The disease process leads to loss of central vision, metamorphopsia, macropsia or micropsia and colour vision defect.
Aim
To study the retinal sensitivity changes in macular diseases using microperimetry.
Materials and Methods
It was an observational study, conducted in the Department of Ophthalmology at a rural tertiary care hospital. This study was started from December 2014 until June 2016, in all patients with macular disease above the age of 20 years attending the outpatient department. Microperimetry was done for 84 eyes of 52 patients with macular disease. Mean retinal Sensitivity (MS) and fixation stability was evaluated. The statistical analysis of mean retinal sensitivity, central 2° and 4° fixation was done by calculating the mean and standard deviation using 95% confidence interval.
Results
The range of age was between 20-81 years. Majority were 32 males (62%) and 20 females (38%). Out of the 84 eyes studied, majority of the macular disease were Age-Related Macular Degeneration (AMD) (50%). Rest 50% were other macular diseases. The mean retinal sensitivity (dB) shown by microperimetry was 10.83 in AMD, 9.12 in Cystoid Macular Oedema (CME), 10.34 in Epiretinal Membrane (ERM), 10.74 in Pigment Epithelial Detachment (PED), 8.96 in Central Serous Chorioretinopathy (CSCR), 6.43 in macular dystrophy, 7.15 in Lamellar Hole (LMH), 9.8 in Pseudomacular Hole (PMH), 3 in geographic atrophy, 11.1 in macular telangiectasia, 5.6 in Berlin oedema, 12.3 in macular scar and 15.2 in haemorrhage in macula. The study showed 64% of the eyes had stable 2° central fixation, 35% had relatively unstable fixation and 1% had unstable fixation. No significant correlation between retinal sensitivity and retinal thickness in AMD was found.
Conclusion
This study shows that microperimetry can be a useful tool for objective evaluation of macular function and progression of the disease.
Introduction
Macular disease causes impairment of central vision, metamorphopsia, macropsia, micropsia and colour vision defect [1,2].
In 2010, 2.1 million people were blind and 6.0 million people were visually impaired due to macular disease. Of every 15 blind people, one was blind due to macular disease, and of every 32 visually impaired people, one was visually impaired due to macular disease [3]. In a recent study showed that globally, in 1990 and 2010, the leading cause of blindness were cataract and undercorrected refractive error, with marked differences among the world’s regions. A macular disease ranked third in position in causing blindness, with profound differences in the two leading cause [1,4]. Macular degeneration is the leading cause of low vision in the Western world [5]. Macular disease leads to loss of central vision, which causes difficulty in daily activities, especially reading [5]. Drusen and pigmentary abnormalities are common among the rural Northern Indian population. The prevalence of late Age Related Macular Degeneration (AMD) is similar to Western world and is likely to contribute to the burden of vision loss in older people in the developing world [6].
There are various methods for the assessment of macula. It is divided into two groups: psychophysical tests and electrophysiological test. Psychophysical tests are visual acuity, colour vision, Amsler grid, photostress test, two point discrimination test, entoptic imagery, maddox rod test, foveal flicker sensitivity, grating psychophysics, laser interferometry, the potential visual acuity meter, dark adaptometry, microperimetry. The electrophysiologic tests are Electroretinography (ERG), Electrooculography (EOG) and Visual Evoked Potential (VEP).
Microperimetry is a procedure to assess retinal sensitivity while fundus is directly examined; it enables exact correlation between macular pathology and corresponding functional abnormality [7]. It is a psychophysical method which is rapid, safe and non-invasive [8]. Early macular function loss in intermediate AMD can be precisely detected by microperimetry before significant visual impairment is established. It is useful for demonstrating the stability of fixation and shift in the localization prior to progression of intermediate AMD to advanced and exudative stage [9]. It has become a common way to measure macular function in assessment of natural history and treatment outcome in macular disease [10].
The microperimetry technology has rapidly progressed over the past 30 years. The first microperimeter was manufactured by Rodenstock Instruments (Munich, Germany) under the name of scanning laser ophthalmoscope (SLO101) and became available in 1982 [11]. It had no eye-track system and the inconvenience of semi-automated stimulus presentation [11]. In 2003, Nidek Technologies (Padova, Italy) introduced the Micro Perimeter 1 (MP-1) that uses a Liquid Crystal Display (LCD) to project the stimuli, SLO scans for fundus observation, a fundus camera to capture fundus images and automated real-time fundus tracking [12]. The device was the first to employ a true eye-track system. Three years later, OPKO/OTI (OPKO Instrumentation, Miami, FL) also introduced its new microperimeter, the spectral optical coherence tomography (Spectral OCT)/SLO, which offers the advantage of correlating functional deficits not only with SLO infrared images (retinal en face images), but also with bi-dimensional, cross-sectional OCT retinal images [13]. Microperimetry utilise a background luminance of 10 cd/m2, maximum stimulus intensity of 125 cd/m2 stimulus size of 0.11-1.73 degrees (Goldmann I-V), white stimulus colour, 0-20 dB dynamic range, 29° fundus image field of view [14].
The aim of this study was to evaluate macula with microperimetry in macular diseases.
Materials and Methods
This observational study was conducted in a rural tertiary care hospital after getting approved by the Institutional Medical Ethical Committee. Sample size was determined by using the formula:

where, p=0.0625
Z α/2 = 1.96
d = 0.05
All patients diagnosed with macular disease above the age of 20 years attending the outpatient department of Ophthalmology between December 2014 and June 2016 participated in this study.
Written informed consent was obtained from the patients and ophthalmic examination was done.
Patients with any media opacities, systemic disorders (including diabetes mellitus), patients on systemic medications that can affect visual function (chloroquine), glaucoma, optic neuropathies, patients with severe visual impairment of <2/60, patients with nystagmus, hearing impairment and attention disorder were excluded.
Detailed history regarding the ocular complaints, systemic diseases, family history and previous medical and surgical history was taken.
A thorough ophthalmic examination was done which included recording of visual acuity by Snellen chart, intra ocular pressure measurement by Goldmann’s applanantion tonometry, anterior segment examination by slit lamp, Amsler grid, colour vision, cycloplegic refraction, fundus examination by +78D/+90D slit lamp biomicroscopy, spectral domain optical coherence tomography and microperimetry using Spectral OCT SLO Microperimeter (Optos).
Spectral domain optical coherence tomography scans were performed in all eyes through dilated pupil. Microperimetry was performed in all study subjects under mydriatric state using Goldmann size III stimuli, 4-2 staircase threshold strategy, using Square 5×5 -9° pattern. An automated program was used and 25 stimuli were projected in the central 9° of fundus in a 5 x 5 square pattern [Table/Fig-1]. The stimuli were projected one at a time with duration of stimuli being 200 ms against a white background with an illumination of 1.27 cd/m2, and the subject was asked to respond to every stimulus seen by him by pressing a hand-held button while the subject concentrates at the centre target. Patient’s eyes were dilated. Testing was performed uniocularly. The following parameters were calculated from the microperimetric output and analysed: 1) mean sensitivity (dB); 2) fixation quality as measured by percentage of tracked fundus positions lying within 2° and 4° circle centered at the point of fixation. An 18 dB is considered as normal retinal sensitivity according to a study by Gella L et al., [15]. Fixation characteristics were measured according to Fujii GY et al., [16]. Fixation is defined as “stable” when 75% of fixations fall within the 2° circle, “relatively unstable” when 75% of fixations fall within the 4° circle, and “unstable” when <75% of fixations fall within the 4° circle. All the above parameters were taken into consideration and were analysed.
Microperimetry performed in the central 9° with 25 stimulus points.

Statistical Analysis
Statistical analysis were performed by the statistical package namely IBM SPSS statistics 20.0. The study subjects were described according to their demographic profiles such as age, gender in terms of percentages and standard deviation. The analysis of mean retinal sensitivity, central 2° and 4° fixation was done by calculating the mean and standard deviation using 95% confidence interval. Correlations were calculated between retinal thickness, retinal volume and retinal sensitivity using bivariate parametric Pearson correlations.
Results
The range of age was 20-81 years. Eighty four eyes of 52 patients with macular diseases were included in this study.
Among the 52 patients, 14 eyes had normal fundus, four eyes had media opacity and two eyes had significant fixation loss, so microperimetry could not be performed. Microperimetry was performed and parameters were analysed. [Table/Fig-2] shows the analysis of the retinal sensitivity with 95% confidence interval. The mean retinal sensitivity of all the patients with macular disease had significant decreased retinal sensitivity.
Analysis of the retinal sensitivity.
| Sl. No. | Diseases | Number of eyes (n=84) (%) | Mean retinal sensitivity±SD (normal=18 dB) | 95% CI |
|---|
| Lower | Upper |
|---|
| 1 | Age-related macular degeneration (AMD) | 42 (50%) | 10.83±3.79 | 9.65 | 12.01 |
| 2 | Cystoid macular oedema (CME) | 8 (10%) | 9.12±2.81 | 7.17 | 11.07 |
| 3 | Epiretinal membrane (ERM) | 7 (8%) | 10.34±3.82 | 7.51 | 13.17 |
| 4 | Pigment epithelium detachment (PED) | 6 (7%) | 10.74±3.37 | 8.04 | 13.44 |
| 5 | CSCR | 6 (7%) | 8.96±3.25 | 5.55 | 12.37 |
| 6 | Macular dystrophy | 7 (8%) | 6.43 | 0.55 | 12.30 |
| 7 | Lamellar macular hole | 2 (2%) | 7.15 | |
| 8 | Pseudomacular hole | 1 (1%) | 9.8 | |
| 9 | Geographic atrophy | 1 (1%) | 3 | |
| 10 | Macular telengiectasia | 1 (1%) | 11.1 | |
| 11 | Berlin oedema | 1 (1%) | 5.6 | |
| 12 | Macular scar | 1 (1%) | 12.3 | |
| 13 | Haemorrhage in macula | 1(1%) | 15.2 | |
Fixation assessment [Table/Fig-3] shows that half of the AMD eyes were found to have stable fixation. Fixation quality was found to be decreased in eyes with decreased sensitivity. Out of 84 eyes, 54 eyes (64%) had stable fixation, relatively unstable fixation in 29 eyes (35%) and unstable fixation in one eye.
Fixation stability of the eyes.
| Sl. No. | Disease | No. of eyes with stable fixation (n=54) | No. of eyes with relatively unstable fixation (n=29) | No. of eyes with unstable fixation (n=1) |
|---|
| 1 | AMD | 28 | 14 | Nil |
| 2 | CME | 4 | 4 | Nil |
| 3 | ERM | 3 | 4 | Nil |
| 4 | PED | 5 | 1 | Nil |
| 5 | CSCR | 5 | Nil | 1 |
| 6 | Macular dystrophy | 3 | 4 | Nil |
| 7 | Lamellar macular hole | 1 | 1 | Nil |
| 8 | Pseudo-macular hole | 1 | Nil | Nil |
| 9 | Geographic atrophy | 1 | Nil | Nil |
| 10 | Macular telangiectasia | 1 | Nil | Nil |
| 11 | Berlin oedema | 1 | Nil | Nil |
| 12 | Macular scar | Nil | 1 | Nil |
| 13 | Haemorrhage in macula | 1 | Nil | Nil |
*AMD-Age-related macular degeneration, CME-Cystoid macular oedema, ERM-Epiretinal membrane, PED-Pigment epithelial detachment, CSCR-Central serous chorioretinopathy.
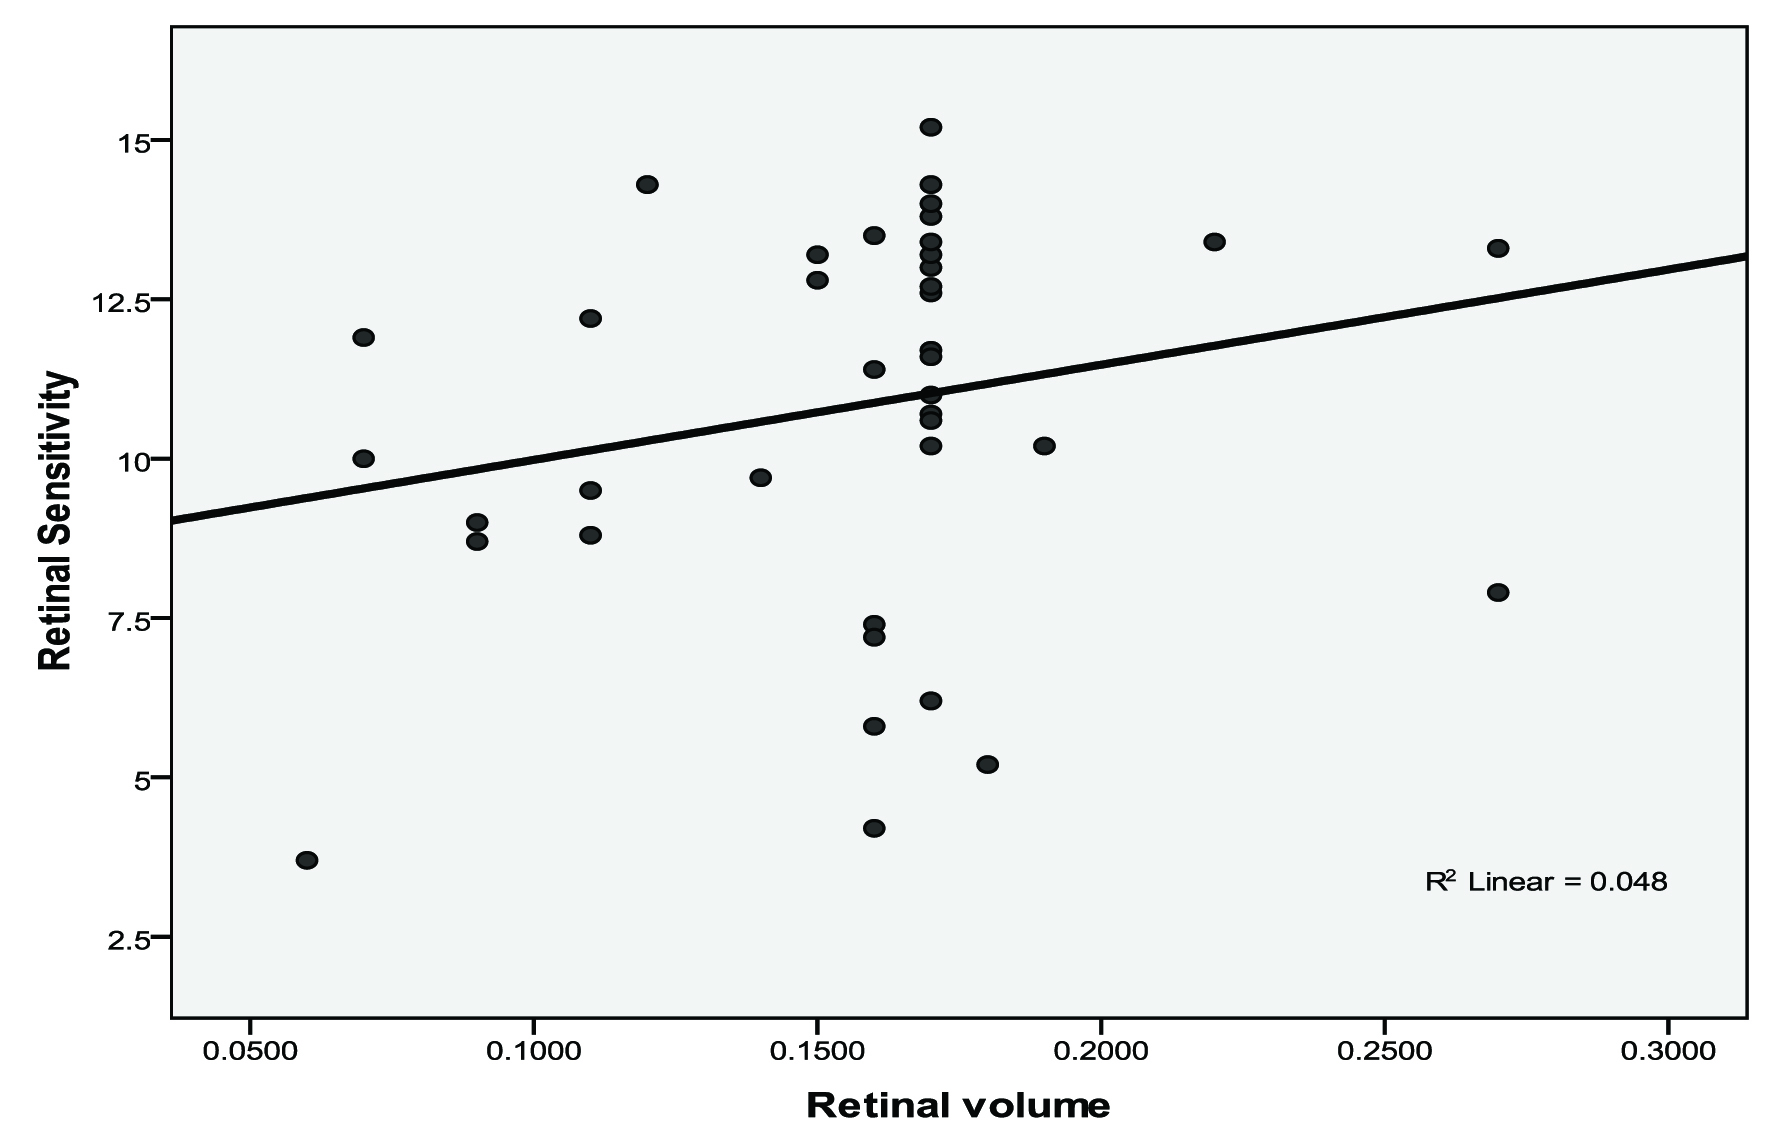
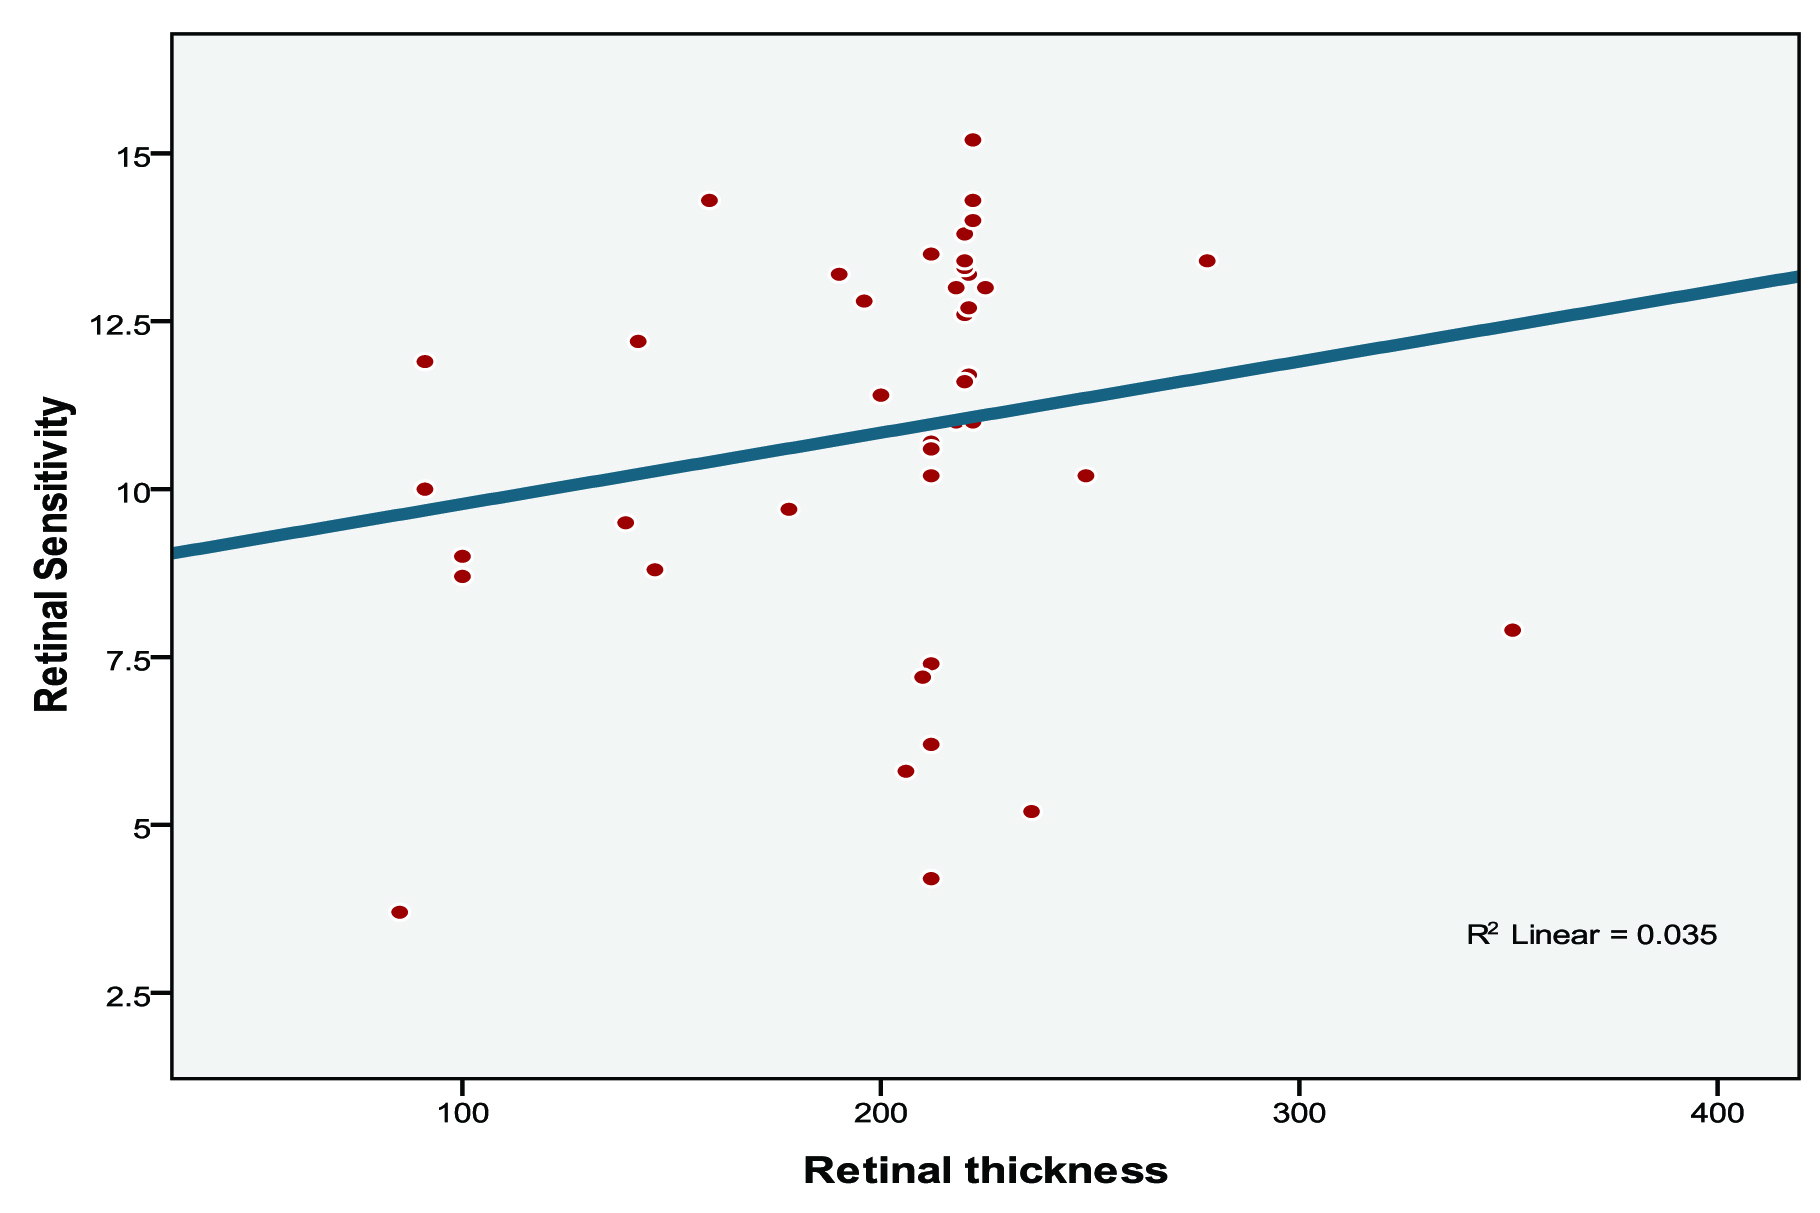
Correlations were calculated between retinal sensitivity, retinal thickness and retinal volume in AMD subjects [Table/Fig-4]. We found that correlation between retinal volume and retinal sensitivity was not significant (r=0.219, p=0.163) [Table/Fig-5] and correlation between retinal thickness and retinal sensitivity was also not significant (r=0.187, p=0.236) [Table/Fig-6].
Correlations analysis between microperimetry and spectral domain optical coherence tomography parameters of AMD subjects.
| Variables | Tests used | Retinal sensitivity | Retinal thickness | Retinal volume |
|---|
| Retinal sensitivity | Pearson Correlation | 1 | 0.187 | 0.219 |
| Sig. (2-tailed) | | 0.236 | 0.163 |
| N | 42 | 42 | 42 |
| Retinal thickness | Pearson Correlation | 0.187 | 1 | 0.930** |
| Sig. (2-tailed) | 0.236 | | <0.001 |
| N | 42 | 42 | 42 |
| Retinal volume | Pearson Correlation | 0.219 | 0.930** | 1 |
| Sig. (2-tailed) | 0.163 | <0.001 | |
| N | 42 | 42 | 42 |
** Correlation is significant at the 0.01 level (2-tailed).
Scatter diagram showing retinal volume (mm3) and retinal sensitivity (dB) in AMD subjects.
Scatter diagram showing retinal thickness (microns) and retinal sensitivity (dB) in AMD subjects.
Out of 84 eyes, eight had Amsler distortion. Two eyes with CSCR, two eyes with stargardt disease and one eye with macular telangiectasia had metamorphopsia. Three eyes with CSCR had central scotoma. The mean retinal sensitivity in eyes with Amsler distortion was reduced (7.42 dB) as compared to the eyes with no Amsler distortion (13.8 dB).
Discussion
Microperimetry examination of the macula is an ideal tool to assess the retinal sensitivity and the fixation behaviour in patients with macular diseases. It has become a common way to measure macular function in assessment of natural history and treatment outcome in macular disease.
Retinal sensitivity was found to be reduced over discrete areas of lesions such as drusen and pigmentary changes, similar to the studies done by Hartmann KI et al., Parisi V et al., Midena E et al., [17-19]. The mean retinal sensitivity of AMD eyes was similar to the study done by Dinc UA et al., and Nowomiejska K et al., [9,20].
Retinal sensitivity was reduced in eyes with ERM which was similar to a study done by Dal Vecchio M et al., [21]. In eyes with CME showed decreased mean retinal sensitivity, which was much less than in the study done by Munk MR et al., [22].
In our study, fixation was “stable” in more than half of the eyes with AMD which was similar to the study done by Dinc UA et al., [9]. It was found that fixation stability in ERM was “stable” in only three eyes and the remaining four eyes had “relatively unstable fixation” and no eyes had “unstable fixation”. The proportion of “unstable fixation” was high in the study done by Görgün E et al., which is in contrast to this study [23].
In a study done by Ozdemir H et al., retinal sensitivity was found to be reduced in CSCR patients with stable fixation which is similar to this study [24].
It was found that eyes with stargardt disease had “relative unstable fixation” with central fixation which is contrast to the study done by Janet S et al., where the eyes fixate superior to the central lesion on the retina [25] and another study by Testa F et al., [26] which showed an “unstable fixation”. The retinal sensitivity was found to be less in eyes with Amsler grid distortion. We found no significant correlation between retinal sensitivity, retinal thickness and retinal volume.
Limitation
The limitations of our study include small sample size, follow-up of the patients was not done and hence a progression analysis could not be performed.
Conclusion
Microperimetry can be a useful tool for evaluation of macular function. It shows that the macular area affected by a disease has significant loss of sensitivity. The use of microperimetry in the assessment and diagnosis of macular disease showed it is a promising tool to enhance the understanding of macular disease and assessment of future and existing treatment.
*AMD-Age-related macular degeneration, CME-Cystoid macular oedema, ERM-Epiretinal membrane, PED-Pigment epithelial detachment, CSCR-Central serous chorioretinopathy.
** Correlation is significant at the 0.01 level (2-tailed).
[1]. Wiecek E, Lashkari K, Dakin SC, Bex P, Prevalence, patterns and repeatability of metamorphopsia in macular disease: a statistical analysis of 7,106 Amsler gridsOphthalmology 2015 122(2):431-33. [Google Scholar]
[2]. Minato H, Color vision defects of macular diseasesNippon ganka Gakkai Zasshi 1991 95(4):354-62. [Google Scholar]
[3]. Jonas JB, Bourne RR, White RA, Flaxman SR, Keeffe J, Leasher J, Vision Loss Expert Group of the Global Burden of Disease Study. Visual impairment and blindness due to macular diseases globally: a systematic review and meta-analysisAm J Ophthal Am J Ophthalmol 2014 158(4):808-15. [Google Scholar]
[4]. Bourne R, Stevens GA, White RA, Smith JL, Flaxman SR, Price H, Causes of global visual loss:1990-2010. The global burden of disease studyLancet Global Health 2013 1(6):e339-49. [Google Scholar]
[5]. Hazel CA, Petre KL, Armstrong RA, Benson MT, Frost NA, Visual function and subjective quality of life compared in subjects with acquired macular diseaseInvestigative Ophthalmology & Visual Science 2000 41:1309-15. [Google Scholar]
[6]. Gupta SK, Murthy GV, Morrison N, Price GM, Dherani M, John N, Prevalence of early and late age-related macular degeneration in a rural population in Northern India: the INDEYE feasibility studyInvest Ophthalmol Vis Sci 2007 48(3):1007-11. [Google Scholar]
[7]. Ratra V, Ratra D, Gupta M, Vaitheeswaran K, Comparison between humphrey field analyser and microperimeter 1 in normal and glaucoma subjectsOman Journal of Ophthalmology 2012 5(2):97-102. [Google Scholar]
[8]. Squirrell D, Ehrlich R, The use of macular microperimetry in the assessment and diagnosis of macular diseaseRetinal Physician 2012 9:53-57. [Google Scholar]
[9]. Dinc UA, Yeneral M, Gorgun E, Oncel M, Assessment of macular function by microperimetry in intermediate age-related macular degenerationEur J Ophthal 2008 18(4):595-600. [Google Scholar]
[10]. Chen FK, Patel PJ, Xing W, Bunce C, Egan C, Tufail AT, Test–retest variability of microperimetry using the nidek MP1 in patients with macular disease investOphthalmol Vis Sci 2009 50(7):3464-72. [Google Scholar]
[11]. Rohrschneider K, Fendrich T, Becker M, Krastel H, Kruse FE, Volcker HE, Static fundus perimetry using the scanning laser ophthalmoscope with an automated threshold strategyGraefes Arch Clin Exp Ophthalmol 1995 233:743-49. [Google Scholar]
[12]. Midena E, Vujosevic S, Cavarzeran F, Normal values for fundus perimetry with the microperimeter MP1Ophthalmology 2010 117:1571-76. [Google Scholar]
[13]. Anastasakis A, McAnany JJ, Fishman GA, Seiple WH, Clinical value, normative retinal sensitivity values, and intrasession repeatability using a combined spectral domain optical coherence tomography/scanning laser ophthalmoscope microperimeterEye (Lond) 2011 25:245-51. [Google Scholar]
[14]. Liu H, Bittencourt MG, Wang J, Sophie R, Annam R, Ibrahim MA, Assessment of central retinal sensitivity employing two types of microperimetry devicesTVST 2014 3(5):3 [Google Scholar]
[15]. Gella L, Nittala MG, Raman R, Retinal sensitivity in healthy Indians using microperimeterIndian J Ophthalmol 2014 62(3):284-86. [Google Scholar]
[16]. Fujii GY, De Juan E, Humayan MS, Sunness JS, Chang TS, Rossi JV, Characteristics of visual loss by scanning laser ophthalmoscope microperimetry in eyes with subfoveal choroidal neovascularization secondary to age-related macular degenerationAm J Ophthalmol 2003 136:1067-78. [Google Scholar]
[17]. Hartmann Kl, Bartsch DU, Cheng L, Kim JS, Gomez ML, Klein H, Scanning laser ophthalmoscope imaging stabilized microperimetry in dry age-related macular degenerationRetina 2011 31(7):1323-31. [Google Scholar]
[18]. Parisi V, Perillo L, Tedeschi M, Scassa C, Gallinaro G, Capaldo N, Macular function in eyes with early age-related macular degeneration with or without contralateral late age-related macular degenerationRetina 2001 27(7):879-90. [Google Scholar]
[19]. Midena E, Vujosevic S, Convento E, Manfre A, Cavazeran F, Pilotto E, Microperimetry and fundus autofluorescence in patients with early age-related macular degenerationBr J Ophthalmol 2007 91:1499-503. [Google Scholar]
[20]. Nowomiejska K, Oleszczuk A, Zubilewicz A, Krukowski A, Mankowska A, Rejdak R, Assessment of the macula function by static perimetry, microperimetry and rarebit perimetry in patients suffering from dry age related macular degenerationKlin Oczna 2007 109(4-6):131-34. [Google Scholar]
[21]. Dal Vecchio M, Lavia C, Nassisi M, Grignolo FM, Fea AM, Microperimetric assessment after epiretinal membrane study: 4 year follow-upJournal of Ophthalmology 2016 2016:7030791 [Google Scholar]
[22]. Munk MR, Kiss CG, Huf W, Montuoro A, Sulzbacher F, Kroh M, Visual acuity and microperimetric mapping of lesion area in eyes with inflammatory cystoid macular oedemaActa Ophthalmol 2014 92:332-38. [Google Scholar]
[23]. Görgün E, Yenerel NM, Dinc UA, Tatlipinar S, Kucumen RB, Kulacoglu D, Central retinal function assessment using microperimetry in patients with idiopathic epiretinal membraneRet-Vit 2010 18:263-68. [Google Scholar]
[24]. Ozdemir H, Senturk F, Karacorlu M, Arf Karacorlu S, Uysal O, Macular sensitivity in eyes with central serous chorioretinopathyEur J Ophthalmol 2008 18(5):799-804. [Google Scholar]
[25]. Janet S, Sunness MD, Carol A, Applegate BLA, Haselwood D, Robin GS, Fixation patterns and reading rates in eyes with central scotomas from advanced atrophic age-related macular degeneration and Stargardt diseaseOphthalmology 1996 103(9):1458-66. [Google Scholar]
[26]. Testa F, Melillo P, lorio VD, Orrico A, Attanasio M, Rossi S, Macular function and morphological features in juvenile Stargardt dsease: Longitudinal studyOphthalmology 2014 121(2):2399-405. [Google Scholar]