Serum Free T3 to Free T4 Ratio as a Useful Indicator for Differentiating Destruction Induced Thyrotoxicosis from Graves’ Disease
Suman Baral1, Pradeep Krishna Shrestha2, Vivek Pant3
1 Faculty Doctor, Endocrinology Unit, Department of Medicine, Institute of Medicine, Kathmandu, Nepal.
2 Professor and Head, Endocrinology Unit, Department of Medicine, Institute of Medicine, Kathmandu, Nepal.
3 Resident Doctor, Department of Biochemistry, Institute of Medicine, Kathmandu, Nepal.
NAME, ADDRESS, E-MAIL ID OF THE CORRESPONDING AUTHOR: Dr. Suman Baral, Maharajgunj, Kathmandu, Nepal.
E-mail: drsumaniom@gmail.com
Introduction
Thyrotoxicosis is a common disease encountered in Endocrine Outpatient Department (OPD). Two common causes of thyrotoxicosis are Destruction Induced Thyrotoxicosis (DIT) and Graves’ Disease (GD). Differentiating DIT and GD based on clinical findings, is often not possible due to nonspecific symptoms. Thyroid scan is considered most reliable method for differentiating DIT and GD.
Aim
To differentiate DIT and GD using the ratio of free triiodothyronine (fT3) and free thyroxine (fT4) thus avoiding thyroid technetium scan which is expensive and not accessible in developing countries like Nepal.
Materials and Methods
Patients attending Endocrine OPD with diagnosis of thyrotoxicosis at their first visit in which Thyroid technetium scan could be done were taken as sample.
The study was conducted from mid-June 2016 to February 2017 and total 55 samples were taken. Only selected cases were taken where diagnostic dilemma was present. Report of Thyroid Function Test (TFT) of patient at their first visit and findings of thyroid scan were recorded. Ratio of freeT3 and freeT4 was obtained in each case. ROC curve was plotted and the cut off value for differentiation of DIT and GD was obtained. All data were analysed using SPSS software version 20.0.
Results
Mean ratio of fT3 to fT4 in GD and DIT was 0.395 and 0.287 respectively which was significant. On ROC analysis, cut off ratio for differentiating GD and DIT was 0.30 with sensitivity of 87% and specificity of 62.5%.
Conclusion
It is recommended that thyroid scan can be avoided if ratio of fT3 and fT4 is less than 0.3 and a diagnosis of DIT can be made.
fT3 (triiodothyronine), fT4 (thyroxine), Thyroid scan
Introduction
Thyrotoxicosis is a common disease with prevalence of 3% in central region of Nepal [1]. Common causes of thyrotoxicosis include Graves’ Disease (GD), Destruction Induced Thyrotoxicosis (DIT), toxic adenoma and multinodular goitre. Differentiation between DIT and GD is not always possible clinically and it is very essential for clinician to identify the correct diagnosis, since symptomatic treatment is needed in DIT but extensive medical therapy along with occasional thyroid ablation is required in cases of GD [2].
Ratio of free triiodothyronine (fT3) to free thyroxine (fT4) has been advocated in differentiation of DIT and GD in numerous studies [3,4]. Though radioactive iodine uptake/technetium scintigraphy is considered a standard measure for differentiating these two conditions, not all health care centre provide this facility and this type of scan is quite expensive too [5]. Ratio of total T3 to total T4 is a helpful index for differentiating between GD and DIT [5]. Total T3 to total T4 ratio below 20 ng/mg is considered as DIT [5]. Measurement of free T3 and free T 4 instead of total form is commonly done since free forms are less affected by thyroid hormone binding protein. Ratio of free T3 to free T4 has been advocated for the differential diagnosis of GD and DIT [2]. Usefulness of this ratio has not been studied in Nepalese population. Since Nepal belong to the area of Iodine deficiency, cut off values for this ratio should be established for the benefit of clinicians and patients.
The present study was designed to correlate the findings of thyroid scan with serum fT3 to fT4 ratio in patients with thyrotoxicosis and obtain a cut off value of this ratio to distinguish between GD and DIT.
Materials and Methods
A prospective study was done on patients, attending endocrine OPD in Institute of Medicine, Kathmandu, Nepal, with diagnosis of thyrotoxicosis at their first visit and in whom Thyroid technetium scan could be done. Confirmed diagnosis of thyrotoxicosis was made on clinical grounds along with values of Thyroid Stimulating Hormone (TSH) less than 0.1µ IU/ml [5]. The study was conducted from mid-June 2016 to February 2017 and total 55 patients were taken. Patients taking drugs that affect TFT or those who have already started antithyroid medication, patients below 15 years of age, pregnancy, patients with painful thyroiditis or palpable nodules, patients with obvious features of graves’ disease and single or multiple nodules discovered in thyroid scintigraphy were excluded. TFT reports of patient at their first visit were recorded. Ethical clearance to conduct the study was taken from the Institutional Research Board. Informed consent was taken from patient to be part of this study. Assay of TFT was performed on Enhanced Chemiluminescence Immunoassay (ECI) on VitrosDiagnostic, Johnsons and Johnsons; in Central Biochemistry Laboratory of Institute of Medicine (IOM), Maharajgunj. Technetium 99m Thyroid Scan was done at Gamma Imaging centre in Maharajgunj, Kathmandu. Intravenous administration of 5 mCi dosage of Tc 99m- per technetate was done and static image of thyroid gland after 20 minutes in multiple projection was taken. Quantification of total uptake of tracer by the gland was taken as percentage uptake of right and left lobe thus giving total uptake. Normal reference of total percentage uptake range was 0.5%-4%. Uptake values below 0.5% was diagnosed as DIT and above 4% as GD.
Statistical Analysis
Statistical analysis was performed using SPSS software version 20.0. Ratio of free T3 and free T4 both in pmol/L was obtained in each case. Data are presented as mean±SD (standard deviation). Receiver Operating Characteristic (ROC) curve was prepared to obtain cut off value for discriminating GD from DIT along with sensitivity and specificity.
Results
Demographic Details
Out of 55 patients 43 (78.18%) were females and 12 (21.81%) were males. Mean age of patient was 43.8±15.7 (range 16-67 years). Of these patients 23 (41.81%) were diagnosed with GD and 32 (58.18%) were diagnosed with DIT using Technetium 99m Thyroid Scan.
fT3 to fT4 Ratio for Differentiating between GD and DIT
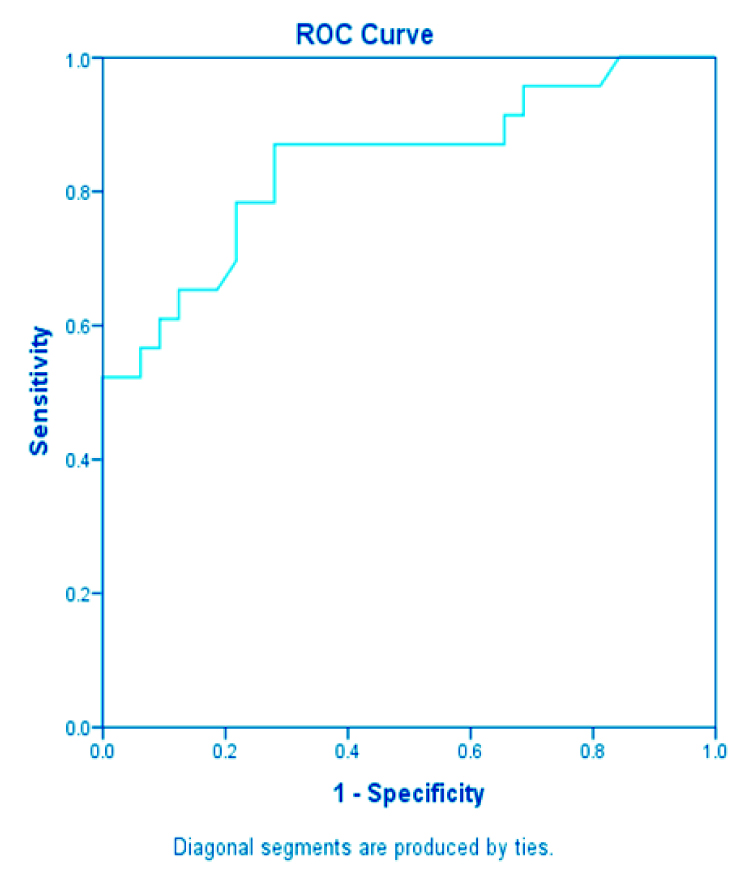
Mean ratio of fT3 to fT4 in GD was 0.395 with standard deviation 0.085 (95% CI: 0.358 to 0.432) and mean ratio of fT3 to fT4 in DIT was 0.287 with standard deviation 0.059 (95% CI: 0.265 to 0.309) as shown in [Table/Fig-1]. On Receiver Operating Characteristic (ROC) curve analysis [Table/Fig-2] cut off ratio was 0.3050 with sensitivity of 87% and specificity of 62.5%.
Comparison of sample size, mean and SD of fT3 to fT4 ratio between Graves’ Disease (GD) and Destruction Induced Thyrotoxicosis (DIT).
| Disease | Sample size | Mean | Standard Deviation (SD) |
|---|
| GD | 23 | 0.395 | 0.085 |
| DIT | 32 | 0.287 | 0.059 |
Discussion
Prevalence of thyrotoxicosis in central region of Nepal is 3% [1]. Clinical differentiation between cases of GD and DIT is possible when signs of Graves’ disease are present like eye signs. Most of the times these two entities cannot be differentiated clinically. Various laboratory parameters have been advocated for differentiation like testing for TSH Receptor Antibody (TRAb) [6], use of nuclear medicine [3], peripheral eosinophil/monocyte ratio [3] and serial changes in liver function test [7]. None of these tests are suitable due to unavailability or difficulty in use and identification of simple measure for differentiation like, ratio of fT3 to fT4 is useful in our context. Our result is consistent with the findings of previous literature [3].
These types of studies conducted previously were mostly retro-spective in design based on medical records [4]. One of the way our prospective design is superior is that we could purposively choose cases where frank signs of Graves’ disease or nodules were absent on clinical examination leading to diagnostic dilemma between GD and DIT. Sometimes during recovery phase of thyroiditis, the radioactive iodine uptake increases and scan demonstrates increased activity leading to confusion with Graves’ disease [8]. So, these group of patients were excluded from our study by asking their clinical history of interval decline in symptoms. Radionuclide thyroid scanning using technetium pertechnetate (Tc99m) is useful in differential diagnosis of GD and DIT and identifies other benign thyroidal illness like thyroid nodules [9]. Thyroid uptake of Tc99m and then imaging is the principal nuclear test in thyroid scan [5]. Very low thyroid uptake suggests destructive event leading to thyroiditis and increased uptake is seen in Graves’ disease [10]. All cases were scanned at same place, Gamma Imaging Centre at Maharajgunj to avoid discrepancies in result. Normal reference of total percentage uptake range was taken as 0.5%-4%. Uptake value less than 0.5% was diagnosed as destructive thyroiditis since radio uptake of tracer decreases due to destruction of cells. Values more than 4% uptake were taken as GD as activity throughout the gland is increased. Sometimes in recovery phase of DIT, the radio uptake may increase giving the values in between 0.5%-4%. So, these groups of patients were also excluded from the study.
Serum free T3, T4 and TSH were measured by fully automated Enhanced Chemiluminiscent Immunoanalyzer (Ortho Diagnostic;Johnson and Johnson Company). The assay validity was confirmed by concomitant quality control runs. Thyroid scan can be omitted and a diagnosis of DIT can be made if serum free T3 to free T4 ratio is below 0.30 in thyrotoxicosis patients. The ratio above 0.30 likely confirms diagnosis of GD. T3 is active form of thyroid hormone that is deiodinated from T4 by iodothyronine deiodinase [11]. High expression of this deiodinase in Graves thyroid tissue contributes to higher serum T3 level [12]. This provides the meaningful explanation for the basis of variable fT3 and fT4 ratio among patients with two different aetiologies with similar presentation. Since patient of Graves’ disease might need radio ablative therapy after a mean time, so thyroid scanning can be recommended depending on patient’s clinical status. But thyroid scan can be avoided if fT3 to fT4 ratio is below 0.30. No supporting data regarding usefulness of serum fT3 to fT4 ratio in differentiation of GD and DIT previously exist in Nepalese population. The finding of this study is very helpful for the patients and clinician in our setting where patient’s compliance is poor and resources are limited.
Limitation
Selection of patients from single centre is the limitation of this study. Another limitation is small sample size that represents only central region of Nepal.
Conclusion
If free T3 to free T4 ratio is below 0.30 the diagnosis of DIT can be made and this tool obviates unnecessary expensive and easily inaccessible thyroid scan.
[1]. Mahato RV, Jha B, Singh KP, Yadav BK, Shah SK, Lamsal M, Status of thyroid disorders in Central Nepal: A tertiary care hospital based studyInternational Journal of Applied Sciences and Biotechnology 2015 3(1):119-22. [Google Scholar]
[2]. Noh Jy, Momotani N, Fukada S, Ito K, Miyauchi A, Amino N, Ratio of serum free triiodothyronine to free thyroxine in Graves’hyperthyroidism and thyrotoxicosis caused by painless thyroiditisEndocrine Journal 2005 52(5):537-42. [Google Scholar]
[3]. Izumi Y, Hidaka Y, Tada H, Takano T, Kashiwai T, Tatsumi KI, Simple and practical parameters for differentiation between destruction-induced thyrotoxicosis and Graves’thyrotoxicosisClinical Endocrinology 2002 57(1):51-58. [Google Scholar]
[4]. Sriphrapradang C, Bhasipol A, Differentiating Graves’disease from subacute thyroiditis using ratio of serum free triiodothyronine to free thyroxineAnnals of Medicine and Surgery 2016 10:69-72. [Google Scholar]
[5]. Bahn RS, Burch HB, Cooper DS, Garber JR, Greenlee MC, Klein Hyperthyroidism and other causes of thyrotoxicosis: management guidelines of the American Thyroid Association and American Association of Clinical EndocrinologistsThyroid 2011 21(6):593-646. [Google Scholar]
[6]. Ide A, Amino N, Kang S, Yoshioka W, Kudo T, Nishihara E, Differentiation of postpartum Graves’thyrotoxicosis from postpartum destructive thyrotoxicosis using antithyrotropin receptor antibodies and thyroid blood flowThyroid 2014 24(6):1027-31. [Google Scholar]
[7]. Kubota S, Amino N, Matsumoto Y, Ikeda N, Morita S, Kudo T, Serial changes in liver function tests in patients with thyrotoxicosis induced by Graves’disease and painless thyroiditisThyroid 2008 18(3):283-87. [Google Scholar]
[8]. Smith JR, Oates E, Radionuclide imaging of the thyroid gland: patterns, pearls, and pitfallsClinical nuclear medicine 2004 29(3):181-93. [Google Scholar]
[9]. Hiraiwa T, Ito M, Imagawa A, Isotani H, Takamatsu J, Kuma K, High diagnostic value of a radioiodine uptake test with and without iodine restriction in Graves’disease and silent thyroiditisThyroid 2004 14(7):531-35. [Google Scholar]
[10]. Sarkar SD, Benign thyroid disease: what is the role of nuclear medicine?In Seminars in nuclear medicine 2006 Jul3136(3):185-193.WB Saunders [Google Scholar]
[11]. Bianco AC, Salvatore D, Gereben B, Berry MJ, Larsen PR, Biochemistry, cellular and molecular biology, and physiological roles of the iodothyronine seleno-deiodinasesEndocrine Reviews 2002 23(1):38-89. [Google Scholar]
[12]. Salvatore D, Tu H, Harney JW, Larsen PR, Type 2 iodothyronine deiodinase is highly expressed in human thyroidJournal of Clinical Investigation 1996 98(4):962 [Google Scholar]