Myocardial infarction is one of the most important causes for hospitalization and is commonly seen in all populations worldwide [1]. The clinical approach to a patient suspected to have an acute coronary syndrome consists of detailed history taking, ECG changes, cardiac biochemistry evidence and imaging. The reliability of each of these modalities as a diagnostic tool is dependent on multiple factors, the most significant being the window period between the time of infarction and the time the patient seeks medical attention [2]. The current approach to patients presenting with typical or atypical features of myocardial ischemia or infarction starts with making the provisional diagnosis of acute coronary syndrome [3,4]. Depending on the changes seen on the 12 lead ECG, acute coronary syndrome is classified into STEMI, Non ST Elevation Myocardial Infarction (NSTEMI) or unstable angina [5].
Inspite of major leaps in the diagnostic tools and treatment of myocardial infarction, STEMI persists as one of the leading cause for mortality and morbidity in both the developed and developing world [6]. The prevalence of coronary disease and myocardial infarction is also on rise in the developing countries, with further worsening of adverse cardiovascular events due to disadvantages like inadequate primary prevention policies and limited availability of medical help [7].
There has been extensive research done in the field of cardiovascular medicine focused on ST elevation myocardial infarction and the dynamics of complications surrounding it. One particular area of interest in recent studies appears to be the study of extent of infarct over imaging modalities and its correlation with various events in the course of infarction [8,9]. Other parameters gaining importance are non traditional ECG changes like reciprocal changes, ST depression, QRS morphology, q waves etc., [10-17].
The simplest and oldest diagnostic tool for myocardial infarction is the 12 lead ECG. In daily practice, even though the ECG remains an important test in diagnosis and detection of progression of disease, there still remains ample potential for its role as a prognostic marker [18,19]. The fundamental advantage that stands to be gained by realizing this potential is the time it saves for immediate intervention. In addition, it can serve as an instant and cost effective method for risk assessment instead of waiting for biochemical and angiography results. The purpose of this study was to observe the association between ECG changes (reciprocal changes and QRS amplitude) with left ventricular function, wall motion score and clinical outcome in patients with first episode of STEMI.
Materials and Methods
It was a prospective study done in PSG Institute of Medical Sciences and Research, Coimbatore, Tamil Nadu, India, from January 2014 to September 2014. The study population comprised of patients hospitalized after being diagnosed with STEMI based on ST elevation seen on ECG done at admission. All those patients aged above 18 years admitted with first episode of STEMI, who underwent uncomplicated thrombolysis, were included in the study. Those patients with bundle branch blocks, pre-existing cardiac illness, re-infarction, with clinical findings of severe LVD at presentation and who underwent angioplasty were excluded from the study. Informed consent was obtained from the patients.
The patient’s age, gender, risk factors for myocardial infarction were documented at admission. The first ECG taken was studied for presence or absence of reciprocal changes. The total of R wave amplitude in mm and S wave amplitude in all the leads of the ECG was taken and the sum was noted as the QRS amplitude. Left ventricular function was assessed by 2-D echocardiogram based on ejection fraction using eyeballing method. Patients were graded as having mild LVD if the ejection fraction was 45%-50%, moderate LVD if ejection fraction was 35%-45% and severe LVD if ejection fraction was less than 35% [20].
Regional wall motion abnormality was assessed using American Society of Echocardiography (ASE) method by grading wall motion of all 17 left ventricular segments. This was represented as wall motion score. For each of the individual 17 segments, score of 1 was taken as normal regional wall motion; score of 2 was given for hypokinesia, score of 3 for akinesia, score of 4 as dyskinesia and 5 for anuerysm. So, if a patient’s echo showed normal left ventricular function, the total wall motion score was 17 for all segments together [21]. Clinical outcome of the patient was assessed in terms of New York Heart Association (NYHA) classification based on symptoms at first follow up after discharge from the hospital (which was commonly three to four weeks after infarction) [22].
Statistical Analysis
The data collected from the patients was tabulated using Microsoft excel. Statistical analysis was done using SPSS software. Probability was calculated using chi-square test, independent t-test and ANOVA analysis. The p-value was considered significant if it was found to be less than 0.05.
Results
A total of 120 patients were included in the study. Six patients were excluded because the area of STEMI was inferior wall and posterior wall. So, a total of 114 patients presenting with STEMI were included.
Out of the total 114 patients studied, 78 (68.4%) had AWMI and 36 (31.6%) had IWMI. Among the total study population, 55 (48.2%) patients had reciprocal changes in ECG. Of the 78 patients with AWMI, 35 (63.6%) had reciprocal changes in ECG. Of the 36 patients with IWMI, 20 (36.4%) had reciprocal changes.
Association between Reciprocal Changes and LVD
Out of 55 patients with reciprocal changes, 38 patients (69.1%) developed LVD [Table/Fig-1]. The association between the two variables was found significant (chi-square test value = 0.002).
Correlation between reciprocal changes and LV dysfunction.
| Reciprocal Changes | Left Ventricular Dysfunction | Pearson Chi-square p-value |
|---|
| Yes | No |
|---|
| Yes | 38(69.1%) | 17 (30.9%) | 0.002 |
| No | 41(69.5%) | 18(30.5%) |
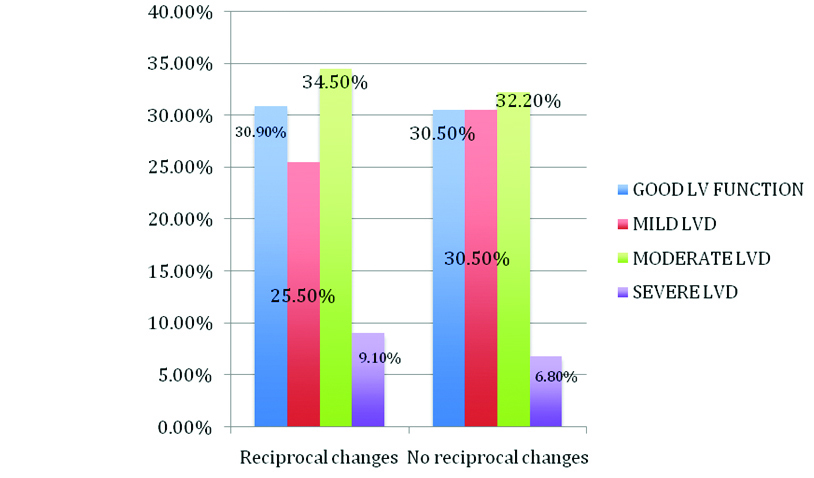
Of the 55 patients who had reciprocal changes in their ECGs, 17 (30.9%) had adequate left ventricular function, 14 (25.5%) patients had mild LVD, 19 (34.5%) had moderate LVD and the remaining 5 (9.1%) patients had severe LVD [Table/Fig-2].
Reciprocal changes and LV dysfunction.
In the 78 patients with AWMI, 35 patients had reciprocal changes. The association between presence of reciprocal changes and LVD was found using chi-square test and was insignificant (p-value = 0.843). Out of the 35 patients with reciprocal changes, 6 (40%) patients had adequate left ventricular function and out of the 43 patients without reciprocal changes, 9 (60%) patients had adequate left ventricular function [Table/Fig-3].
AWMI - reciprocal changes vs. LV dysfunction.
| LVD | Reciprocal changes | Total |
|---|
| No | Yes |
|---|
| No LVD | 9(60%) | 6(40 %) | 15(100%) |
| Mild LVD | 13(59.1%) | 9(40.9%) | 22(100%) |
| Moderate LVD | 19(52.8%) | 17(47.2%) | 36(100%) |
| Severe LVD | 2(40%) | 3(60%) | 5(100%) |
| Total | 43(53.1%) | 35(44.9%) | 78(100%) |
In the 36 patients with IWMI, 20 patients had reciprocal changes. The association between presence of reciprocal changes and LVD was found using chi-square test and was insignificant (p-value = 0.856). Out of these 20 patients with reciprocal changes, 11 (55%) patients had adequate left ventricular function and out of the 16 patients without reciprocal changes, 9 (56.3%) patients had adequate left ventricular function [Table/Fig-4].
IWMI - Reciprocal changes v/s LV dysfunction.
| ReciprocalChanges | NoLVD | Mild LVD | ModerateLVD | SevereLVD | Total |
|---|
| No | 9 (56.3%) | 5 (31.3%) | 0 (0%) | 2 (12.5%) | 16 (100%) |
| Yes | 11(55%) | 5 (25%) | 2 (10%) | 2 (10%) | 20 (100%) |
| Total | 20 (55.6%) | 10 (27.8%) | 2 (5.6%) | 4 (11.1%) | 36 (100%) |
Association between Reciprocal Changes and Wall Motion Score
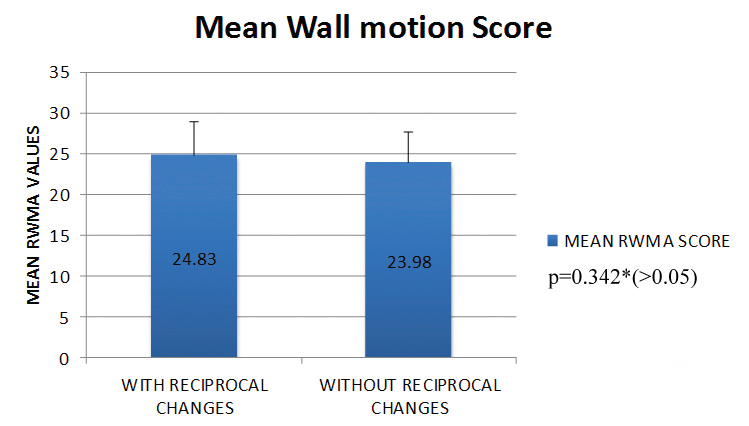
In the 78 patients with AWMI, the association between reciprocal changes and wall motion score was analysed. The mean wall motion score in patients with and without reciprocal changes were 24.83 ± 4.1 and 23.98 ± 3.6 respectively [Table/Fig-5]. The difference between the two groups was not significant (p-value = 0.342).
Mean wall motion score and reciprocal changes in AWMI.
* Independent t-test
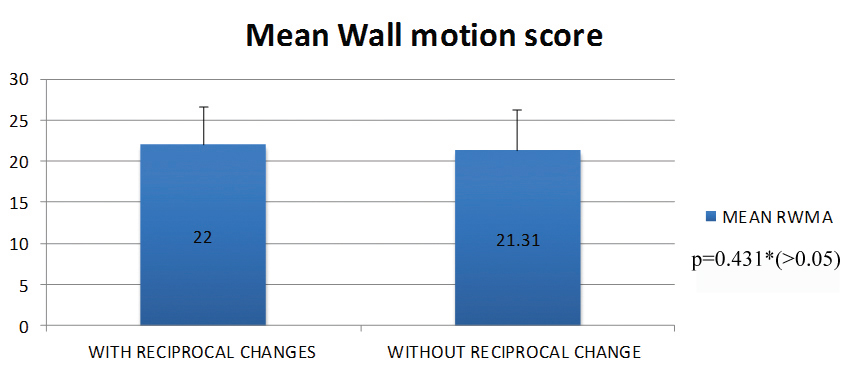
In the 36 patients with IWMI, the association between reciprocal changes and Wall motion score was analysed. The mean Wall motion score in patients with and without reciprocal changes were 22 ± 4.623 and 21.31 ± 4.99 respectively [Table/Fig-6]. The difference between the two groups was not significant (p-value = 0.431).
Mean wall motion score and reciprocal changes in IWMI.
* Independent t-test
Association between Reciprocal Changes and Symptoms at Follow up
A total of 35 out of 78 patients with anterior wall infarction had reciprocal changes in their ECGs. Among these 35 patients, 15 (42.9%) had NYHA Class I symptoms, 14 (40%) patients had NYHA Class II symptoms, 4 (11.4%) patients had NYHA Class III symptoms and 2(5.7%) were lost to follow up [Table/Fig-7]. The p-value calculated using Pearson chi-square test and was found to be statistically significant (p = 0.001). This indicates those patients who had reciprocal changes are at high risk to develop cardiac failure symptoms at follow up.
Correlation between reciprocal changes and clinical outcome in AWMI.
| Reciprocal Changes | Outcome at First Follow up |
|---|
| NYHA Class I | NYHA Class II | NYHA Class III | Lost to follow up |
|---|
| YES | 15 (42.9%) | 14 (40%) | 4(11.4%) | 2(5.7%) |
| NO | 33(76.7%) | 5(11.6%) | 0(0%) | 5(11.6%) |
Out of the 36 patients with IWMI, 20 patients had reciprocal changes in their ECGs. Among those 20 patients, 9 (45%) had no symptoms NYHA Class I, 10 (50%) patients had NYHA Class II symptoms and 1 (5%) patient had NYHA Class III symptoms [Table/Fig-8]. The p-value calculated using Pearson Chi square test was statistically significant (p = 0.004). This also indicates those patients who had reciprocal changes are at high risk to develop cardiac failure symptoms at follow up.
Correlation of reciprocal changes and clinical outcome in IWMI.
| Reciprocal Changes | Outcome at First Follow up |
|---|
| NYHA Class I | NYHA Class II | NYHA Class III | Lost to Follow up |
|---|
| YES | 9(45%) | 10(50%) | 1(5%) | 0(0%) |
| NO | 15(93.8%) | 0(0%) | 0(0%) | 1(6.3%) |
Association between QRS amplitude and LV Dysfunction
The mean QRS amplitude of all patients with LVD was 33.25 ±16.34. The mean QRS amplitude in patients with AWMI was 34.17 ± 16.93 and with IWMI was 35.03 ± 14.42. The association between QRS amplitude and LVD was analyzed [Table/Fig-9a] in patients with AWMI using ANOVA test and was found to be statistically insignificant (p-value = 0.307). The association between QRS amplitude and LVD was analyzed in patients with IWMI using ANOVA test and was found to be statistically insignificant (p-value 0.156) [Table/Fig-9b].
QRS amplitude and LV dysfunction in AWMI.
| LVD | QRS Amplitude Score | p-value (ANOVA) |
|---|
| n | Mean | Std. Deviation | Std. Error of Mean |
|---|
| No | 15 | 34.03 | 18.564 | 4.793 | 0.307 |
| Mild | 22 | 39.36 | 19.638 | 4.187 |
| Moderate | 36 | 32.14 | 14.54432 | 2.424 |
| Severe | 5 | 26.4 | 13.198 | 5.902 |
QRS amplitude and LV dysfunction in IWMI.
| LVD | QRS Amplitude Score | p-value (ANOVA) |
|---|
| n | Mean | Std. Deviation | Std. error of Mean |
|---|
| No | 20 | 38.48 | 13.758 | 3.076 | 0.156 |
| Mild | 10 | 35.25 | 16.622 | 5.256 |
| Moderate | 2 | 23 | 4.243 | 3 |
| Severe | 4 | 23.25 | 5.679 | 2.839 |
Association between QRS Amplitude and Wall Motion Score
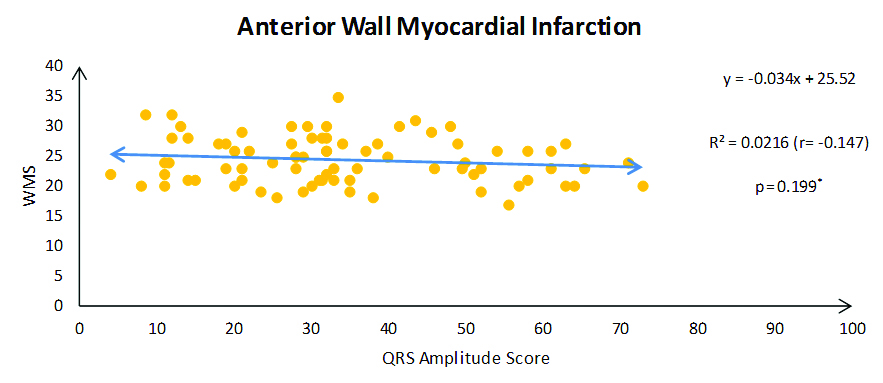
The mean QRS amplitude in all the 114 patients was 34.17 ± 16.929. The mean wall motion score in all 114 patients was 24.36 ± 3.915. Using Pearson chi-square test, the correlation was statistically significant (r-value = - 0.210). The mean QRS amplitude in AWMI patients was 34.17 ± 16.9 [Table/Fig-10]. The mean wall motion score in AWMI patients was 24.36 ± 3.9. Using the Pearson chi-square test, the correlation was found to be statistically significant (r-value = -0.147, p= 0.199).
QRS amplitude and wall motion score in AWMI.
*Pearson chi-square test
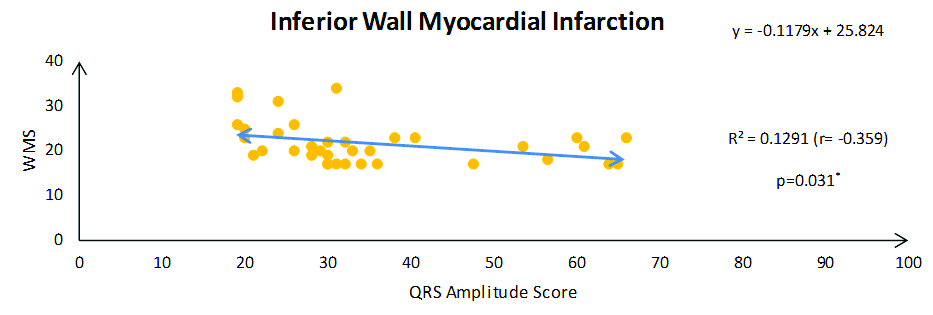
The mean QRS amplitude in IWMI patients was 35.03 ± 14.4. The mean wall motion score in IWMI patients was 21.69 ± 4.7 [Table/Fig-11]. Using the Pearson chi-square test, the correlation was found to be statistically significant (r-value = - 0.359, p= 0.031)
QRS amplitude and wall motion score in IWMI.
*Pearson chi-square test
Association between QRS Amplitude and Symptoms at Follow up
Among the 78 patients with anterior wall STEMI, 48 patients had no symptoms at first follow up (NYHA Class I), 23 patients were symptomatic (NYHA Class II and above) and seven patients lost to follow up. In these 48 patients under NYHA Class I, the mean QRS amplitude was 33.95 ± 18.17. In these 23 patients under NYHA Class II and above, the mean QRS amplitude was 35.30 ± 15.12. The difference between the two groups was statistically insignificant (p = 0.759). Among the 36 patients with IWMI, 24 patients had no symptoms at first follow up (NYHA Class I), 11 patients were symptomatic (NYHA II and above) and one patient lost to follow up. In these 24 patients under NYHA Class I, the mean QRS amplitude was 34.70 ± 13.47. In these 11 patients under NYHA Class II and above, the mean QRS amplitude was 36.72 ± 17.17. The difference between the two groups was statistically insignificant (p = 0.706).
Discussion
In our study, reciprocal changes in the ECG were seen in about half of the patients (48.2%), of which around two thirds had AWMI and the remaining had IWMI. Majority of the patients studied (69.3%) had LVD following STEMI. The presence of reciprocal changes in ECG showed significant association with development of LVD when analyzed in all the patients in total. When the subset of patients with reciprocal changes in AWMI and IWMI were considered separately, the association with LVD was statistically insignificant. This was in-contrast to the study by Peterson ED et al., which showed ST depression in precardial leads in IWMI had poor prognosis [11].
A similar result was found in a study done by Atroush HE et al., ejection fraction was not statistically different in patients with acute IWMI with and without precordial ST segment depression [23]. This was in contrast to the study by Parale GP et al., where they found that patients with AWMI and IWMI with reciprocal changes had significant LVD compared to those without [24]. Zoghi M et al., also found that patients of AWMI with reciprocal ST depression and without had significant difference with regard to ejection fraction [25]. Atroush HE et al., in their study, found that patients with AWMI infarction with precordial ST segment depression had significant complications during hospital course than patients without reciprocal changes [23]. Salcedo JR et al., also found that complications during hospital stay were more in patients of AWMI with precardial ST segment depression [26].
In AWMI patients, the presence of reciprocal changes did not reflect in an increase in the wall motion score. When a similar association was analyzed in IWMI patients, it was also found to be insignificant. The association between reciprocal changes and clinical outcome in terms of NYHA class of symptoms on first follow up was found to be significant. This may imply that the presence of reciprocal changes can spell worse outcome following STEMI when compared to those without reciprocal changes in their ECG.
On analyzing the association between QRS amplitude and wall motion score revealed that a decrease in QRS amplitude was associated with an increase in wall motion score in both AWMI and IWMI patients. When the association between QRS amplitude and degree of LVD was found, it was statistically insignificant. This meant that low QRS amplitude did not reflect the degree of LVD.
This is the first study of this kind correlating reciprocal changes and QRS amplitude with LVD and clinical outcome in STEMI.
Limitation
The limitation of the study is the small sample size; we need a larger study with higher sample size to extrapolate the findings. We also agree the assessment of outcome at follow up has confounding factors like compliance with medication, diet and lifestyle modification measures.
Conclusion
In STEMI, the patients who had reciprocal changes in their ECG were more prone to develop LVD, but this significance was lost when individual areas of infarction were considered. The presence of reciprocal changes in the ECG can signify poorer outcome on follow up at three to four weeks after infarction. In patients with lower QRS amplitudes, higher wall motion scores were observed, indicating that low voltage of QRS complexes in the ECG can be predictive of larger extent of the infarct. Even though we are in the era of primary PTCA and early re-vascularisation therapy for STEMI, ECG is a very useful tool to prognosticate where early revascularization option is not available.