Obesity is associated with numerous comorbidities such as coronary heart disease, type 2 diabetes, hypertension, certain cancers, sleep apnea and many other disorders [1]. Because of the lifestyle, socioeconomic status, advancement in entertainment and technology such as television, computer, and video games the prevalence of overweight and obesity has been increased [2].
The aim of this study was to record and compare the central and general adiposity indices, electrocardiographic variables and vascular stiffness indices in normal, overweight and obese young adults. To correlate adiposity indices with QRS duration and amplitude, corrected QT interval and T peak-Tend interval in young adults a to determine the adiposity index which is more strongly correlated with change in electrocardiographic variables and to correlate adiposity indices with vascular stiffness and reflection indices in young adults and to determine the adiposity index which is more strongly correlated with change in vascular stiffness indices.
Materials and Methods
This was a cross-sectional study conducted in the research lab, Department of Physiology, SRM Medical College Hospital and Research Institute, Kattankulathur, Chennai, Tamilnadu, India, for a period of two months from March 30th to May 30th 2016. The subjects enrolled in this study had been divided into control, overweight and obese group based on the BMI classification of WHO for Asian population [11].
Group 1 was considered as control group (BMI: 18.5-22.9). It included 30 apparently healthy male volunteers, with their age ranging from 18-25 years.
Group 2 was considered as overweight group (BMI: 23-24.9). It included 30 apparently healthy male volunteers, with their age ranging from 18-25 years.
Group 3 was considered as obese group (BMI: >25). It included 30 apparently healthy male volunteers, with their age ranging from 18-25 years.
Institutional Ethical Clearance was obtained. Written informed consent was obtained from all the participants prior to the initiation of study. A complete record of medical and personal history was obtained from all the subjects.
Apparently healthy obese, overweight and normal male individuals within the age group of 18-25 years were involved. Those who were smokers and alcoholics and with history of cardiovascular diseases, kidney disease, thyroid disorders, diabetes, hypertension, syncope were excluded. Those on medications such as diuretics, antidepressants, antipsychotic and other drugs which might prolong QT interval were also excluded from the study.
Measurements
Blood pressure was measured in accordance with the British hypertension society guidelines [13] using a mercury sphygmomanometer and stethoscope. Standing height was recorded without shoes and with light clothes using stadiometer to the nearest of centimeters. Weight was recorded without shoes and with light clothes on a weighing machine.
BMI was calculated as body weight (kg) divided by body height (m2).
Waist and hip circumferences were obtained using a stretchable measuring tape in standing position. Waist circumference was measured at approximate midpoint between the lower margin of the last costal rib and the top of the iliac crest. Hip circumference was taken around the widest portion of the buttocks [14].
Waist-to-hip Ratio (WHR) was calculated from the above measurements by using the formula, WHR = waist circumference (cm) divided by hip circumference (cm).
Waist to height ratio was calculated from the above measurements by using the formula, waist circumference (cm) divided by height (cm).
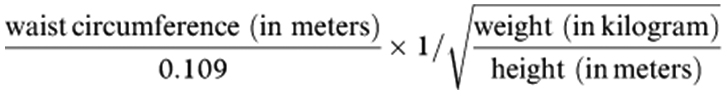
The conicity index (C index) was derived using the following formula [15]:
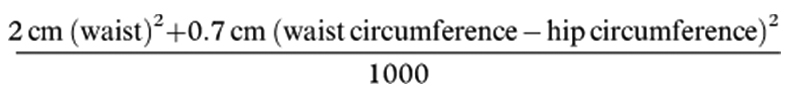
Abdominal volume index was obtained from the formula [5]:
Recording of ECG
While the subjects were resting in supine position, electrocardiogram was performed with the paper speed of the 25 mm/sec and amplitude of 10 mm/mV. Heart rate, QRS duration and amplitude, QT interval, T peak-T end interval was measured. Corrected QT interval was calculated according to Bazett’s formula [16].
Recording of Pulse Wave
Pulse wave was recorded using the Physiopac – Medicaid systems. Stiffness index and reflection index were calculated.
Stiffness index: It is the measure of large artery stiffness. It was calculated by subject’s height in meters divided by time delay between direct and reflected waves.
Reflection index: It is the measure of vascular tone of small arteries. It was calculated by the formula RI = a/b *100, where ‘a’ and ‘b’ are the amplitudes of the pulse wave and reflection wave respectively.
Statistical Analysis
Statistical analysis was done using SPSS version 19.0 software. For comparison of variables among three groups, ANOVA test was done. Pearson’s correlation coefficients were applied to establish the correlations between variables. A p-value <0.05 was considered to be significant.
Results
The study included 90 male subjects who were divided into three equal groups of 30 each based on their BMI. [Table/Fig-1] shows anthropometric measurements of Group 1,2 and 3 individuals.
Anthropometric measurements of the subjects.
| Parameters | Group 1 (Mean±SD) | Group 2 Mean±SD) | Group 3 Mean±SD) |
|---|
| Height (cm) | 173.43±5.78 | 170.87±5.42 | 174.05±7.5 |
| Weight (kg) | 62.43±6.43 | 70.20±4.87 | 92.07±11.07 |
| WC (cm) | 76.8±7.8 | 82.3±6.76 | 93.67±9.9 |
| HC (cm) | 89.27±5.94 | 93.95±5.27 | 105.07±9.16 |
(WC: Waist Circumference, HC: Hip Circumference)
[Table/Fig-2] shows comparison of various adiposity indices between groups. There was significant difference in the body mass index, waist circumference, waist height ratio, conicity index and abdominal volume index between the groups.
Comparision of adiposity indices between groups.
| Parameters | Group 1 Mean±SD) | Group 2 Mean±SD) | Group 3 Mean±SD) | p-value |
|---|
| BMI | 20.7±1.67 | 24±0.52 | 30.4±3.5 | <0.001* |
| WC (cm) | 76.8±7.8 | 82.3±6.76 | 93.67±9.9 | <0.001* |
| WH | 0.86±0.09 | 0.88±0.05 | 0.89±0.06 | 0.228 |
| WHT | 0.44±0.05 | 0.48±0.03 | 0.54±0.06 | <0.001* |
| CI | 0.33±0.02 | 0.31±0.01 | 0.28±0.01 | <0.001* |
| AVI | 12.0±2.39 | 13.76±2.22 | 17.86±3.63 | <0.001* |
(BMI: Body Mass Index, WC: Waist Circumference, WH: Waist and Hip Circumference, WHT: Waist to Height Ratio, CI: Coincity Index, AVI: Abdominal Volume Index, SD: Standard Deviation, ANOVA was done to compare the variables between groups,
: p-value<0.001)
[Table/Fig-3] indicates that there was significant difference in heart rate, QRS duration, corrected QT interval and in systolic blood pressure between the groups.
Comparison of electrocardiographic variables and blood pressure between groups.
| Parameters | Group 1 (Mean±SD) | Group 2 (Mean±SD) | Group 3 (Mean±SD) | p-value |
|---|
| HR (beats/min) | 74.35±11.12 | 74.93±11.93 | 82.1±10.94 | 0.015* |
| QRSD (s) | 0.09±0.01 | 0.11±0.01 | 0.13±0.02 | <0.001* |
| QRSA (mv) | 1.58±0.27 | 1.46±0.34 | 1.4±0.37 | 0.087 |
| QTC (s) | 0.38±0.03 | 0.39±0.04 | 0.43±0.05 | <0.001* |
| TpTe (s) | 0.09±0.01 | 0.11±0.11 | 0.11±0.15 | 0.591 |
| SBP (mmHg) | 111.47±8.03 | 116.9±8.5 | 117.97±9.78 | 0.011* |
| DBP (mmHg) | 72.0±5.0 | 72.63±5.0 | 74.7±5.0 | 0.101 |
(HR: Heart Rate, QRSD: QRS Duration, QRSA: QRS Amplitude, QTC: Corrected QT Interval, TpTe: T-peak-T-end Interval, SBP: Systolic Blood Pressure, DBP: Diastolic Blood Pressure, ANOVA was done to compare the variables between groups
: p-value<0.05)
[Table/Fig-4] compares vascular stiffness indices between groups. There was significant difference between stiffness and reflection indices between normal, overweight and obese individuals.
Comparision of stiffness and reflection indices between groups.
| Parameters | Group 1 (Mean±SD) | Group 2 (Mean±SD) | Group 3 (Mean±SD) | p-value |
|---|
| SI | 4.13±1.02 | 5.0±0.21 | 6.6±1.0 | <0.001* |
| RI | 9.89±3.86 | 12.28±4.70 | 13.12±6.10 | 0.037* |
(SI: Stiffness Index, RI: Reflection Index, SD: Standard Deviation, ANOVA was done to compare the variables between groups
: p-value<0.05)
[Table/Fig-5] correlates various adiposity indices with electrocardiographic variables. Of all the adiposity indices, BMI was found to be strongly positively correlated and CI to be strongly negatively correlated with QRS duration.
Correlation between adiposity indices and electrocardiographic variables.
| Parameters | | HR | QRSD | QRSA | QTC | TpTe |
|---|
| BMI | r-value | 0.3 | 0.8 | -0.2 | 0.6 | 0.1 |
| p-value | 0.001* | <0.001* | 0.038* | <0.001* | 0.553 |
| WC | r-value | 0.3 | 0.6 | -0.2 | 0.5 | 0.1 |
| p-value | 0.001* | <0.001* | 0.022* | <0.001* | 0.439 |
| WH | r-value | 0.2 | 0.2 | -0.2 | 0.1 | -0.05 |
| p-value | 0.019* | 0.109 | 0.136 | 0.225 | 0.619 |
| WHT | r-value | 0.4 | 0.6 | -0.2 | 0.5 | 0.1 |
| p-value | <0.001* | <0.001* | 0.058 | <0.001* | 0.445 |
| CI | r-value | -0.3 | -0.8 | 0.2 | -0.6 | -0.1 |
| p-value | 0.004* | <0.001* | 0.034* | <0.001* | 0.492 |
| AVI | r-value | 0.3 | 0.6 | -0.3 | 0.5 | 0.1 |
| p-value | 0.001* | <0.001* | 0.016* | <0.001* | 0.443 |
(BMI: Body Mass Index, WC: Waist Circumference, WH: Waist and Hip Circumference, WHT: Waist to Height Ratio, CI: Conicity Index, AVI: Abdominal Volume Index, HR: Heart Rate, QRSD: QRS Duration, QRSA: QRS Amplitude, QTC: QT Interval, TpTe: T-peak-T-end Interval, Pearson’s correlation analysis was done to correlate the variables
: p-value<0.05)
[Table/Fig-6] correlates various adiposity indices with vascular stiffness indices. BMI was significantly and positively correlated and CI was significantly negatively correlated to reflection and stiffness indices.
Correlation between adiposity indices and stiffness and reflection indices.
| Parameters | | RI | si |
|---|
| BMI | r-value | 0.5 | 0.9 |
| p-value | <0.001* | <0.001* |
| WC | r-value | 0.3 | 0.7 |
| p-value | 0.007* | <0.001* |
| WH | r-value | 0.1 | 0.2 |
| p-value | 0.270 | 0.087 |
| WHT | r-value | 0.3 | 0.7 |
| p-value | 0.001* | <0.001* |
| CI | r-value | -0.4 | -0.9 |
| p-value | <0.001* | <0.001* |
| AVI | r-value | 0.3 | 0.7 |
| p-value | 0.006* | <0.001* |
(RI: Reflection Index, SI: Stiffness Index, Pearson’s correlation analysis was done to correlate the variables
: p-value<0.05)
Discussion
The relationship between obesity and electrocardiographic variables has been investigated in previous studies especially in middle aged or older adults [17-19]. Our study observed influence of adiposity on electrocardiographic variables especially in young adults. Both total fat and abdominal fat contributed to variations in ventricular electrocardiographic variables [20].
Resting heart rate was found to be significantly increased in obese and overweight young individuals when compared to normal weight individuals. In obese individuals, there is excess production of leptin by the adipose tissue [21]. Consequently, hyperleptinaemia lead to the activation of the sympathetic nervous system which results in increased resting heart rate [21]. Resting heart rate, which is a marker of sympathetic tone, was significantly correlated with both total fat and abdominal fat. It was found to be strongly correlated with waist height ratio which is an indicator of abdominal obesity. Our study suggests increased abdominal obesity is well associated with increased resting heart rate.
Obese groups demonstrated significantly wider QRS duration (greater than 0.12 seconds) when compared with overweight and normal weight groups. Studies have shown that QRS duration, which represents the period of myocardial depolarization, is consistently prolonged in obese humans [22]. Our study confirms that both the abdominal and general obesity correlates significantly with QRS duration. Of all the adiposity indices, BMI was found to be strongly positively correlated and CI to be strongly negatively correlated with QRS duration. Though QRS amplitude appeared to decrease with increased adiposity, there was no significant difference between the groups. Both increase in abdominal and total fat would decrease the QRS amplitude. It was found to be significantly strongly negatively correlated with abdominal obesity especially with abdominal volume index which indicates the abdominal fat.
There had been significant difference in corrected QT interval in obese and overweight individuals when compared to normal weight individuals. Our study shows significant correlation of QTc interval with adiposity indices which is in accordance with various other studies which have reported correlation between obesity and QTc interval prolongation [23]. Our finding contradicts with one study which showed no correlation between BMI and QTc interval in a healthy population aged 22–25 years [24]. Our finding establishes significant strong positive correlation of QTc interval with BMI and negative correlation of QTc interval with conicity index, an indicator of abdominal obesity. Both the total fat and abdominal fat influences the ventricular depolarization and repolarization activity.
T-peak-T-end interval was found to be prolonged in overweight and obese individuals but not to the significant level. T wave peak to end interval is an ECG index of repolarization of the left ventricle. Prolongation of this interval is potential indicator of ventricular arrhythmia risk [25,26]. Morbid obese individuals would have shown significant prolongation of this interval.
Obese and overweight individuals exhibited significantly increased vascular stiffness when compared to normal weight individuals. Our study indicates that both total fat and abdominal fat increases the arterial stiffness. Few studies have shown abdominal fat as a major risk factor for early arterial stiffening and few others have shown BMI which is an indicator of total fat to be a risk factor [27,28]. But in this study, it was found that BMI (indicator of total fat) and CI (indicator of abdominal fat), was significantly strongly correlated with the stiffness and reflection indices. BMI was positively correlated and CI was negatively correlated to vascular stiffness indices. These adiposity indices can be used to assess the vascular stiffness status in young obese individuals. Thus by simple and non invasive method of calculation of BMI and conicity index it could predict the stiffness status of the vessel. Even in young adults increased adiposity leads to early vascular aging leading to cardiovascular complications.
The probable mechanism linking adiposity to vascular stiffening would be due to elevated lipolytic activity of visceral adipocytes resulting in increased free fatty acids release contributing to insulin resistance. Insulin resistance may exert its vascular effects through hyperinsulinemia [29] which causes stimulation of vascular smooth muscle growth. Other mechanisms could be due to increased levels of leptin in obese individuals which leads to reduction in arterial distensibility [30]. Excess adiposity also contributes to arterial stiffness through low-grade inflammation [31].
Limitation
Females would have also been included and compared with that of males in the study. Future studies with larger sample size and including both males and females are required to provide any generalized results.
Conclusion
Thus adiposity indices especially BMI and CI can be used to assess the electrocardiographic abnormalities and vascular stiffness status. Arterial stiffness is a silent killer and electrocardiographic abnormalities are associated with an increased risk of adverse cardiovascular outcomes. Screening for arterial stiffness and electrocardiographic abnormalities using these adiposity indices will be useful to identify high risk young adults. Early interventions can be done in high risk groups in terms of strict diet (avoiding fatty and junk foods) and exercise as research has shown exercise can reverse arterial stiffness.
(WC: Waist Circumference, HC: Hip Circumference)
(BMI: Body Mass Index, WC: Waist Circumference, WH: Waist and Hip Circumference, WHT: Waist to Height Ratio, CI: Coincity Index, AVI: Abdominal Volume Index, SD: Standard Deviation, ANOVA was done to compare the variables between groups,
*: p-value<0.001)
(HR: Heart Rate, QRSD: QRS Duration, QRSA: QRS Amplitude, QTC: Corrected QT Interval, TpTe: T-peak-T-end Interval, SBP: Systolic Blood Pressure, DBP: Diastolic Blood Pressure, ANOVA was done to compare the variables between groups
*: p-value<0.05)
(SI: Stiffness Index, RI: Reflection Index, SD: Standard Deviation, ANOVA was done to compare the variables between groups
*: p-value<0.05)
(BMI: Body Mass Index, WC: Waist Circumference, WH: Waist and Hip Circumference, WHT: Waist to Height Ratio, CI: Conicity Index, AVI: Abdominal Volume Index, HR: Heart Rate, QRSD: QRS Duration, QRSA: QRS Amplitude, QTC: QT Interval, TpTe: T-peak-T-end Interval, Pearson’s correlation analysis was done to correlate the variables
*: p-value<0.05)
(RI: Reflection Index, SI: Stiffness Index, Pearson’s correlation analysis was done to correlate the variables
*: p-value<0.05)